Building upon fine particulate matter (PM2.5) data and the accompanying meteorological conditions in the fall of 2013, Guo et al. (1) conclude that local aerosol nucleation and growth dominantly contributed to severe haze in Beijing, whereas regional transport of PM2.5 played an “insignificant” role. Guo et al.’s conclusion is surprising because it not only requires an uncharacteristic aerosol formation mode for Beijing, but also goes against a broadly held view that “the entire eastern China region, or at least the North China Plain” should be looked at “as a single air basin” if Beijing’s air quality is to be improved (2). Instead of curtailing the emission of aerosol precursor gases in a broader region, Guo et al.’s (1) conclusion would advocate a campaign on limiting traffic and emission within and around the immediate vicinity of Beijing. Already, Beijing’s municipal government has increased urban traffic controls as its number one tactic in an effort to reduce PM2.5.* However, we believe that an in-depth scrutiny of the data makes science more accurate and science-based actions more efficient.
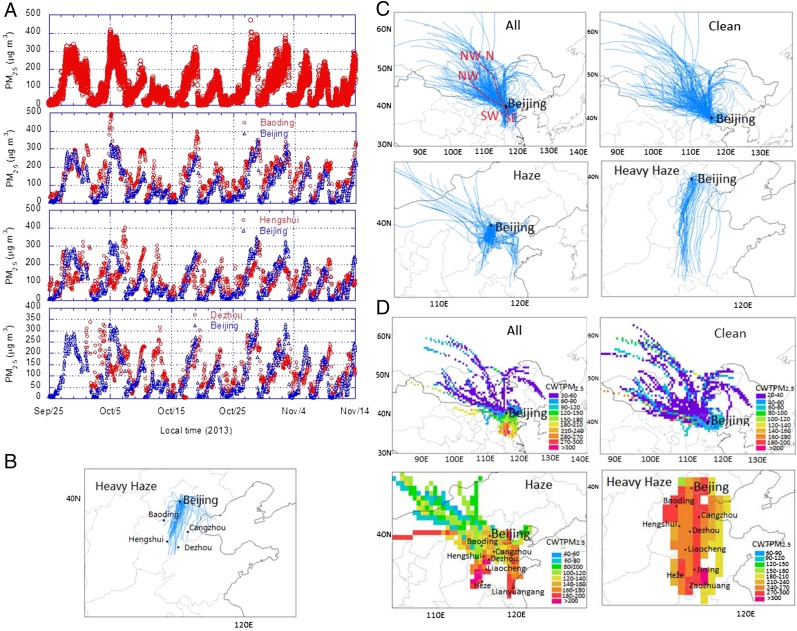
Guo et al. (1) dismiss the contribution of long-distance PM2.5 transport by invoking “the relatively stagnant air mass (less than 50 km⋅d−1) during the pollution periods and the atmospheric lifetimes (about 9.6 d for SO2, 0.5–2.5 d for aromatics, and 1.0 d for NOx).” This conclusion overlooks the fact that secondary PM formation from the oxidation of volatile organic compounds, sulfur dioxide (SO2), and nitrogen oxides (NOx) can occur in air masses during their transport and directly result in a rapid rise in PM2.5 concentrations and haze in Beijing. Thus, examining the contribution of regional transport requires a rigorous source modeling effort missing in Guo et al.’s (1) study. Here we report the results of our hybrid receptor modeling (3, 4) with observations at 10 sites in Beijing and cluster analysis of the 48-h air mass back trajectories for the same study periods. We show that the source areas leading to high PM2.5 in Beijing were primarily located in the southwest and south of Beijing: for example, Baoding and Hengshui in Hebei Province, and Dezhou, Liaocheng, Heze, Jining, and Zaozhuang in Shandong Province (Fig. 1). Temporal evolution of PM2.5 in Beijing is strikingly similar to those at approximately 24 h earlier in these cities (e.g., Baoding), further confirming our conclusion (Fig. 1 A and B).
Fig. 1.
(A) Time series of hourly concentrations of observed PM2.5 at 10 sites [Wanshouxigong (39.87°N, 116.37°E), Changpingzhen (40.20°N, 116.23°E), Nongzhanguan (39.97°N,116.47°E), Tiantan (39.87°N,116.43°E), Guanyuan (39.94°N,116.36°E), Haidianquwanliu (39.99°N,116.315°E), Dongsi (39.95°N, 116.43°E), Gucheng(39.93°N,116.23°E), Shunyixincheng (40.1438°N, 116.72°E), and Aotizhongxin (40.00°N, 116.41°E)] in Beijing (www.cnemc.cn/publish/106/0536/newList_1.html). Temporal evolution of hourly PM2.5 mass concentrations is found to be the same as those in figure 1 of Guo et al. (1). Comparisons of observed daily mean PM2.5 between Beijing and other cities (Baoding, Hengshui, and Dezhou, which are reachable within 24 h by the air masses) are also shown. (B) All 24-h air mass back trajectories for the heavy haze periods (PM2.5 ≥ 200 μg/m3) calculated with the National Oceanic and Atmospheric Administration HYSPLIT model (ready.arl.noaa.gov/HYSPLIT.php) on the basis of the same meteorological data as Guo et al. (1). The mean wind speed is 2.36 m/s and the mean transport distance in 24-h is 204 km during the heavy haze periods. (C) Cluster analysis of the 48-h air mass back trajectories starting at 100 m in Beijing. All back trajectories for the whole period, relatively clean cases (PM2.5 < 75 μg/m3), haze cases (PM2.5 ≥ 75 μg/m3 but PM2.5 < 200 μg/m3), and heavy haze case (PM2.5 ≥ 200 μg/m3) are shown. Four transport pathways (clusters) are determined: SE (SouthEast), SW (SouthWest), NW (Northwest), and NW-W (Northwest-West). (D) Concentration-weighted trajectory (CWT) maps for PM2.5 for the whole, relatively clean, haze, and heavy haze cases on the basis of observations shown in A. A high CWT value implies that air parcels traveling over the grid cell would be associated with high polluted value at the receptor site. The studying period is from September 25 to November 14, 2013.
Our conclusion of regional transport of PM2.5 being the major source of severe smog in Beijing is consistent with past air pollution control measures. “APEC blue,” referring to a cluster of haze-free days during the 2014 Asia Pacific Economic Cooperation Summit, has been widely credited to a forced temporary closure of hundreds of factories in cities that are a surprisingly good match with those in Hebei and Shandong provinces in our list.† Further quantitative research on the source and dynamics of PM2.5 in an air basin is urgent. Such a research effort will benefit from the combination of on-site field measurement, such as the exemplary dataset in Guo et al. (1), and modeling effort at multiple levels.
Footnotes
The authors declare no conflict of interest.
References
- 1.Guo S, et al. Elucidating severe urban haze formation in China. Proc Natl Acad Sci USA. 2014;111(49):17373–17378. doi: 10.1073/pnas.1419604111. [DOI] [PMC free article] [PubMed] [Google Scholar]
- 2.Parrish DD, Stockwell WR. Urbanization and air pollution: Then and now. EOS. 2015;96(1):12–15. [Google Scholar]
- 3.Yu SC, et al. Origin of air pollution during a weekly heavy haze episode in Hangzhou, China. Environ Chem Lett. 2014;12(4):543–550. [Google Scholar]
- 4.Wang YQ, Zhang XY, Draxler R. TrajStat: GIS-based software that uses various trajectory statistical analysis methods to identify potential sources from long-term air pollution measurement data. Environ Model Softw. 2009;24(8):938–939. [Google Scholar]


