

Abstract
Objective:
Lead (Pb) is a long-known poison of environment and industrial origin. Its prolonged exposure affects cellular material and alters cellular genetics and produces oxidative damages. In this study, we investigated the exposure of chronic sustained hypoxia or lead acetate alone or in combination with or without supplementation of α-tocopherol on hepatic oxidative and nitrosative stress in rats.
Materials and Methods:
The rats weighing 165 ± 5 g were exposed to chronic sustained hypoxia (10% oxygen) or lead acetate (25 mg/kg of body weight, intraperitoneally) alone or in combination with or without supplementation of α-tocopherol (10 mg/100 g b.wt, intramuscularly). The body weight of all the rats was recorded on the day 1 of the treatment and the day of sacrifice. Serum lipid profile was estimated by using a biochemical analyzer. Oxidant and enzymatic antioxidants status was evaluated by using spectrophotometer. Serum levels of hypoxia inducible factor-1 alpha (HIF-1α) and vascular endothelial growth factor (VEGF) were measured by using ELISA technique. Histopathological assessments of hepatic tissue were also done.
Results:
Exposure of both lead and hypoxia showed decreased body weight, altered serum lipid profile, oxidant and enzymatic antioxidants status, serum HIF-1α and VEGF concentrations. Simultaneous α-tocopherol supplementation showed beneficial effects to all these alterations. Histopathological observations also showed hepatic degenerative changes after lead or hypoxia exposure either alone or in combination, but remarkable improvement has been noticed after α-tocopherol supplementation.
Conclusion:
Supplementation of α-tocopherol is beneficial to counter both lead acetate and hypoxia induced hepatic cytotoxicities possibly by reducing oxidative and nitrosative stress.
KEY WORDS: α-tocopherol, hypoxia, lead acetate, nitrosative stress, oxidative stress
Introduction
Lead (Pb) is one of the most widely scattered toxic metals in the world. Levels of lead vary widely throughout the world and depend upon the degree of industrial development, urbanization, and lifestyle factors.[1] Lead causes oxidative stress by inducing the generation of reactive oxygen species (ROS), reducing the antioxidant defense system and increasing susceptibility of cells to oxidative attack by altering membrane integrity and fatty acid composition.[2]
Hypoxia is a pathological condition, which causes systemic inflammation response syndrome, multiple organ dysfunctions, and multiple organ failure.[3] Its effects are usually mediated via the activation of hypoxia inducible factor 1 (HIF-1). Another key molecule within this hypoxia-induced response is the presence of nitric oxide (NO). It is synthesized by nitric oxide synthases (NOS) and its release can be stimulated as a result of inflammatory responses, sympathetic activation and drop in oxygen levels.[3]
In this study, we have shown the mechanisms of toxicities caused by heavy metal lead acetate emphasizing on the involvement of the hypoxia signaling pathway by metal-induced generation of ROS and oxidative stress generation. It has been observed that ROS are produced during the exposure of cells to metals that mimic hypoxia.[4] The α-tocopherol is a powerful major membrane bound antioxidant employed by the cell.[5] The protective effect of Vitamin E is a result of the inhibition of free radical formation and activation of endonucleases. Hence, this study was designed to assess the effect of α-tocopherol against hepatic oxidative and nitrosative stress in male albino rats exposed to lead acetate or chronic hypoxia or in both.
Materials and Methods
Animals
Adult (age 60–70 days) laboratory-bred male Wister rats, weighing 165 ± 5 g fed with laboratory stock diet and water ad libitum. They were acclimatized for 7 days to the laboratory conditions at 22°–24°C and a 12 h light: Dark (circadian) cycle. The acclimatized rats were divided into eight groups of six rats each. Three rats were kept in each metabolic wire cage (60 cm × 30 cm × 20 cm). All the animals were taken care of as per the CPCSEA guidelines and the experimental protocol was duly approved by Institutional Animal Ethics Committee (Ref. No. AMC/GNL/128-A/2008-2009 Dated 4/08/2009).
Experimental Groups
Rats in Group I served as a normal control. Group II rats treated with lead acetate alone (2.5 mg/100 g b.wt, intraperitoneally [i.p.]) on alternate days until the 10th dose[6] and Group III rats administered with α-tocopherol alone (10 mg/100 g b.wt, intramuscularly [i.m.]).[7] Group IV rats were given both lead acetate at a dose of 2.5 mg/100 g b.wt, i.p. on alternate days until the 10th dose and i.m. with α-tocopherol at a dose of 10 mg/100 g b.wt) for the same period. Group V rats were exposed to chronic normobaric hypoxic stimulation for the period of 21 days. Group VI rats were exposed to normobaric hypoxic stimulation and simultaneously treated with lead acetate (i.p.) until the tenth doses. Group VII rats were treated with α-tocopherol during exposure with chronic normobaric hypoxic stimulation for the same period. Group VIII rats were exposed to normobaric hypoxic stimulation and simultaneous treated with lead acetate (i.p.) and α-tocopherol (i.m.) for ten doses (21 days).
Exposure of Animals to Chronic Normobaric Hypoxia
Caged rats (4/cage) were put inside a 300-L acrylic chamber, which held a maximum of 4 cages (16 rats), and given inspired oxygen (10% O2 and 90% N2) to induce normobaric hypoxia. The hypoxic environment was established with the inflow of a mixture of room air and nitrogen that was regulated by an oxygen analyzer (model 175518A, Gold Edition, Vacuum Med, Sanchung, Taipei). CO2 was absorbed by soda lime 27 granules, and excess humidity was removed by a desiccator. Temperature was maintained at 24–26°C. The chamber was opened twice a week for 1 h to clean the cages and replenish food and water. Rats were exposed to hypoxia for 21 days.
Gravimetry
The body weight of all the rats was recorded on the day 1 of the lead acetate treatment and the day of sacrifice in a single pan electronic balance (ATCO. Model D2RS02-W).
Biochemical Analysis
Serum lipid profile estimated by using a semi-automated biochemical analyzer (ERBA Star 21 plus) according to manufacturer's protocol.[8] Erythrocyte lipid peroxide (LPO) was measured as the production of malondialdehyde (MDA) by using the method of Okhawa et al.[9] Total erythrocyte glutathione (GSH) was estimated by the method of Beutler et al.[10] superoxide dismutase (SOD) activity was determined according to the method of Mishra and Fridovich.[11] catalase (CAT) activity was determined by the method of Aebi[12] glutathione peroxidase (GSH-Px) activity was determined using a modification of the method of Flohe and Gunzler.[13] The GSH level was measured by the method of Moron et al.[14] LPO levels were estimated in terms of 2-thio-barbituric acid reactants, using, 1,1,3,3-tetramethoxypropane as standard by the method of Okhawa et al.[9]
To determine nitrosative stress we estimated serum inducible-NOS (i-NOS) by ELISA kit (KT-23675, Kamiya Biomedical Company, USA),[15] serum and liver NO by using Greiss Reagent spectrophotometrically.[16] Serum vascular endothelial growth factor (VEGF) was measured using commercially available ELISA kit (KT-EK0540, Boster Biological Company, USA). Serum HIF-1α estimated by using commercially available ELISA kit (KT-17920, Kamiya, Biomedical Company, USA).[17]
Histopathology of the Hepatic Tissues
For the evaluation of histopathology liver from each rat was stored in 10% neutral buffered formalin solution. Fixed tissues were cut and stained with hematoxylin and eosin.[18] The preparations were evaluated under a photomicroscope and photo-graphed Olympus BH-2 (Olympus Optical Company Ltd., Tokyo, Japan) with Samsung Digital Color Camera, Model No. SDC-242, N.J 07094, U.S.A.
Statistical Analysis
Results were presented as mean ± standard deviation values calculated for each group. Statistical analysis of the data was performed to determine the significance of inter-group differences; one-way analysis (ANOVA), followed by “post-hoc t-test” were done.
Results
Gravimetry
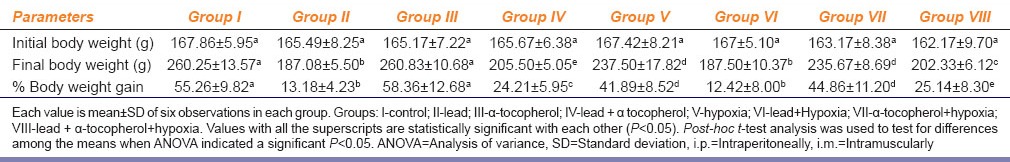
Table 1 shows lead acetate treated Group II and rats exposed to hypoxia Group V were found significant less final body weight gain when compared to normal control Group I. The percentage change gain of final body weight of rats exposed to hypoxia and treated with lead acetate simultaneous (Group VI) were found the least among all the groups. We also observed that α-tocopherol supplementation improved b.wt gain percentage in lead acetate treated rats (Group IV), Group VII and Group VIII in comparison to Group II.
Table 1.
Effect of α-tocopherol (10 mg/100 g of body weight, i.m.) supplementation on lead acetate (25 mg/kg b. wt., i.p.) and chronic normobaric hypoxia (10% oxygen) induced alteration of body weight changes in rats
Serum Lipid Profile
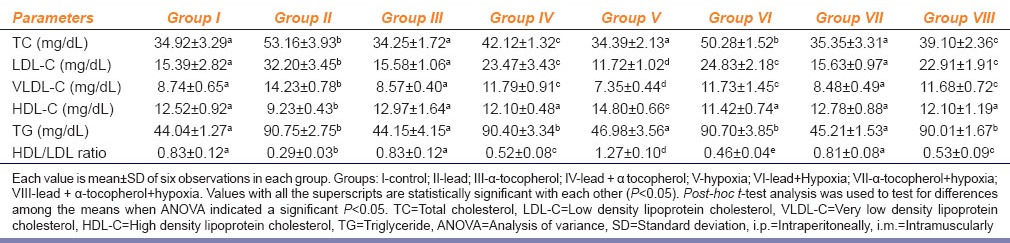
In Table 2, Group II and Group IV showed a significant increase in serum low density lipoprotein (LDL)-cholesterol, very low density lipoprotein (VLDL)-cholesterol, total cholesterol, and triglyceride levels and a significant decrease in the serum high density lipoprotein (HDL)-cholesterol level and HDL/LDL ratio in comparison with Group I. However, the serum LDL-cholesterol level, VLDL-cholesterol, total cholesterol and triglyceride levels were significantly lower and HDL-cholesterol and HDL/LDL ratio were significantly higher in Group IV than those in Group II. Interestingly hypoxia exposure shows a significant higher HDL cholesterol and HDL/LDL ratio and significant lower LDL and VLDL level as compared to Group I. Group VI rats showed a decrease of LDL and VLDL and increase of HDL and HDL/LDL ratio as compared to Group II rats. Group VII rats showed near normal values of all the parameters of lipid profile. In case of Group VIII significant improvement of lipid profile were sited in comparison to Group II rats although the values are still dyslipidemic as compared to Group I.
Table 2.
Effect of α-tocopherol (10 mg/100 g of body weight, i.m.) supplementation on lead acetate (25 mg/kg b. wt., i.p.) and chronic normobaric hypoxia (10% oxygen) induced alteration of serum lipid profile in rats
Oxidant and Enzymatic Antioxidant Status
Table 3 shows increased erythrocyte MDA with concomitant decrease of erythrocyte GSH levels in Group II and Group V rats in comparison to Group I. In Group IV rats decreased erythrocyte MDA and increased erythrocyte GSH levels as compared to Group II rats. In case of Group VI rats were found significantly increased erythrocyte MDA and decreased erythrocyte GSH levels as compared to Group II rats. When Group VI compared to Group V we have noticed only increase of erythrocyte MDA, but erythrocyte GSH levels remained statistically unchanged. In case of Group VII, α-tocopherol supplementation causes decrease of erythrocyte MDA with concomitant increase of erythrocyte GSH levels when it compared to Group V rats. Similarly, when Group VIII compared with Group VI rats a significant decrease of erythrocyte MDA and decrease of erythrocyte GSH were noticed.
Table 3.
Effect of α-tocopherol (10 mg/100 g of body weight, i.m.) supplementation on lead acetate (25 mg/kg b. wt., i.p.) and chronic normobaric hypoxia (10% oxygen) induced alteration of erythrocyte lipid peroxidation MDA, erythrocyte antioxidant (GSH), hepatic lipid peroxidation (hepatic lipid peroxide), hepatic antioxidant, hepatic SOD; hepatic GSH-Px, and hepatic CAT status in rats
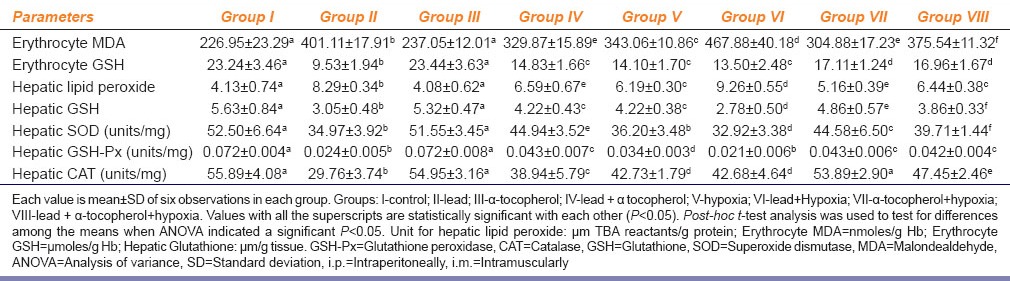
Table 3 shows a significant increase of hepatic LPO with concomitant decrease of hepatic GSH, SOD, GSH-Px and CAT activities in Group II and Group V rats as compared to Group I. Group IV showed decreased hepatic LPO and increased hepatic GSH levels and SOD, GSH-Px and CAT activities as compared to Group II rats. In case of Group VI, we found significantly increased hepatic LPO and decreased GSH levels as compared to Group II and Group V rats. Group VII showed a decrease of hepatic LPO and increase of GSH levels as compared to Group V. In Group VIII rats, we have found a significant decrease of hepatic LPO and increase of GSH levels when compared with Group VI rats. Hepatic SOD, GSH-Px and CAT activities significantly increased in Group VII rats as compared to Group V rats. In case of Group VIII we have noticed a significant increase of hepatic SOD, GSH-Px and CAT activities as compared to Group VI rats.
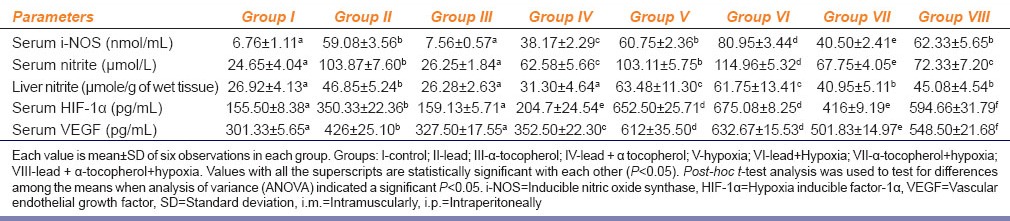
Table 4 depicts significant increase of serum i-NOS activities, serum and liver nitrite concentration (NO) in Group II and Group V rats as compared to Group I. Group IV rats showed a significant increase as compared to Group I, but when compared with Group II showed significant reduction of serum i-NOS activities, serum and liver nitrite concentration. Serum i-NOS concentration, serum and liver nitrite levels were found to be further increased significantly in Group VI as compared to Group V. Group VII rats significantly reduced serum i-NOS concentration, serum and liver nitrite levels as compared to Group V rats. Like Group IV it has also been found that serum i-NOS, serum and liver nitrite levels were significantly decreased in Group VII and Group VIII.
Table 4.
Effect of α-tocopherol (10 mg/100 g of body weight, i.m.) supplementation on lead acetate (25 mg/kg b. wt., i.p.) and chronic normobaric hypoxia (10% oxygen) induced alteration of serum i-NOS, serum nitrite, serum HIF-1α and serum VEGF in rats
Serum Hypoxia Inducible Factor-1α and Vascular Endothelial Growth Factor Concentrations
Table 4 shows elevated serum HIF-1α and VEGF concentrations in Group II rats as compared to Group I. Group IV showed a significant decreased of both serum HIF-1α and VEGF concentrations when compared with Group II rats. In Group V rats showed significant increase of both serum HIF-1α and VEGF concentrations as compared to both Group I control and Group II rats. Interestingly in case of Group VI rats did not show any significant difference in comparison to Group V rats although their values were significantly higher than Group II rats. A remarkable significant decrease of both serum HIF-1α and VEGF concentrations were noticed in case of Group VII rats when it compared with Group V rats. A significant reduction of both serum HIF-1α and VEGF concentrations were also noticed in case of Group VIII rats when it compared with either Group VI or Group V rats. But when Group VIII rats were compared with Group II both serum HIF-1α and VEGF concentrations were found to be still significantly higher. Table 4 depicts a significant decreased serum HIF-1α and VEGF concentrations in Group IV rats. Serum HIF-1α and VEGF concentrations in Group VII rats decreased as compared to Group V rats. Serum HIF-1α and VEGF concentrations in Group VIII rats reduced when it compared with Group VI rats.
Histopathology of the Hepatic Tissues
In Figure 1, Group I showed normal hepatic parenchymal tissue (shown), cords of hepatocytes (arrows) and blood containing sinusoid radiate from central vein to the peripheral portal triads. In Group II hepatic parenchymal tissue showed distorted lobular architecture (circle), Kupffer cell hyperplasia (arrows), dilatation and congestion of central vein. In Group III showed thickening of basement membrane (arrow) of the blood vessels and normal regenerating hepatocytes (circle). No obvious significant changes noticed. Group IV emphasized normal lobular architecture of hepatic tissue (shown) and hepatocytes (arrows). Group V showed the hepatocytes with swollen mild narrowing of the sinusoidal spaces (A, B) and foci of necrosis and inflammatory reaction (circle). Section study in Group VI showed distorted lobular architecture of hepatic parenchyma (circle), foci of fatty change (fine arrows) and ballooning degeneration and necrosis of hepatocytes (A) in zone 3 (centrilobular) areas, moderate proliferation of portal area with fibrous tissue with infiltration of mixed acute and chronic inflammatory cells (B); variable widening of sinusoidal spaces; Kupffer cell hyperplasia; dilatation and congestion of central vein (block arrow). Group VII showed normal architecture of hepatic parenchyma (circle), little swollen hepatocytes with granular cytoplasm (block arrow), mild narrowing sinusoidal spaces (fine arrows). Hepatic tissue section of Group VIII showed hepatic tissue altered lobular architecture (circle), little swollen hepatocytes with vacuolated cytoplasm (block arrow), ballooning degeneration (fine arrow) and mitotic figure (M).
Figure 1.

Hepatic sections of Group I to Group VIII rats: Group I: Hepatic tissue (shown) and hepatic cords (arrows) appeared normal, Group II: Distorted hepatic tissue architecture (circle) and Kupffer cell hyperplasia (arrows), Group III: Thick basement membrane (arrow) and normal regenerating hepatocytes (circle), Group IV: Normal hepatic tissue (shown) and hepatocytes (arrows). Group V: Hepatocytes with swollen mild narrowing sinusoidal spaces (A and B) and foci of necrosis with inflammatory reaction (circle), Group VI: Distorted hepatic parenchyma (circle), foci of fatty change (fine arrows), ballooning degeneration and necrosis of hepatocytes (a), chronic inflammatory cells (b), dilatation and congestion of central vein (block arrow), Group VII: Normal hepatic tissue (circle), little swollen hepatocytes with granular cytoplasm (block arrow), mild narrowing sinusoidal spaces (fine arrows), Group VIII: Hepatic tissue altered lobular architecture (circle), swollen hepatocytes with vacuolated cytoplasm (block arrow), ballooning degeneration (fine arrow), mitotic figure (M)
Discussion
Gravimetry
Our observation indicates that lead acetate has an adverse effect on total body weight gain of rats. It may be due to low food consumption, hormonal imbalance and reduction in protein levels. Lead induced growth retardation is already reported.[19] Lead (Pb) causes severe gastritis and malabsorption, which ultimately leads to less calorie consumption and depresses the body weight. Simultaneous treatment with α-tocopherol had cut down the percentage decrease in body weight.
Serum Lipid Profile
In this study, significant alteration observed in lipid profile, could be due to changes in the gene expression of hepatic enzymes like hydroxy-methylglut-aryl-CoA reductase (HMG-CoA reductase). This in turn depresses LDL-receptor gene expression. Defects in the LDL-receptor interfere with cholesterol uptake from the blood stream, which in turn causes excess cholesterol synthesis in the liver and high levels of serum total cholesterol and LDL-cholesterol.[20] A significant improvement of lipid profiles in lead acetate induced α-tocopherol supplemented rats in comparison to only lead acetate treated rats may be due to the presence of Vitamin E in all cellular membrane near cytochrome P450 which can sweeps the free radicals formed there. α-Tocopherol could counteract lead-induced changes in HMG-CoA reductase activities to some extent and thereby improve the serum lipid profile. Decreased level of serum LDL and VLDL after hypoxia exposure to rats in our study may be due to hypoxia-induced elevation of low density lipoprotein receptor-related protein 1 (LRP1) expression through HIF-1α and that LRP1 over expression mediates hypoxia-induced VLDL-CE uptake by the hepatic and other cells.[21]
Oxidant and Enzymatic Antioxidant Status
The present study reveals that treatment with lead acetate or exposed chronic sustained hypoxia increase lipid peroxidation by increasing MDA concentration in erythrocytes of rats. Increased erythrocyte MDA concentration of rats definitely accompanied by increased ROS formation. Decreased activities of hepatic SOD, CAT, and GSH-Px in lead acetate treated and/or hypoxic rats suggests an interaction between the accumulated free radicals and the active amino acids of these enzymes. During hepatotoxicity, these enzymes are structurally and functionally impaired by free radicals, resulting in liver damage.[22] Different mechanisms could be involved in Pb-induced oxidative damage. Lead (Pb) interacts with negatively charged phospholipids in membranes and through the induction of changes in membrane physical properties could facilitate the propagation of lipid oxidation.[23] Lead affects membrane-related processes such as the activity of membrane enzymes, endo-and exocytosis, transport of solutes across the bilayer, and signal transduction processes by causing lateral phase separation.[23] Secondary injury from lead or hypoxia exposure may be also due to activation of Kupffer cells (as supported by our histopathological studies) and a cascade of events involving several types of hepatic cells and a large number of inflammatory and cytotoxic mediators. It has been reported that α-tocopherol can be useful in preventing hepatocellular damage by inhibiting lipid peroxidation by free radicals generated by heavy metals.[24]α-Tocopherol acting in conjugation with GSH-Px could directly reduce phospholipids hydroperoxides within the membrane and lipoproteins to inhibit lipid peroxidation induced by either lead acetate treatment or chronic sustained hypoxia.
In our study, α-tocopherol found to be effective to combat i-NOS activities and reduced serum and liver nitrite concentration by reducing excessive NO production in lead acetate treated or hypoxia exposed or lead acetate treated hypoxic exposed rats. Lead acetate or chronic sustained hypoxia produce liver and endothelial cellular oxidative stress through an increased rate of hydroxyl radical generation, which may lead to lysosomal, mitochondrial, and microsomal damage, resulting in organelle dysfunction. In addition to direct cellular oxidant injury, ROS and reactive nitrogen species may constitute signals regulating (i) protein function through reversible oxidation and/or nitrosation of protein sulfhydryls or (ii) gene expression, in the hepatic sinusoid.[25] The mechanism by which antioxidant Vitamin E (α-tocopherol) works to counteract lead (Pb) or hypoxia-induced overproduction of NO by inducing i-NOS in endothelial or metabolically active tissues are shown in Figure 2. There is a relationship exists between NO production and regulation of VEGF gene expression. Our results from the present study on i-NOS activities in serum with serum and hepatic NO levels give indications of possibility of alteration of VEGF gene expression through HIF-1 transcription factors by lead acetate treatment alone or chronic hypoxia exposure alone or in combined exposure of both in male albino rats. Supplementation of α-tocopherol on modification of VEGF gene expression through i-NOS in either lead acetate induced or hypoxia exposed or both (lead acetated + hypoxia) treated rats may also be a possibility.
Figure 2.
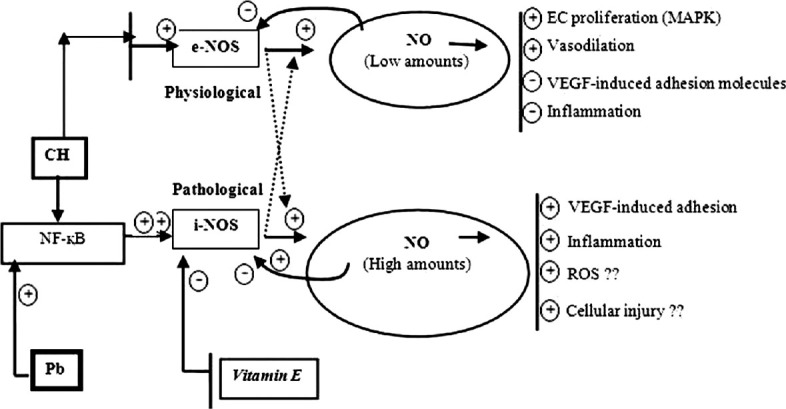
Regulation of nitric oxide by inducing various transcriptional factors and role of Vitamin E: Nitric oxide (NO) generation induced by either endothelial NO synthases (e-NOS) or inducible NOS (i-NOS) pathways. It also shows how excessive NO produce due to either Lead (Pb) or hypoxia exposure by stimulating i-NOS pathway. Hypoxia may induce either e-NOS or i-NOS activities. Lead (Pb) usually activates i-NOS via Nuclear factor kappa B (NF-κB) pathways. However, hypoxia if it takes NF-κB pathway it will induce more i-NOS activities than e-NOS. Vitamin E actually block i-NOS pathway
Serum Hypoxia Inducible Factor-1α and Vascular Endothelial Growth Factor Concentrations
Hypoxia inducible factor-1α transcription factor expressed in chronic sustained hypoxic condition to adapt in hypoxic conditions by increase expressing VEGF gene or i-NOS gene in metabolically active tissues. The results from the present study show both lead acetate and chronic sustained hypoxia stimulates the production of HIF-1α transcription factor and VEGF gene expression in hepatic tissue, which is reflected by increased serum HIF-1α and VEGF levels. VEGF expression has also been known to be up regulated in the presence of heavy metal ions. Divalent metals such as cobalt and nickel have also been shown to stabilize HIF proteins and promote transcription of HIF-1α-mediated genes.[26] VEGF over expression in our study due to lead exposure or chronic hypoxia exposure in rats is actually causes a protective measure against hypoxia and lead acetate induced cellular hypoxia. Role of α-tocopherol supplementation are found to be interesting to counteract excessive HIF-1α transcription factor expression, followed by VEGF gene expression. Their roles are mainly decrease ROS production and improve intracellular hypoxic status by stimulating heme biosynthesis and reduction of nitrite levels.
Histopathology of the Hepatic Tissues
Histological examination to evaluate the impact of lead acetate and hypoxia on hepatic tissues showed notable changes. Hepatic tissue hypoxia showed two types of cell death-necrosis or apoptosis, where the cells swell, plasma and nuclear membranes disrupt cellular lysis occurred, and there is an associated acute inflammatory response that in it may exacerbate the initial hypoxic injury response.
Conclusion
Both lead and hypoxia stimulate VEGF pathways for cellular adaptability. Excessive nitrite generates due to hyper activities of i-NOS or through HIF-1α either by lead acetate or hypoxia exposure, or simultaneous exposure of both heavy metal (Pb) and chronic hypoxia causes cytotoxicities by alteration of cell metabolism. The supplementation of α-tocopherol was found beneficial to counteract both lead acetate and hypoxia-induced cytotoxicities by the generation of oxidative and nitrosative stress.
Footnotes
Source of Support: Defense Institute of Physiology and Allied Sciences, Delhi, DRDO, Ministry of Defense, Government of India.
Conflict of Interest: No.
References
- 1.Abadin H, Ashizawa A, Stevens YW, Llados F, Diamond G, Sage G, et al., editors. Toxicological Profile for Lead. Atlanta, GA: US Government Printing; 2007. Agency for Toxic Substances and Disease Registry (ATSDR). Toxicological profiles; pp. 301–81. [PubMed] [Google Scholar]
- 2.Gautam P, Flora SJ. Oral supplementation of gossypin during lead exposure protects alteration in heme synthesis pathway and brain oxidative stress in rats. Nutrition. 2010;26:563–70. doi: 10.1016/j.nut.2009.06.008. [DOI] [PubMed] [Google Scholar]
- 3.Greer SN, Metcalf JL, Wang Y, Ohh M. The updated biology of hypoxia-inducible factor. EMBO J. 2012;31:2448–60. doi: 10.1038/emboj.2012.125. [DOI] [PMC free article] [PubMed] [Google Scholar]
- 4.Chervona Y, Costa M. The control of histone methylation and gene expression by oxidative stress, hypoxia, and metals. Free Radic Biol Med. 2012;53:1041–7. doi: 10.1016/j.freeradbiomed.2012.07.020. [DOI] [PMC free article] [PubMed] [Google Scholar]
- 5.Novotny JA, Fadel JG, Holstege DM, Furr HC, Clifford AJ. This kinetic, bioavailability, and metabolism study of RRR-a-tocopherol in healthy adults suggests lower intake requirements than previous estimates. J Nutr. 2012;142:2105–11. doi: 10.3945/jn.112.166462. [DOI] [PMC free article] [PubMed] [Google Scholar]
- 6.Arif M, Kabir Y, Hassan F, Waise TM, Mazumder ME, Rahman S. Increased DNA damage in blood cells of rat treated with lead as assessed by comet assay. Bangladesh J Pharmacol. 2008;3:97–101. [Google Scholar]
- 7.Canoru N, Üek R, Atamer A, Dursun M, Turgut C, Gnelü E, et al. Protective effects of vitamin E, selenium and allopurinol against stress-induced ulcer formation in rats. Turk J Med Sci. 2001;31:199–203. [Google Scholar]
- 8.Burtis CA, Ashwood E. Text Book of Clinical Chemistry. 3rd ed. Philadelphia, Pennsylvania, USA: WB Saunders Co; 1999. pp. 840–1. [Google Scholar]
- 9.Okhawa H, Ohishi N, Yagi K. Reaction of linoleic acid hydroperoxide with thiobarbituric acids. Anal Biochem. 1979;95:351–4. [PubMed] [Google Scholar]
- 10.Beutler E, Duron O, Kelly BM. Improved method for the determination of blood glutathione. J Lab Clin Med. 1963;61:882–8. [PubMed] [Google Scholar]
- 11.Misra HP, Fridovich I. The role of superoxide anion in the autoxidation of epinephrine and a simple assay for superoxide dismutase. J Biol Chem. 1972;247:3170–5. [PubMed] [Google Scholar]
- 12.Aebi H. Catalase. In: Bergmeyer HU, editor. Methods of Enzymatic Analysis. 3rd ed. Weinheim: Verlag Chemie; 1983. pp. 273–86. [Google Scholar]
- 13.Flohé L, Günzler WA. Assays of glutathione peroxidase. Methods Enzymol. 1984;105:114–21. doi: 10.1016/s0076-6879(84)05015-1. [DOI] [PubMed] [Google Scholar]
- 14.Moron MS, Depierre JW, Mannervik B. Levels of glutathione, glutathione reductase and glutathione S-transferase activities in rat lung and liver. Biochim Biophys Acta. 1979;582:67–78. doi: 10.1016/0304-4165(79)90289-7. [DOI] [PubMed] [Google Scholar]
- 15.Moncada S. Nitric oxide: Discovery and impact on clinical medicine. J R Soc Med. 1999;92:164–9. doi: 10.1177/014107689909200402. [DOI] [PMC free article] [PubMed] [Google Scholar]
- 16.Moshage H, Kok B, Huizenga JR, Jansen PL. Nitrite and nitrate determinations in plasma: A critical evaluation. Clin Chem. 1995;41:892–6. [PubMed] [Google Scholar]
- 17.Gyöngyösi M, Hemetsberger R, Posa A, Charwat S, Pavo N, Petnehazy O, et al. Hypoxia-inducible factor 1-alpha release after intracoronary versus intramyocardial stem cell therapy in myocardial infarction. J Cardiovasc Transl Res. 2010;3:114–21. doi: 10.1007/s12265-009-9154-1. [DOI] [PubMed] [Google Scholar]
- 18.Culling CF, Ellison RT, Barr WT. 4th ed. London: Butterworth and Co; 1985. Cellular Pathology Techniques; pp. 600–50. [Google Scholar]
- 19.Allouche L, Hamadouche M, Touabti A. Effect of long-term exposure to low or moderate lead concentrations on growth, lipid profile and liver function in albino rats. Adv Biol Res. 2011;5:339–47. [Google Scholar]
- 20.Liu CM, Ma JQ, Sun YZ. Protective role of puerarin on lead-induced alterations of the hepatic glutathione antioxidant system and hyperlipidemia in rats. Food Chem Toxicol. 2011;49:3119–27. doi: 10.1016/j.fct.2011.09.007. [DOI] [PubMed] [Google Scholar]
- 21.Bruder ED, Raff H. Cardiac and plasma lipid profiles in response to acute hypoxia in neonatal and young adult rats. Lipids Health Dis. 2010;9:3. doi: 10.1186/1476-511X-9-3. [DOI] [PMC free article] [PubMed] [Google Scholar]
- 22.Das KK, Das SN, Dhundasi SA. Nickel, its adverse health effects and oxidative stress. Indian J Med Res. 2008;128:412–25. [PubMed] [Google Scholar]
- 23.Khalaf AA, Moselhy WA, Abdel-Hamed MI. The protective effect of green tea extract on lead induced oxidative and DNA damage on rat brain. Neurotoxicology. 2012;33:280–9. doi: 10.1016/j.neuro.2012.02.003. [DOI] [PubMed] [Google Scholar]
- 24.Gupta AD, Dhundasi SA, Dhara PC, Das KK. Influence of α-tocopherol on nickel induced alteration of serum lipid profile in male albino rats. Asian Pac J Trop Med. 2008;1:14–8. [Google Scholar]
- 25.Baeuerle PA, Baltimore D. NF-kappa B: Ten years after. Cell. 1996;87:13–20. doi: 10.1016/s0092-8674(00)81318-5. [DOI] [PubMed] [Google Scholar]
- 26.Wang D, Wang LH, Zhao Y, Lu YP, Zhu L. Hypoxia regulates the ferrous iron uptake and reactive oxygen species level via divalent metal transporter 1 (DMT1) Exon1B by hypoxia-inducible factor-1. IUBMB Life. 2010;62:629–36. doi: 10.1002/iub.363. [DOI] [PubMed] [Google Scholar]