

Abstract
Multiple myeloma is a malignant disorder characterized by bone marrow proliferation of plasma cells and by overproduction of monoclonal immunoglobulin detectable in the sera (M-spike). Anemia is a common complication of multiple myeloma, but the underlying pathophysiological mechanisms have not been completely elucidated. We aimed to identify the different determinants of anemia using the Vk*MYC mouse, which spontaneously develops an indolent bone marrow localized disease with aging. Affected Vk*MYC mice develop a mild normochromic normocytic anemia. We excluded the possibility that anemia results from defective erythropoietin production, inflammation or increased hepcidin expression. Mature erythroid precursors are reduced in Vk*MYC bone marrow compared with wild-type. Malignant plasma cells express the apoptogenic receptor Fas ligand and, accordingly, active caspase 8 is detected in maturing erythroblasts. Systemic iron homeostasis is not compromised in Vk*MYC animals, but high expression of the iron importer CD71 by bone marrow plasma cells and iron accumulation in bone marrow macrophages suggest that iron competition takes place in the local multiple myeloma microenvironment, which might contribute to anemia. In conclusion, the mild anemia of the Vk*MYC model is mainly related to the local effect of the bone marrow malignant clone in the absence of an overt inflammatory status. We suggest that this reproduces the initial events triggering anemia in patients.
Introduction
Multiple myeloma (MM) is a malignant disorder characterized by clonal proliferation of plasma cells (PC) in the bone marrow (BM) and overproduction of monoclonal immunoglobulin.1 MM patients develop end-organ damage with bone lesions, hypercalcemia, renal insufficiency and anemia. Anemia, usually normochromic-normocytic, affects more than 70% of patients at diagnosis2 and virtually all patients during disease progression, contributing to a severe impairment of their quality of life.3,4 Anemia is multifactorial and the underlying pathophysiological mechanisms have not been completely elucidated. It is widely accepted that hematopoietic suppression does not occur merely through physical replacement of erythroid precursors by MM cells, since anemia is present also when BM malignant cell infiltration is low.5
Previous studies suggested a direct cytotoxic effect of malignant PC on erythropoiesis6,7 by showing an abnormal upregulation of the apoptogenic receptors Fas ligand (L) and tumor necrosis factor-related apoptosis-inducing ligand (TRAIL) in PC of MM patients, an event responsible for inducing apoptosis of erythroid precursors.
Other patient studies strengthened the importance of iron-restricted erythropoiesis and anemia of chronic diseases triggered by MM-associated inflammation.8,9 Most iron used to sustain erythropoiesis is released by macrophages that recycle into the bloodstream iron derived from senescent erythrocytes, essentially through the iron exporter ferroportin.10 The inflammatory cytokines released in MM may modulate the transcription/translation of several iron genes to sequester iron from the circulation into stores. They also promote the production of the liver hormone hepcidin, which targets and degrades ferroportin, favoring iron retention within macrophages and leading to iron-restricted anemia.11 High hepcidin levels stimulated by increased IL-6 and BMP2-like activity have been reported in MM patients.12 Importantly, BM mammalian monocytes and macrophages might produce small amounts of hepcidin when stimulated by LPS or inflammatory cytokines to further sequester iron by an autocrine mechanism at local level.13
Recent data have pointed to a reduction of BM megakaryocyte-erythrocyte precursors in MM patients and more generally to a functional impairment of migratory, adhesive and proliferative capacities of hematopoietic stem and progenitor cells, caused by TGF-beta and NFkB signaling alterations.14 These results strengthen the relevance of the perturbation of BM microenvironment induced by MM PC and mesenchymal stromal cells.
To identify the different components involved in the development and progression of anemia in MM, and to investigate the potential role of iron homeostasis, we used the genetically engineered Vk*MYC mouse. This model spontaneously develops a myeloma-like disease with slow BM accumulation of monoclonal PC and other disease manifestations, including anemia.15 In this pre-clinical model, we measured the hematologic parameters and analyzed the iron distribution and hepcidin expression during the natural history of the disease. We also analyzed the different cell types and their iron phenotype in the BM and spleen.
In the Vk*MYC model anemia is mild, partly due to apoptosis of late erythroblasts, possibly induced by malignant PC. Our results exclude a role for systemic inflammation and hepcidin increase, and suggest that a local microenvironmental iron competition restricts iron availability for erythropoiesis, while diverting iron to PC and macrophages. This murine model might help to identify early components of anemia of the human disorder.
Methods
Animals and tissue collection
Vk*MYC mice were maintained in C57BL/6 background and housed together with wild-type littermates in the animal facility of the IRCCS Ospedale San Raffaele, Italy, in accordance with the European Union guidelines and fed a conventional diet (carbonile iron 230 mg/kg). The study was approved by the institutional animal care and use committee of IRCCS Ospedale San Raffaele. The disease (incidence and percentage of monoclonal component and hematologic parameters) was evaluated in the following groups of mice. At 20 and 35 weeks we analyzed 36 Vk*MYC (23 males and 13 females) and 25 wild-type (10 males and 15 females); at 50 weeks, 42 Vk*MYC (25 males and 17 females) and 38 wild-type (20 males and 18 females); at 80 weeks, 29 Vk*MYC (13 males and 16 females) and 20 wild-type (10 males and 10 females). For all the other analyses, the number of animals for each group is indicated by the symbols in the figures or described in the figure legends. Blood was collected by caudal puncture from anesthetized mice for hematologic analyses, serum erythropoietin quantification and serum protein electrophoresis. After sacrifice, femoral BM cells were collected and processed immediately. Liver and spleen were weighed, dissected and snap-frozen immediately in RNALater (Qiagen) for RNA analysis or dried for tissue iron quantification or processed immediately for cell isolation.
Bone marrow histopathological analysis
Mouse femur of Vk*MYC and wild-type mice was formalin-fixed, decalcified in a EDTA-based solution and paraffin-embedded. From tissue block, 3–4 thick μm sections were obtained and stained with Hematoxylin & Eosin for morphological analysis and with Perl’s stain for assessing iron quantification and distribution.
Morphological examination was used to assess the presence of BM MM plasma cells and Perl’s stain to identify which type of cell(s) was responsible for BM iron storage.
Hematologic and blood tests
Hemoglobin (Hb) concentration, red (RBC), white (WBC) blood cells, platelet counts and erythrocyte indexes [(mean corpuscular volume (MCV) and mean corpuscular hemoglobin (MCH)] were measured on the Sysmex KX-21 automated blood cell analyzer (Sysmex America).
Serum protein electrophoresis (SPE) was performerd on the Hydrasys instrument (Sebia). According to the manufacturer’s instructions, 10 μL of undiluted serum were manually applied to the Hydragel agarose gels (Sebia). Electrophoresis, drying, amidoblack staining, destaining and final drying were carried out automatically. Gels were scanned with Hydrays 2 Scan densitometer and scanning resulting profiles were analyzed by Phoresis software (Sebia) to provide relative concentrations of individual protein zones.
Cell preparations and flow cytometry
Cell suspensions from femoral BM and spleen were filtered through a 70-μm cell strainer and centrifuged at 350 g for 10 min. Cell pellets were suspended in PBS containing 0.1% BSA. Cell suspensions were analyzed by flow cytometry using the staining panels described in the Online Supplementary Appendix and the following antibodies and reagents: anti-CD11b (clone M1/70), anti-B220 (clone RA3-6B2), anti-TER-119 (clone TER-119), anti CD44 (clone IM7), anti-CD71 (clone C2), anti-CD138 (clone 281-2) (all antibodies from BD Biosciences); FITC-conjugated IETD-FMK reagent (eBioscience); anti-Fas-L (clone MFL3; eBioscience); rabbit anti-ferroportin (Alpha Diagnostic) followed by secondary staining with polyclonal goat anti-rabbit (BD Biosciences); biotin-conjugated anti-F4/80 (clone BM8; eBioscience) followed by secondary staining with streptavidin (BD Bioscience). After washing, cells were analyzed on Navios Flow Cytometer (Beckman Coulter). Analyses were performed with the FCS Express software (DeNovo Software). Representative dot plots are normalized on equal number of total events between Vk*MYC and wild-type littermates. Flow cytometry histograms are normalized on equal number of events occurred in the gates of interest.
CD11b+ cells were isolated from BM-cell suspensions using MACS CD11b MicroBeads (Miltenyi Biotec) and residual BM cells were recovered from the flow-through. Purity was assayed by flow cytometry. Cells were immediately frozen and then processed for RNA extraction and gene expression assays.
Statistical analysis
The unpaired two-tailed Student t-test was used to analyze significant changes in the described parameters (GraphPad Prism v.5.0a). P<0.05 was considered statistically significant.
Results
The Vk*MYC mouse model is mildly anemic
To monitor the disease progression we determined the M-spike incidence and size by SPE in cohorts of Vk*MYC mice aged 20, 35, 50 and 80 weeks. Both the percentage of spike-positive mice and the size of the monoclonal component progressed overtime. At 50 weeks, about 75% of Vk*MYC mice were affected (Mean M-spike 7% of serum proteins); at 80 weeks the incidence of affected mice reached 90% and the level of M-spike was 12% of serum proteins (Figure 1A and B). As expected, in the cohort of wild-type mice, only a few developed a monoclonal gammopathy of undetermined significance (MGUS) with aging (Figure 1A and B). Histological examination of Vk*MYC affected mice performed at sacrifice revealed disease infiltration in the BM (approx. 30% at 80 weeks) (Online Supplementary Figure S1A) and no evidence of disease in spleen, liver and kidney (data not shown). Flow cytometry analysis showed BM PC (CD138+ B220−) expansion in Vk*MYC affected mice while CD138− B220+ cells were unmodified. PC expansion was not detected in the spleen (Online Supplementary Figure S1B).
Figure 1.
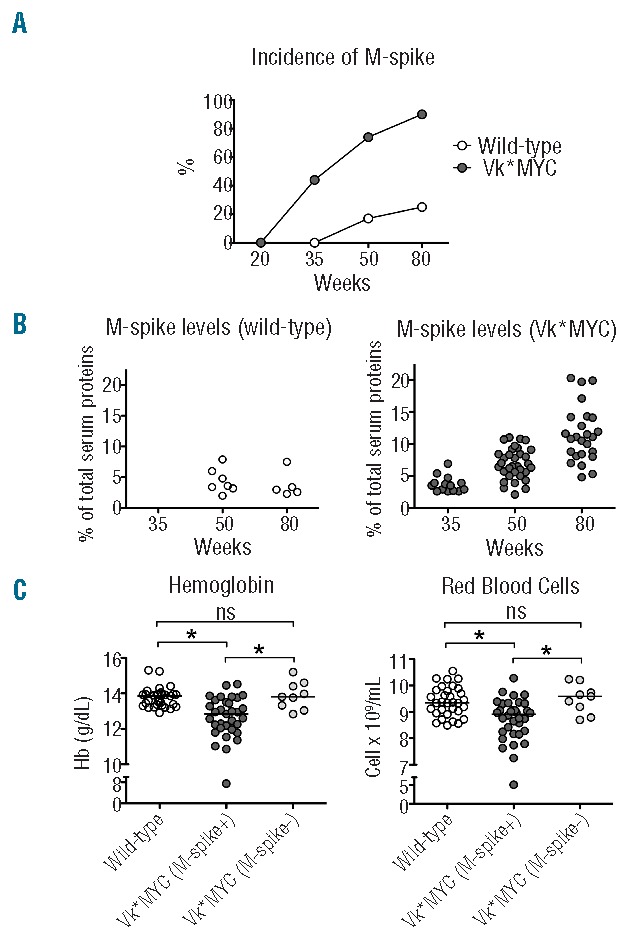
The Vk*MYC disease model. Analysis of serum monoclonal gammopathy in samples from 20-, 35-, 50- and 80-week old Vk*MYC mice and wild-type littermates. (A) Incidence of monoclonal component (M-spike). (B) Percentage of M-spike on total serum proteins in affected Vk*MYC and wild-type mice. (C) Hemoglobin (Hb) and red blood cells (RBC) count in 50-week old Vk*MYC affected mice, wild-type and non-affected Vk*MYC littermates. All the analyses were performed in both sexes. The number of mice for each group was described in the Methods section. *P<0.05. ns: not statistically significant.
At 50 weeks of age, both male and female Vk*MYC affected mice showed a statistically significant reduction of Hb and RBC count as compared to both wild-type and non-affected Vk*MYC littermates, indicating that anemia was related to the disease development (Figure 1C). We also analyzed gender specific hematologic parameters of Vk*MYC affected mice and concurrently the progression of anemia with aging. Anemia of Vk*MYC mice, with the exception of a few cases, was mild and did not significantly worsen with age or disease progression. Anemia was not characterized by variations, MCV or MCH (data not shown). At 80 weeks, the difference in Hb values and RBC count between Vk*MYC mice and wild-type males was maintained but that of females was reduced, likely because also some wild-type animals developed severe anemia with aging (Online Supplementary Figure S1A and B). However, and importantly, anemia of wild-type mice was unrelated to the presence of a monoclonal component (data not shown). WBC and platelets counts were not substantially affected (Online Supplementary Figure S1C and D). Since anemia was better appreciated in males, irrespective of age, we focused our next studies on males, comparing Vk*MYC affected mice with wild-type littermates.
Anemia of Vk*MYC is not triggered by inflammation
To test whether anemia of Vk*MYC mice was promoted by inflammation we measured the liver expression of the major acute phase Serum Amyloid A1 (SaA1) and C-reactive (CRP) proteins in 50– and 80– week old mice. The expression levels of both proteins in Vk*MYC were similar to wild-type mice (Online Supplementary Figure S3), with the exception of a few mildly anemic Vk*MYC cases that showed increased SaA1, without concurrent CRP induction. Since hepcidin, the major determinant of body iron distribution, may be increased by inflammatory cytokines, we measured liver hepcidin expression. Both wild-type and Vk*MYC mice showed a wide range of hepcidin levels, without a statistically significant difference (Figure 2A). Hepcidin levels were unrelated to Hb levels, SaA1 expression and M-spike (data not shown). There was no difference in any of the iron parameters, such as spleen (SIC) and liver iron content (LIC) and serum transferrin saturation between wild-type and Vk*MYC mice (Figure 2B–D). Interestingly, both in wild-type and Vk*MYC there was a trend towards increase of hepcidin expression at 50 weeks (data not shown) and a clear direct correlation with LIC (Figure 2E and F) at 80 weeks, suggesting that body iron concentration rather than inflammation was the major determinant of hepcidin expression. Taken together these data exclude a role of inflammation and liver hepcidin in the pathogenesis of anemia in the Vk*MYC model of MM.
Figure 2.
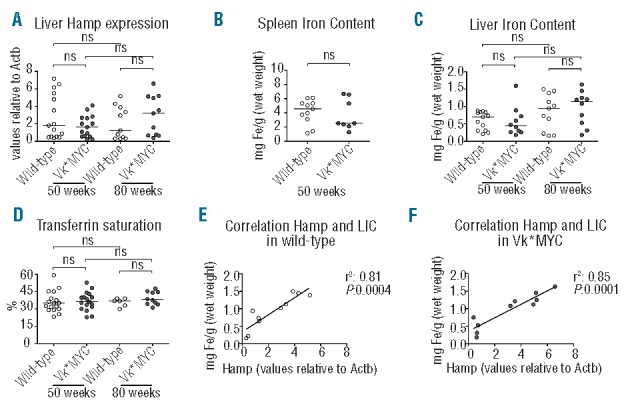
Body iron distribution. (A) Hepcidin (Hamp) expression measured by qRT-PCR. (B) Spleen and (C) Liver Iron Content (LIC). (D) Serum transferrin saturation. (E) Correlation between liver Hamp expression and LIC in 80-week old wild-type mice. (F) Correlation between liver Hamp expression and LIC in 80-week old Vk*MYC mice. All the analyses were performed on male Vk*MYC affected mice and wild-type littermates. The number of mice of each group is indicated by the symbols in the figures. ns: not statistically significant.
Anemia of Vk*MYC is not due to insufficient erythropoietin production
We then tested whether anemia of Vk*MYC mice was promoted by defective serum erythropoietin concentrations. We did not find any significant differences of erythropoietin levels even at 80 weeks, when the disease in Vk*MYC was most expanded and the RBC count most reduced (Online Supplementary Figure S4). In addition, serum erythropoietin in 2 80-week old terminally sick Vk*MYC mice with extremely severe anemia (mean Hb: 4.74 g/dL; RBC count: 1.97 cells × 106/mL) (that for this reason were excluded from the analysis) showed an exponential increase of serum erythropoietin concentration (mean 4297 pg/mL). These results exclude erythropoietin deficiency as a cause of anemia of Vk*MYC mice.
Bone marrow erythroid precursors are reduced in the Vk*MYC mice
We then analyzed the differentiation of the erythroid precursors in BM of Vk*MYC mice compared with wild-type littermates. To distinguish maturing erythroblasts, we considered Side Scatter (SSC)low CD11b− B220− TER119+ cells (Figure 3A, gates 1 and 2), plotting CD44 expression versus Forward Scatter (FSC) value, an approach widely used to define maturing erythroblast populations.16 We identified five density clusters corresponding to erythroblasts populations in progressive maturation stages (I–V) (Figure 3A). Cells in stages I–IV showed high CD71 expression while in stage V approximarely 15% of cells were CD71 positive and 85% CD71 negative (Online Supplementary Figure S5). We observed a significant reduction of the final step of erythroblast maturation (stage V) in the BM of Vk*MYC compared to wild-type (Figure 3B) with a reduction of both CD71+ and CD71− cell sub-populations (Online Supplementary Figure S5).
Figure 3.
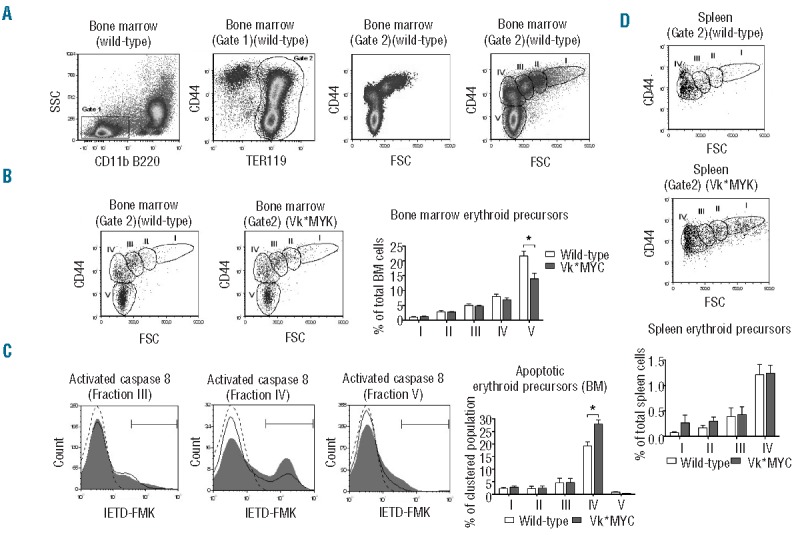
Flow cytometry analysis of erythropoiesis. (A) Identification of clusters of erythroid precursors at different maturation stages. Left panels: recognition of bone marrow (BM) TER119+ cells (Erythroid precursors, gate 2) inside the Side Scatter (SSC)low CD11b− B220− cells. Right panels: density plot of CD44 versus Forward Scatter (FSC) of BM erythroid precursors (Gate 2) showing naturally occurring clusters (fractions I–V). (B) Representative plots of BM erythroid precursors of Vk*MYC and wild-type littermates with the gates on erythroid fractions I–V. Right histogram: quantification of BM erythroid fractions I–V with respect of total BM cells. (C) Representative caspase 8 activation assay by IETD-FMK stain in erythroblast fraction III–V of wild-type (black line) and Vk*MYC mice (gray filled curve) with gates on IETD-FMK+ cells. Dotted line: negative control (Vk*MYC samples lacking IETD-FMK stain). Right histogram: quantification of the percentage of erythroid cells showing caspase 8 activation with respect of total erythroid cells of each fraction. (D) Representative plots of spleen erythroid precursors of Vk*MYC and wild-type littermates with the gates on erythroid fractions I–IV. Bottom histogram: quantification of spleen erythroid fractions I–IV with respect of total spleen cells. Quantifications were performed on 50-week old male mice on samples from 4 Vk*MYC affected mice compared with 4 wild-type littermates. Error bars indicate standard error. * P<0.05.
To address the cause of erythroid precursor reduction in Vk*MYC mice, we evaluated the activation of caspase 8 as an index of induced apoptosis. Caspase 8 was mainly activated in cells of stage IV both in Vk*MYC and wild-type erythroid precursors (Figure 3C). The amount of caspase 8 positive cells in stage IV was increased in Vk*MYC with respect to wild-type, indicating that a larger number of erythroblasts underwent apoptosis and did not progress to maturation into stage V (Figure 3C).
Spleen erythroid precursors are increased in the Vk*MYC mice
In the same cohorts of animals, we observed a trend towards increase of stages I–II immature erythroblasts in the spleen of Vk*MYC mice (Figure 3D). To better characterize the contribution of splenic erythropoiesis during the development of the disease, we examined a larger group of mice both at 50 and 80 weeks. We quantified the total Ter119+ CD71+ cells as an index of maturing erythroblasts. Vk*MYC mice showed increase of splenic erythroid precursors which progressed over time in 50- and 80-week old mice in parallel with the reduction of BM erythroid precursors. (Online Supplementary Figure S6), likely as an attempt to compensate anemia, that indeed showed no or little progression.
Malignant plasma cells and macrophages are predisposed to iron sequestration in Vk*MYC bone marrow
Since macrophages have been shown to express hepcidin upon inflammatory stimuli, we evaluated cytokines and hepcidin gene expression by qRT-PCR in BM isolated CD11b+ cells and in the corresponding negative cell fraction. We registered a mild, not significant increase, of IL-6 and TGF-β expression in both CD11b+ and residual cells isolated from Vk*MYC compared with those isolated from wild-type littermates (data not shown). However, we did not observe detectable hepcidin expression in any cell preparation.
To address the iron handling properties of non-erythroid cells within the BM microenvironment, we measured the expression of the iron importer CD71 and the iron exporter ferroportin in different cell populations (Figure 4A and B). The F4/80− CD11b+ cells did not express detectable CD71 or ferroportin both in wild-type and Vk*MYC, proving to be irrelevant in local iron handling (data not shown). CD138− B220+ cells showed a similar phenotype in wild-type mice, while the same population showed a mild expression of both CD71 and ferroportin in Vk*MYC (data not shown). As expected, F4/80+ macrophages, cells professional in iron recycling, were positive for both CD71 and ferroportin in wild-type. In Vk*MYC, CD71 expression was increased compared to wild-type (Figure 4C, left panel), while ferroportin was unchanged (Figure 4D, left panel). The normal CD138+ B220− PC of controls mildly expressed CD71 that, on the contrary, was highly expressed by malignant PC (Figure 4C, central panel). Interestingly the intensity of ferroportin expression in both normal and Vk*MYC PC was high and similar to that of F4/80+ macrophages (Figure 4D, right panel). Perl’s reaction showed a much more abundant iron in marrows of residual hematopoietic areas in Vk*MYC in comparison with age-matched wild-type animals. The iron was almost completely contained within the cytoplasm of macrophages, displaying a granular reactivity (Figure 4E). Thus, the increased iron sequestration by macrophages at BM local level might contribute to impairment of erythroid maturation.
Figure 4.

Flow cytometry analysis of iron transporters in non-erythroid cells. (A) Representative plots of CD138 versus B220 with the gating on CD138+ B220− cells. (B) Representative plots of F4/80 versus CD11b with the gating on F4/80+ and on F4/80− CD11b+ cells. (C) Left and central panels: representative CD71 expression in F4/80+ and CD138+ B220− cells. Right panel: quantification of CD71 expression. (D) Representative ferroportin expression in F4/80+ and CD138+ B220− cells. Black line: wild-type. Gray filled curve: Vk*MYC. Dotted line: negative control (representative samples lacking CD71 or ferroportin stain). (E) Representative Perl’s staining shows evident iron accumulation in the residual hematopoietic marrow of Vk*MYC affected mice in comparison with age-matched wild-type animals. Higher magnification reveals that most iron is contained in macrophage cytoplasm. All the analyses were performed on 50-week old male mice on samples from 4 Vk*MYC affected mice compared with 4 wild-type littermates. Error bars indicate standard error. *P<0.05.
Apoptogenic receptors are highly expressed in Vk*MYC bone marrow
To further address the mechanisms of increased apoptosis rate of Vk*MYC erythroblasts, we initially analyzed gene expression of apoptogenic receptors by qRT-PCR in isolated BM cells. The residual fraction after CD11b separation was characterized by increased expression of Syndecan 1 (CD138) in Vk*MYC and thus included PC. The apoptogenic receptors Fas-L and TRAIL expression was low or even undetectable in CD11b+ fractions, while it was detectable in the CD138+ fraction of both wild-type and Vk*MYC. Interestingly, both Fas-L and TRAIL expression was strongly increased in the CD138+ fraction of Vk*MYC compared with wild-type (Figure 5A).
Figure 5.
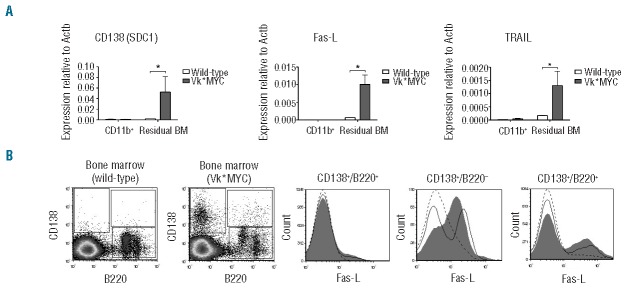
Bone marrow (BM) markers of inflammation and apoptosis. (A) Gene expression analysis by qRT-PCR in CD11b+ cells separated from BM and in residual cell fraction. (B) Left panels: representative density plots of CD138 versus B220 with the gating on CD138+ B220−, on CD138+ B220+ and on CD138− B220+. Right panels: representative Fas-L expression in cell populations gated in A. Black line: wild-type. Gray filled curve: Vk*MYC. Dotted line: negative control (Vk*MYC samples lacking Fas-L stain). All the analyses were performed on 50-week-old male mice on samples from 4 Vk*MYC affected mice compared with 4 wild-type littermates. Error bars indicate standard error. *P<0.05.
To better identify cells with increased expression of apoptogenic receptors in Vk*MYC, we analyzed Fas-L expression by flow cytometry in B cells. CD138− B220+ cells were negative for Fas-L expression both in wild-type and Vk*MYC. Approximately 40% of the CD138+ B220− cells were positive in controls, while in Vk*MYC almost all PC were positive (Figure 5B). Approximately 20% of CD138+ B220+ cells were positive in wild-type and this percentage was slightly increased in Vk*MYC (Figure 5B).
Discussion
The progressive accumulation of PC in the BM of MM leads to several complications including anemia. However, the events and mechanisms that trigger anemia are poorly understood. Anemia of MM has been considered as “anemia of chronic disease”, characterized by a cytokine-mediated inhibitory effect on erythropoiesis and erythropoietin production, macrophage iron sequestration and iron-restricted erythropoiesis induced by increased hepcidin levels.17 Other studies have shown a direct cytotoxic effect of PC on erythroid precursors6,7 or more recently a BM microenvironment perturbation likely caused by TGF-β and NFkB signaling alterations.14 The simultaneous presence of multiple causes associated with both the disease progression and treatment makes it cumbersome to dissect and identify the different components that lead to anemia in MM patients.
In an attempt to identify the initial events triggering anemia, we used the Vk*MYC mouse model, which recapitulates the most relevant features of the human disease. Indeed, the Vk*MYC develops an indolent BM-localized MM due to Myc overexpression in post germinal center B cells.15 In agreement with the validity of the model, it has been recently reported that rearrangements of the MYC locus are present in half of newly diagnosed MM patients.18
As previously reported,15,19 we observed that the incidence and the amount of monoclonal component in Vk*MYC mice progress slowly with aging, PC expansion remaining essentially confined to BM. Mild reduction of Hb levels starts at 50 weeks of age and, as observed in patients at diagnosis, anemia is normochromic/normocytic. Anemia is clearly a consequence of the disease, since it was not present in Vk*MYC animals that did not develop monoclonal component and the disease.
As a first step, we excluded increased hepcidin (typical of anemia of chronic diseases20) as a cause of anemia in Vk*MYC model. Actually, liver hepcidin was not significantly increased even in the few Vk*MYC animals presenting severe anemia. In addition, hepcidin expression was driven by liver iron content rather than by inflammation in both wild-type and Vk*MYC mice. In addition, the levels of transferrin saturation, the index of iron availability usually decreased in inflammation, were normal and homogeneous among all mice. However, lack of hepcidin increase in the presence of high SaA1 expression might be an event specific to murine models of cancer, as recently demonstrated in mice affected by severe inflammation induced by cancer cells.21 Another feature of anemia of chronic diseases is low/inappropriate erythropoietin expression,17 but we excluded a contribution of impaired erythropoietin production to the pathogenesis of anemia in the Vk*MYC model. Taken together, our results exclude alteration of systemic iron homeostasis as a triggering initial event of anemia. However, in human disease, inflammation and iron-restricted erythropoiesis may clearly contribute to anemia during the disease progression, since high IL-6, BMP2 and enhanced hepcidin concentrations have been reported in patients.8,12
The mild anemia of Vk*MYC mice is clearly related to a reduction in BM erythroid precursors. We excluded ineffective erythropoiesis since we did not identify the expansion of immature erythroid precursors as typically described in β-thalassemia.22 Reduction of erythropoiesis in MM is promoted by increased apoptosis of terminal maturation stages. The activation of death receptor apoptosis pathway mediated by caspase 8 occurs after receptor-ligand interaction, like Fas/Fas-L, on cell surfaces.23 We measured increased TRAIL and Fas-L expression in Vk*MYC BM and showed that the neoplastic PC clone has higher Fas-L expression than normal PC. Our results, in keeping with those reported in patients after analyzing Fas-L expression in PC,6 underline the relevance of malignant PC in inducing apoptosis. They also suggest that BM response to PC proliferation is similar in human and mice.
Though systemic iron homeostasis is not compromised in anemic Vk*MYC mice, we found a subtle perturbation of BM local iron metabolism. In the absence of systemic and local hepcidin alterations, Vk*MYC macrophages express ferroportin similarly to wild-type macrophages. However, they show higher levels of CD71, likely driven by the mild local inflammation.11 In this way, macrophages may subtract iron from erythroid cells. Perl’s stain con firms a strong iron accumulation in BM macrophages, suggesting that these cells are able to retain iron, presumably into ferritin. Iron competition could limit iron supply to erythropoiesis and favor displacement of erythropoiesis to the spleen.
The PC iron homeostasis has never previously been explored. As expected for non-proliferating cell, normal PC mildly express CD71, that on the contrary is highly expressed by neoplastic PC. This is not unexpected since MYC overexpression may favor iron regulatory protein activity and transferrin receptor 1 (CD71) RNA stabilization concurrently blocking ferritin translation.24 Considering the increased number of PC in MM, we speculate that they contribute to subtract iron from erythropoiesis. Paradoxically, both normal and malignant PC express ferroportin at high levels similar to those of iron recycling macrophages. Maintenance of ferroportin expression in malignant PC suggests the need to balance iron uptake for growth with iron export to limit the redox iron toxicity in cells susceptible to oxidative stress.
In conclusion, we have shown that anemia in the Vk*MYC mice appears to develop as a BM adaptation to the growth of the malignant clone and that these mice are a suitable model to explore the initial events triggering anemia in MM. Translated to the human disorder, our results indicate that initial anemia of MM would not be responsive to hepcidin or other inflammatory cytokine-targeted therapy, as proposed for anemia of chronic disorders.25 Its control would require interfering with apoptosis or modulating microenvironment iron availability, the latter being a link between anemia and PC growth. Interfering with PC iron homeostasis might favor cell death.26 This remains to be explored in vivo.
Acknowledgments
The authors would like to thank Giovanni Tonon and Federico Caligaris-Cappio for critical review of the manuscript.
Footnotes
Funding
This work was supported by the Program Grant in Molecular Oncology n. 9965 Associazione Italiana Ricerca sul Cancro 5 per 1000, Milano, Italy.
Authorship and Disclosures
Information on authorship, contributions, and financial & other disclosures was provided by the authors and is available with the online version of this article at www.haematologica.org.
References
- 1.Palumbo A, Anderson K. Multiple myeloma. N Engl J Med. 2011;364(11):1046–1060. [DOI] [PubMed] [Google Scholar]
- 2.Kyle RA, Gertz MA, Witzig TE, et al. Review of 1027 patients with newly diagnosed multiple myeloma. Mayo Clin Proc. 2003;78(1):21–33. [DOI] [PubMed] [Google Scholar]
- 3.Musto P, Falcone A, D’Arena G. Clinical results of recombinant erythropoietin in transfusiondependent patients with refractory multiple myeloma: role of cytokines and monitoring of erythropoiesis. Eur J Hematol. 1997;58:314–319. [DOI] [PubMed] [Google Scholar]
- 4.Cella D. The Functional Assessment of Cancer Therapy-Anemia (FACT-An) Scale: a new tool for the assessment of outcomes in cancer anemia and fatigue. Semin Hematol. 1997;34(3 Suppl 2):13–19. [PubMed] [Google Scholar]
- 5.Colmone A, Amorim M, Pontier AL, Wang S, Jablonski E, Sipkins DA. Leukemic cells create bone marrow niches that disrupt the behavior of normal hematopoietic progenitor cells. Science. 2008;322(5909):1861–1865. [DOI] [PubMed] [Google Scholar]
- 6.Silvestris F, Tucci M, Cafforio P, Dammacco F. Fas-L up-regulation by highly malignant myeloma plasma cells: role in the pathogenesis of anemia and disease progression. Blood. 2001;97(5):1155–1164. [DOI] [PubMed] [Google Scholar]
- 7.Silvestris F, Cafforio P, Tucci M, Dammacco F. Negative regulation of erythroblast maturation by Fas-L(+)/TRAIL(+) highly malignant plasma cells: a major pathogenetic mechanism of anemia in multiple myeloma. Blood. 2002;99(4):1305–1313. [DOI] [PubMed] [Google Scholar]
- 8.Sharma S, Nemeth E, Chen YH, et al. Involvement of hepcidin in the anemia of multiple myeloma. Clin Cancer Res. 2008; 14(11):3262–3267. [DOI] [PubMed] [Google Scholar]
- 9.Katodritou E, Ganz T, Terpos E, et al. Sequential evaluation of serum hepcidin in anemic myeloma patients: study of correlations with myeloma treatment, disease variables, and anemia response. Am J Hematol. 2009;84(8):524–526. [DOI] [PubMed] [Google Scholar]
- 10.Knutson MD, Oukka M, Koss LM, Aydemir F, Wessling-Resnick M. Iron release from macrophages after erythrophagocytosis is up-regulated by ferroportin 1 overexpression and down-regulated by hepcidin. Proc Natl Acad Sci USA. 2005;102(5):1324–1328. [DOI] [PMC free article] [PubMed] [Google Scholar]
- 11.Weiss G. Iron metabolism in the anemia of chronic disease. Biochim Biophys Acta. 2009;1790(7):682–693. [DOI] [PubMed] [Google Scholar]
- 12.Maes K, Nemeth E, Roodman GD, et al. In anemia of multiple myeloma, hepcidin is induced by increased bone morphogenetic protein 2. Blood. 2010;116(18):3635–3644. [DOI] [PMC free article] [PubMed] [Google Scholar]
- 13.Theurl I, Theurl M, Seifert M, et al. Autocrine formation of hepcidin induces iron retention in human monocytes. Blood. 2008;111(4):2392–2399. [DOI] [PubMed] [Google Scholar]
- 14.Bruns I, Cadeddu RP, Brueckmann I, et al. Multiple myeloma-related deregulation of bone marrow-derived CD34(+) hematopoietic stem and progenitor cells. Blood. 2012;120(13):2620–2630. [DOI] [PMC free article] [PubMed] [Google Scholar]
- 15.Chesi M, Robbiani DF, Sebag M, et al. AID- dependent activation of a MYC transgene induces multiple myeloma in a conditional mouse model of post-germinal center malignancies. Cancer Cell. 2008;13(2):167–180. [DOI] [PMC free article] [PubMed] [Google Scholar]
- 16.Liu J, Zhang J, Ginzburg Y, et al. Quantitative analysis of murine terminal erythroid differentiation in vivo: novel method to study normal and disordered erythropoiesis. Blood. 2013;121(8):e43–49. [DOI] [PMC free article] [PubMed] [Google Scholar]
- 17.Weiss G, Goodnough LT. Anemia of chronic disease. N Engl J Med. 2005;352(10): 1011–1023. [DOI] [PubMed] [Google Scholar]
- 18.Affer M, Chesi M, Chen WD, et al. Promiscuous MYC locus rearrangements hijack enhancers but mostly super-enhancers to dysregulate MYC expression in multiple myeloma. Leukemia. 2014; 28(8):1725–1735. [DOI] [PMC free article] [PubMed] [Google Scholar]
- 19.Chesi M, Matthews GM, Garbitt VM, et al. Drug response in a genetically engineered mouse model of multiple myeloma is predictive of clinical efficacy. Blood. 2012; 120(2):376–385. [DOI] [PMC free article] [PubMed] [Google Scholar]
- 20.Ganz T. Hepcidin and iron regulation, 10 years later. Blood. 2011;117(17):4425–4433. [DOI] [PMC free article] [PubMed] [Google Scholar]
- 21.Kim A, Rivera S, Shprung D, et al. Mouse models of anemia of cancer. PLoS One. 2014;9(3):e93283. [DOI] [PMC free article] [PubMed] [Google Scholar]
- 22.Rivella S. The role of ineffective erythropoiesis in non-transfusion-dependent thalassemia. Blood Rev. 2012;26 Suppl 1:S12–15. [DOI] [PMC free article] [PubMed] [Google Scholar]
- 23.Testa U. Apoptotic mechanisms in the control of erythropoiesis. Leukemia. 2004;18(7):1176–1199. [DOI] [PubMed] [Google Scholar]
- 24.Wu KJ, Polack A, Dalla-Favera R. Coordinated regulation of iron-controlling genes, H-ferritin and IRP2, by c-MYC. Science. 1999;283(5402):676–679. [DOI] [PubMed] [Google Scholar]
- 25.Fung E, Nemeth E. Manipulation of the hepcidin pathway for therapeutic purposes. Haematologica. 2013;98(11):1667–1676. [DOI] [PMC free article] [PubMed] [Google Scholar]
- 26.Campanella A, Santambrogio P, Fontana F, et al. Iron increases the susceptibility of multiple myeloma cells to bortezomib. Haematologica. 2013;98(6):971–979. [DOI] [PMC free article] [PubMed] [Google Scholar]