Abstract
Introduction
Substance abuse interventions tailored to the individual level have produced effective outcomes for a wide variety of behaviors. One approach to enhancing tailoring involves using cluster analysis to identify prevention subtypes that represent different attitudes about substance use. This study applied this approach to better understand tailored interventions for smoking and alcohol prevention.
Methods
Analyses were performed on a sample of sixth graders from 20 New England middle schools involved in a 36-month tailored intervention study. Most adolescents reported being in the Acquisition Precontemplation (aPC) stage at baseline: not smoking or not drinking and not planning to start in the next six months. For smoking (N= 4059) and alcohol (N= 3973), each sample was randomly split into five subsamples. Cluster analysis was performed within each subsample based on three variables: Pros and Cons (from Decisional Balance Scales), and Situational Temptations.
Results
Across all subsamples for both smoking and alcohol, the following four clusters were identified: (1) Most Protected (MP; low Pros, high Cons, low Temptations); (2) Ambivalent (AM; high Pros, average Cons and Temptations); (3) Risk Denial (RD; average Pros, low Cons, average Temptations); and (4) High Risk (HR; high Pros, low Cons, and very high Temptations).
Conclusions
Finding the same four clusters within aPC for both smoking and alcohol, replicating the results across the five subsamples, and demonstrating hypothesized relations among the clusters with additional external validity analyses provide strong evidence of the robustness of these results. These clusters demonstrate evidence of validity and can provide a basis for tailoring interventions.
Keywords: Cluster analysis, Prevention, Alcohol acquisition, Smoking acquisition
1. Replicating cluster subtypes for the prevention of adolescent smoking and alcohol use
Smoking and alcohol are two of the leading causes of morbidity and mortality in the United States (Danaei et al., 2009) and represent crucial concerns for public health. These behaviors, which can lead to severe health, legal, and economic consequences, often start in adolescence (Eaton et al., 2012). The percentage of youth that has tried or used tobacco doubles from sixth (3.3%) to eighth grade (7.7%; USDHHS, 2012), and nearly 40% of eighth-grade students have tried alcohol, with 8% reporting experiences with heavy drinking (Johnston, O'Malley, Bachman, & Schulenberg, 2009). School-based substance use primary prevention interventions are widespread and important to address these problem behaviors.
Despite nationwide efforts, prevention programs that have targeted substance abuse in adolescents have often produced mixed outcomes (Bruvold, 1993; Spencer, Pagell, Hallion, & Adams, 2002; Sussman, 2002). Many school-based prevention programs are identical for all students and are delivered to entire classrooms or schools. Tailored interventions, in contrast, adapt to the needs of individual students. Such interventions are often computer and/or internet-based programs that assess individuals on a number of key variables and then tailor intervention materials based on the response profiles. Guidelines for tailoring interventions are typically built upon a theoretical frame-work. Such computer-tailored interventions have demonstrated effectiveness in adolescent populations (Schwinn & Schinke, 2010; Sussman, 2002).
The present study utilizes data from a large, computer-tailored intervention designed to prevent substance abuse and increase energy balance behaviors in middle school students (Velicer et al., 2013) based on the Transtheoretical Model of Behavior Change (TTM). TTM is one of the most widely-utilized theories of behavior change (Noar, Benac, & Harris, 2007), and TTM-based interventions have been effective at stimulating health behavior change across a number of behaviors (Krebs, Prochaska, & Rossi, 2010). TTM prevention interventions often utilize the Acquisition Stages of Change (Pallonen, Prochaska, Velicer, Prokhorov, & Smith, 1998). The three stages include Acquisition Precontemplation(aPC), Acquisition Contemplation (aC), and Acquisition Preparation (aPR). These represent different levels of readiness to start a problem behavior, such as smoking.
In the Velicer et al. (2013) study, the energy balance intervention (physical activity, fruit and vegetable consumption, and limiting TV time) produced strong effects, but the substance abuse prevention intervention was not as effective. One step to improving the effectiveness of substance abuse prevention programs in adolescents is to better understand the characteristics of the population. The vast majority of non-smoking and non-drinking adolescents are in the aPC stage; they report no history of substance use and no plans to try anything in the next six months (Hollis et al., 2005; Plummer et al., 2001; Velicer, Redding, Anatchkova, Fava, & Prochaska, 2007). Thus, an important challenge with adolescents is the relevance of the intervention. To better tailor to such a large group, possible subgroups need to be considered. The purpose of the present study was to explore substance abuse prevention subgroups in a middle school sample.
1.1. Cluster analysis and prevention subgroups
Cluster analysis is an exploratory technique that is utilized to empirically identify homogenous subpopulations in data. The procedure groups individuals into categories based on the level, scatter, and shape of the patterns (Cronbach & Gleser, 1953). Cluster analyses have been utilized to explore data from TTM-based interventions in past studies; multiple studies (Anatchkova, Velicer, & Prochaska, 2005, 2006a,b; Norman, Velicer, Fava, & Prochaska, 2000; Velicer, Hughes, Fava, Prochaska, & DiClemente, 1995) have found replicable subtypes of smokers within different TTM stages of change for smoking cessation. These studies identified clusters using three key measures from the TTM: Pros, Cons, and Self-efficacy/Temptations.
Velicer et al. (2007) investigated subtypes within adolescent non-smokers. In a large sample of high school students (ninth graders; N = 2808), 71.6% of the students had no history of smoking. Among these non-smokers (n = 2010), the vast majority (n = 1753; 87.2%) were classified into the aPC stage. A series of cluster analyses were performed, utilizing Pros and Cons (Decisional Balance Inventory), and Situational Temptations, on three random subsamples. Four prevention subgroups were consistently found: (1) Protected (low Pros, high Cons, low Temptations); (2) Ambivalent (high Pros, average Cons and Temptations); (3) Risk Denial (average Pros, low Cons, average Temptations); and (4) High Risk (high Pros, low Cons, high Temptations). These clusters replicated across random subsamples and demonstrated compelling results in a series of external validity analyses.
1.2. Overview of current study
The goal of the present study was to investigate the existence of prevention subgroups within a large sample of middle school students in the Acquisition Precontemplation stage for two different behaviors, smoking and alcohol. The present paper replicates parts of the Velicer et al. (2007) paper in a new sample, a new age group (sixth graders instead of ninth graders), and a new behavior (alcohol). This paper reports two studies, as smoking and alcohol analyses were performed separately. The two main parts of each study were: (1) finding clusters and establishing internal validity; and (2) establishing external validity of the clusters with additional analyses. Identifying prevention subgroups provides a basis for the development of tailored interventions for smoking and alcohol prevention.
2. Method
2.1. Participants
The present study involved secondary data from a school-based prevention study for middle school students conducted between 2007 and 2011 (Velicer et al., 2013). Sixth grade students (average age = 11.40, S.D. = 0.69) from 20 Rhode Island middle schools were recruited for the study during the 2007–2008 academic year. Schools were randomly assigned to receive either a substance use prevention or energy balance intervention; a multiattribute utility measurement approach (MAUM; Graham, Flay, Johnson, Hansen, & Collins, 1984) was used to balance school-level characteristics (e.g., class size, percent free lunch eligible, racial/ethnic composition, smoking rate, alcohol use rate). The baseline sample (N = 4158) was 52.2% male, 65.0% white, 15.6% Hispanic (see Table 1). Study staff administered the computerized intervention at schools with laptops, and all students received substance use (smoking and alcohol) assessments at 12, 24, and 36 months. School-level retention was 100%, and student-level retention did not differ significantly between the two experimental groups. Overall retention was 82.7% at 12 months, 76.6% at 24 months, and 71.7% at 36 months. Consent and other human subject protocols were approved by the University of Rhode Island Institutional Review Board, and research was conducted according to APA ethical guidelines. Additional details about this study, including recruitment, demographics, procedures, and outcomes are available elsewhere (Velicer et al., 2013). The present study replicates parts of a previous study (Velicer et al., 2007) that explored clusters within a sample of non-smokers from a school-based prevention study for high school students. Compared to the present study, participants in the Velicer et al.(2007) study were older (ninth grade students, average age = 14.7, S.D. = 0.6), less diverse (78.8% white, 8.6% Hispanic), and there were slightly fewer males (49.8% male).
Table 1.
Baseline demographics for total sample. Tabled values are mean (standard deviation) for age and sample size (percentage) for categorical variables.
| Variable | Total sample (N = 4158) |
|---|---|
| Age | 11.40 (0.69) |
| Ethnicity | |
| Hispanic | 635 (15.6%) |
| Non-Hispanic | 3436 (84.4%) |
| Gender | |
| Male | 2162 (52.2%) |
| Female | 1976 (47.8) |
| Race | |
| American Indian/Alaskan Native | 93 (2.2%) |
| Asian | 101 (2.4%) |
| Black, non-Hispanic | 157 (3.8%) |
| Combination/mixed | 689 (16.6%) |
| Pacific Islander | 22 (0.5%) |
| Unknown/not reported | 387 (9.3%) |
| White, non-Hispanic | 2696 (65.0%) |
Cluster analyses were performed using baseline data for smoking (N = 4153) and alcohol (N = 4152). At baseline, 4059 (97.7%) of sixth graders were aPC for smoking, and 3973 (95.7%) were aPC for alcohol use. External validity analyses used data from 12, 24, and 36 month assessments. Smoking and alcohol statuses at baseline and all follow-up time points are included in Table 2.
Table 2.
Smoking and alcohol status at baseline, 12, 24, and 36 months. Tabled values are sample sizes (percentage).
| aPC | aC or aPR | Smoking/drinking | |
|---|---|---|---|
| Baseline assessment | |||
| Smoking (N = 4154) | 4059 (97.7%) | 41 (1.0%) | 54 (1.3%) |
| Alcohol (N = 4152) | 3973 (95.7%) | 92 (2.2%) | 87 (2.1%) |
| 12 month assessment | |||
| Smoking (N = 3435) | 3273 (95.3%) | 72 (2.1%) | 90 (2.6%) |
| Alcohol (N = 3426) | 3131 (91.4%) | 148 (4.3%) | 147 (4.3%) |
| 24 month assessment | |||
| Smoking (N = 3175) | 2941 (92.6%) | 66 (2.1%) | 168 (5.3%) |
| Alcohol (N = 3188) | 2676 (83.9%) | 241 (7.6%) | 271 (8.5%) |
| 36 month assessment | |||
| Smoking (N = 2946) | 2644 (89.7%) | 87 (3.0%) | 215 (7.3%) |
| Alcohol (N = 2959) | 2204 (74.5%) | 358 (12.1%) | 397 (13.4%) |
2.2. Measures
2.2.1. Acquisition stages of change
The stages of change represent the temporal dimension of the TTM and describe progress related to changing a behavior. Acquisition stages of change involve the initiation of a behavior (Pallonen et al., 1998; Plummer et al., 2001). For non-smokers/non-drinkers, two questions were used to measure acquisition stage; students were asked if they were thinking about or planning to try smoking/drinking within the next 30 days (Acquisition Preparation, aPR) or 6 months (Acquisition Contemplation, aC). Participants who reported that they were not thinking of trying smoking/drinking in the next 6 months were classified into the Acquisition Precontemplation (aPC) stage.
2.2.2. Decisional balance for prevention
The decisional balance construct assesses an individual's weighing of the pros and cons of engaging in a behavior (Velicer, DiClemente, Prochaska, & Brandenburg, 1985). Decisional Balance Scales include multiple items each for pros and cons of a behavior. The ten-item Decisional Balance Inventory for Prevention of Smoking (McGee et al., 2011) and six-item Decisional Balance Inventory for Prevention of Alcohol Use (Babbin et al., 2011) demonstrate factorial invariance and reliability. Items utilized 5-point Likert scales ranging from 1 (strongly disagree) to 5 (strongly agree).
2.2.3. Situational temptations for prevention
The situational temptations construct assesses an individual's perceived ability to perform behaviors in difficult situations (Velicer, DiClemente, Rossi, & Prochaska, 1990). The six-item Temptations to Try Smoking Scale (McGee et al., 2012) and nine-item Temptations to Try Alcohol Scale (Harrington et al., 2011) demonstrate factorial invariance and reliability. Items utilized 5-point Likert scales ranging from 1 (not at all tempted) to 5 (extremely tempted).
2.2.4. Family support
Scales were administered to students to rate how often their family discussed and provided support for avoiding smoking/drinking in the past month (Velicer et al., 2007). Each had four items, with 5-point Likert scales (see Appendix A.1), and sums of the responses were used in the external validity analyses.
Table A.1.
Smoking family support and alcohol family support scales.
| Smoking Family Support Scale | |
| Items | Encouraged each other to stay away from cigarettes. |
| Discussed how smoking is unhealthy. | |
| Reminded each other to avoid cigarette smoking. | |
| Shared ideas on how to stay a non-smoker or quit smoking cigarettes. | |
| Alcohol Family Support Scale | |
| Items | Discussed how drinking alcohol can get you into trouble. |
| Shared ideas on ways to have fun without drinking. | |
| Encouraged each other to avoid underage drinking. | |
| Reminded each other to stay away from underage drinking. | |
| Responses for both scales |
1 (almost never) |
| 2 (once in a while) | |
| 3 (sometimes) | |
| 4 (often) | |
| 5 (almost always) | |
2.2.5. Processes of change for prevention
The processes involve strategies for changing one's behavior (Prochaska, Velicer, DiClemente, & Fava, 1988). The processes typically encompass two broad dimensions: experiential processes and behavioral processes. Items utilized 5-point Likert scales ranging from 1 (never) to 5 (always). For both smoking and alcohol, there were 11 processes, each with three items; the sums of these items were used in the external validity analyses.
2.3. Procedure
This study was composed of two separate studies, as analyses were performed separately for smoking and alcohol, each with two main phases. In the first phase, clusters were found and internal validity was established through replication across subgroups. In the second phase, the external validity of the clusters was established using processes scales, family support scales, and substance use at 12, 24, and 36 months.
2.3.1. Cluster analysis procedure
For smoking, the sample of 4059 aPC students was randomly divided into five subsamples of approximately 812 students. For alcohol, the sample of 3973 aPC students was randomly divided into five subsamples of approximately 795 students. A separate cluster analysis was performed within each subsample. Each cluster analysis was based on three variables: Pros, Cons, and Temptations. Smoking analyses employed the Pros of Smoking, Cons of Smoking, and Temptations to Try Smoking. Alcohol analyses employed the Pros of Alcohol Use, Cons of Alcohol Use, and Temptations to Try Alcohol. To create a consistent metric, composite scores for Pros, Cons, and Temptations were created and were standardized to T-scores (mean = 50, standard deviation = 10).
Clustering was performed using a squared Euclidean distance metric (Cronbach & Gleser, 1953) and Ward's minimum variance clustering (Ward, 1963). Multiple methods were utilized to determine the number of clusters. These included statistical indices such as the inverse scree test (Lathrop & Williams, 1987) and the pseudo-F test (Calinski & Harabasz, 1974), as well as visual inspections of the resulting cluster profiles. Descriptions of the subgroups were based on three key characteristics: level (overall mean across clusters), scatter (variability), and shape (pattern of scores). Internal validity of the clustering was established through replication of the subgroups across the subsamples.
2.3.2. External validity
External validity was established by investigating the relations among identified clusters and variables not included in the clustering. Variables included smoking/alcohol family support scales, the 11 processes of change for smoking/alcohol prevention, and future smoking/drinking statuses at 12, 24, and 36 months (which evaluated the predictive usefulness of the clusters). Baseline cluster membership was also compared across demographic variables to explore possible differences.
3. Results
3.1. Cluster subtypes for smoking
A four-cluster solution was found to best represent the data for each of the five random subsamples. Cluster sizes, standard score means, and standard deviations for the four clusters in each of the five subsamples are summarized in Table 3. Figs. 1 through 5 display these cluster profiles.
Table 3.
Standard score means and standard deviations for the four clusters on the Pros, Cons, and Temptations for smoking.
| Most Protected |
Ambivalent |
Risk Denial |
High Risk |
|||||||||
|---|---|---|---|---|---|---|---|---|---|---|---|---|
| N | Mean | S.D. | N | Mean | S.D. | N | Mean | S.D. | N | Mean | S.D. | |
| Subsample 1 | 563 | 177 | 28 | 44 | ||||||||
| Pros | 45.27 | 2.62 | 61.51 | 10.47 | 49.22 | 8.30 | 64.65 | 15.69 | ||||
| Cons | 51.95 | 6.11 | 50.71 | 6.36 | 13.10 | 8.06 | 45.64 | 15.29 | ||||
| Temptations | 47.25 | 1.80 | 50.45 | 6.08 | 47.89 | 2.21 | 84.65 | 18.93 | ||||
| Subsample 2 | 554 | 96 | 144 | 18 | ||||||||
| Pros | 46.36 | 4.10 | 67.77 | 10.95 | 49.75 | 7.21 | 69.13 | 22.69 | ||||
| Cons | 54.34 | 1.69 | 50.82 | 5.03 | 33.55 | 12.81 | 43.61 | 14.15 | ||||
| Temptations | 47.61 | 2.83 | 54.87 | 10.52 | 49.18 | 5.89 | 104.02 | 13.57 | ||||
| Subsample 3 | 576 | 55 | 153 | 28 | ||||||||
| Pros | 47.02 | 4.81 | 73.50 | 10.42 | 50.15 | 6.90 | 64.38 | 22.29 | ||||
| Cons | 54.45 | 1.96 | 48.13 | 7.93 | 35.07 | 12.15 | 43.68 | 15.16 | ||||
| Temptations | 47.57 | 3.22 | 53.12 | 7.89 | 49.96 | 7.10 | 94.10 | 14.57 | ||||
| Subsample 4 | 647 | 54 | 101 | 10 | ||||||||
| Pros | 47.39 | 5.71 | 71.78 | 12.37 | 51.87 | 6.85 | 82.34 | 26.70 | ||||
| Cons | 53.60 | 3.20 | 42.61 | 13.70 | 31.56 | 12.68 | 43.59 | 16.32 | ||||
| Temptations | 48.24 | 4.04 | 62.24 | 14.87 | 48.14 | 3.80 | 116.46 | 17.62 | ||||
| Subsample 5 | 552 | 168 | 32 | 59 | ||||||||
| Pros | 45.30 | 2.64 | 58.48 | 7.22 | 45.73 | 3.33 | 72.20 | 15.63 | ||||
| Cons | 52.61 | 5.13 | 51.62 | 4.83 | 18.56 | 9.23 | 38.05 | 16.47 | ||||
| Temptations | 48.13 | 4.84 | 47.76 | 3.01 | 47.74 | 4.66 | 75.08 | 21.11 | ||||
Fig. 1.
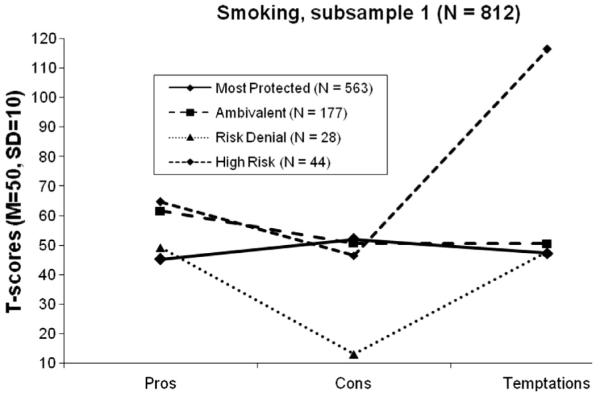
Four cluster profiles for smoking, subsample 1.
Fig. 5.
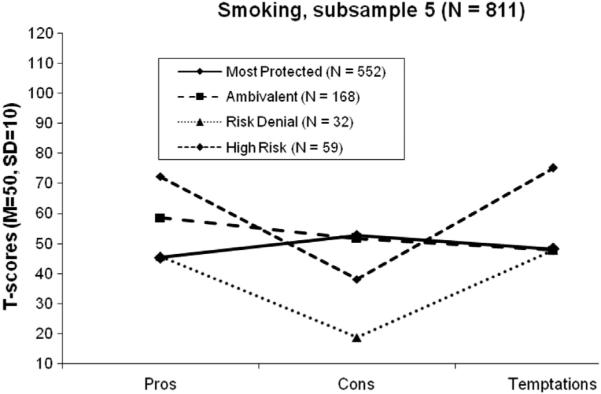
Four cluster profiles for smoking, subsample 5.
3.2. Cluster subtypes for alcohol
A four-cluster solution was found to best represent the data for each of the five random subsamples. Cluster sizes, standard score means, and standard deviations for the four clusters in each of the five subsamples are summarized in Table 4. Figs. 6 through 10 display these cluster profiles.
Table 4.
Standard score means and standard deviations for the four clusters on the pros, cons, and temptations for alcohol.
| Most Protected |
Ambivalent |
Risk Denial |
High Risk |
|||||||||
|---|---|---|---|---|---|---|---|---|---|---|---|---|
| N | Mean | S.D. | N | Mean | S.D. | N | Mean | S.D. | N | Mean | S.D. | |
| Subsample 1 | 492 | 223 | 70 | 10 | ||||||||
| Pros | 44.17 | 2.31 | 62.25 | 9.40 | 50.55 | 8.19 | 59.82 | 12.48 | ||||
| Cons | 52.67 | 6.35 | 52.06 | 5.94 | 26.38 | 8.80 | 38.34 | 13.17 | ||||
| Temptations | 48.02 | 3.67 | 51.56 | 8.59 | 49.26 | 7.09 | 117.63 | 22.79 | ||||
| Subsample 2 | 351 | 248 | 186 | 10 | ||||||||
| Pros | 43.66 | 0.94 | 60.03 | 9.56 | 47.80 | 7.65 | 64.79 | 19.82 | ||||
| Cons | 56.26 | 1.29 | 51.95 | 5.47 | 35.80 | 9.90 | 45.98 | 10.03 | ||||
| Temptations | 47.88 | 4.34 | 51.18 | 8.53 | 48.81 | 4.64 | 117.50 | 18.56 | ||||
| Subsample 3 | 335 | 173 | 278 | 9 | ||||||||
| Pros | 43.82 | 1.68 | 63.91 | 8.60 | 48.12 | 6.31 | 70.74 | 21.25 | ||||
| Cons | 56.28 | 1.23 | 53.11 | 5.94 | 40.70 | 10.92 | 43.90 | 7.99 | ||||
| Temptations | 47.23 | 1.29 | 51.38 | 8.43 | 50.13 | 7.33 | 122.49 | 13.83 | ||||
| Subsample 4 | 415 | 205 | 159 | 15 | ||||||||
| Pros | 45.25 | 3.22 | 62.83 | 9.30 | 44.39 | 2.62 | 65.74 | 17.82 | ||||
| Cons | 56.05 | 1.71 | 48.20 | 8.29 | 37.00 | 10.92 | 45.14 | 12.43 | ||||
| Temptations | 47.96 | 3.56 | 51.76 | 7.92 | 47.41 | 1.61 | 109.90 | 16.03 | ||||
| Subsample 5 | 498 | 208 | 69 | 19 | ||||||||
| Pros | 44.61 | 2.50 | 62.77 | 7.13 | 44.76 | 3.00 | 70.39 | 19.55 | ||||
| Cons | 53.95 | 4.18 | 48.97 | 8.76 | 26.81 | 9.30 | 42.04 | 11.98 | ||||
| Temptations | 47.74 | 3.25 | 50.86 | 7.09 | 48.98 | 4.52 | 103.60 | 16.48 | ||||
Fig. 6.
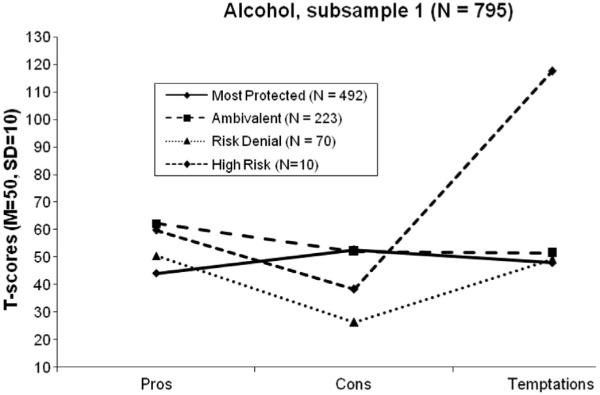
Four cluster profiles for alcohol, subsample 1.
Fig. 10.
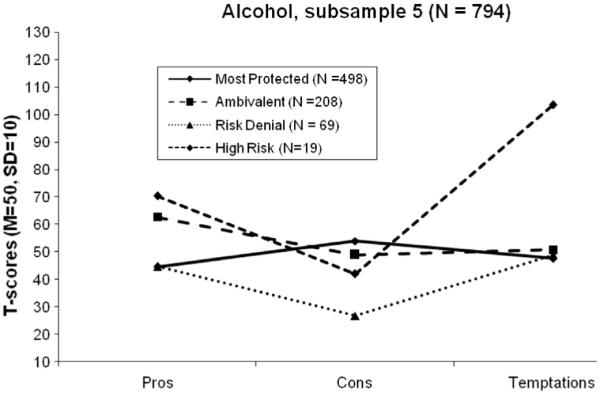
Four cluster profiles for alcohol, subsample 5.
3.3. Descriptions of clusters
The cluster profiles for smoking and alcohol were extremely similar and were thus given identical labels. Cluster 1 was labeled Most Protected (MP). This subtype was characterized by low Pros, high Cons, and low Temptations, which created an inverted V shape when graphed. Across both behaviors, each with five subsamples, the MP subgroup was the largest cluster. Level (overall mean) and shape (pattern of scores) were consistent across subsamples and behaviors. On average, this subgroup also had the lowest scatter (variability).
Cluster 2 was labeled Ambivalent (AM). This subtype was characterized by high Pros, average Cons, and average Temptations. Across the five subsamples, for both smoking and alcohol, the AM subgroup was either the second or third-largest cluster. For smoking, there was some variability in shape; some subsamples created a V shape (with higher temptations), but others were more flat (with lower temptations). For alcohol, shape was more consistent. Level was consistent across subsamples and behaviors.
Cluster 3 was labeled Risk Denial (RD). This subtype was characterized by average Pros, low Cons, and average Temptations, which created a V shape. For smoking, the RD subgroup was the second-largest cluster in three out of five of the subsamples. For alcohol, the RD subgroup was the third-largest cluster in four out of five of the subsamples. Level was consistently low across all subsamples and behaviors. On average, this subgroup had a moderate amount of scatter.
Cluster 4 was labeled High Risk (HR). This subtype was characterized by high Pros, low Cons, and very high Temptations, which created a V pattern. HR was usually the smallest cluster. Level and shape were consistent across subsamples and behaviors. This subgroup had the highest amount of scatter.
3.4. External validity for smoking
A cluster analysis on the total sample of students in aPC for smoking (N = 4059) replicated the previously found subgroups: MP (N = 2866), AM (N = 592), RD (N = 550), and HR (N = 51). These sub-groups were used for external validity analyses.
A one-way MANOVA using Wilks' Lambda criteria, with family support and the 11 processes of change as the dependent measures, indicated a significant difference across the four subgroups, F(36, 5351.53) = 6.67, p < 0.001, η2 = 0.042. Follow-up one-way ANOVAs and subsequent Tukey HSD tests are summarized in Table 5. Significant (p < 0.001) differences were found across the four subgroups across all variables. For family support, MP and RD reported significantly more family support for non-smoking than the other subgroups. For the processes, the MP subgroup was associated with the greatest means and the AM subgroup was associated with the lowest means.
Table 5.
External validity analyses for smoking at baseline. Tabled values are means (S.D.).
| Most Protected (N = 2866) |
Ambivalent (N = 592) |
Risk Denial (N = 550) |
High Risk (N = 51) |
η 2 | Tukey HSD*
(harmonic means) |
|
|---|---|---|---|---|---|---|
| Family support | 13.40 (5.37) | 11.33 (5.35) | 12.92 (5.66) | 10.72 (5.79) | 0.020 | MP = RD > AM > HR |
| Processes of change for smoking prevention | ||||||
| Counter conditioning | 14.51 (1.53) | 12.95 (3.31) | 13.89 (2.53) | 13.00 (3.74) | 0.067 | MP > RD = HR = AM |
| Consciousness raising | 13.48 (2.30) | 11.74 (3.46) | 13.10 (2.92) | 12.38 (3.34) | 0.049 | MP = RD > HR = AM |
| Dramatic relief | 13.25 (2.60) | 11.23 (3.74) | 12.77 (3.06) | 12.44 (3.61) | 0.053 | MP = RD = HR > AM |
| Environmental reevaluation | 13.16 (2.37) | 11.28 (3.54) | 12.78 (2.96) | 13.13 (3.28) | 0.053 | MP = RD = HR > AM |
| Helping relationships | 12.94 (2.73) | 11.24 (3.67) | 12.56 (3.22) | 12.69 (2.73) | 0.035 | MP = RD = HR > AM |
| Refusal assertiveness | 13.62 (2.13) | 11.94 (3.46) | 13.21 (2.87) | 13.06 (3.51) | 0.049 | MP > RD = HR > AM |
| Reinforcement management | 12.15 (3.55) | 10.47 (4.15) | 11.99 (3.76) | 12.13 (3.56) | 0.023 | MP = RD = HR > AM |
| Stimulus control | 13.75 (2.19) | 11.70 (3.76) | 13.26 (2.98) | 12.90 (3.36) | 0.066 | MP = RD = HR > AM |
| Self-liberation | 13.93 (2.09) | 11.91 (3.72) | 13.56 (2.80) | 13.38 (3.26) | 0.069 | MP = RD = HR > AM |
| Social liberation | 13.52 (2.26) | 12.05 (3.34) | 13.24 (2.88) | 13.25 (3.34) | 0.036 | MP = RD = HR > AM |
| Self-reevaluation | 14.26 (1.88) | 12.34 (3.67) | 13.87 (2.63) | 13.50 (3.54) | 0.071 | MP > RD = HR > AM |
For all comparisons, overall F was significant, p < 0.001.
MP = Most Protected; AM = Ambivalent; RD = Risk Denial; HR = High Risk.
Homogenous subsets using a harmonic mean sample size = 170.47.
3.4.1. Cluster membership and prospective smoking status
Baseline cluster membership was compared to future smoking status (aPC, aC, aPR, or smoking) at 12, 24, and 36-month assessments (see Table 6). Contingency tables were created for each time point. At 12 months, a significant difference was found, χ2 = 44.09, p < 0.001, Cramer's V = 0.081. The proportion remaining in aPC was the highest for MP (97.0%) and lowest for HR (86.1%). At 24 months, a significant difference was found, χ2 = 19.34, p = 0.004, and Cramer's V = 0.004. The proportion remaining in aPC was the highest for MP (94.2%) and lowest for AM (88.9%). At 36 months, a significant difference was found, χ2 = 19.63, p = 0.003, Cramer's V = 0.003. Due to attrition of non-aPC smokers in the HR group, it had the highest proportion remaining in aPC (100%), with MP second (94.2%); the lowest was for AM (85.8%).
Table 6.
Prospective smoking status 12, 24, and 36 months later by baseline cluster.
| Baseline cluster (n) | Classified as aPC |
Classified as aC or aPR |
Started smoking |
|||
|---|---|---|---|---|---|---|
| n | % | n | % | n | % | |
| 12 month assessment | ||||||
| Most Protected (2474) | 2401 | 97.0% | 35 | 1.4% | 38 | 1.5% |
| Ambivalent (439) | 404 | 92.0% | 18 | 4.1% | 17 | 3.9% |
| Risk Denial (434) | 417 | 96.1% | 6 | 1.4% | 11 | 2.5% |
| High Risk (36) | 31 | 86.1% | 4 | 11.1% | 1 | 2.8% |
| 24 month assessment | ||||||
| Most Protected (2273) | 2141 | 94.2% | 39 | 1.7% | 93 | 4.1% |
| Ambivalent (405) | 360 | 88.9% | 16 | 4.0% | 29 | 7.2% |
| Risk Denial (411) | 384 | 93.4% | 7 | 1.7% | 20 | 4.9% |
| High Risk (35) | 32 | 91.4% | 2 | 5.7% | 1 | 2.9% |
| 36 month assessment | ||||||
| Most Protected (2118) | 1934 | 91.3% | 63 | 3.0% | 121 | 5.7% |
| Ambivalent (372) | 319 | 85.8% | 11 | 3.0% | 42 | 11.3% |
| Risk Denial (386) | 345 | 89.4% | 13 | 3.4% | 28 | 7.3% |
| High Risk (29) | 29 | 100.0% | 0 | 0.0% | 0 | 0.0% |
aPC = Acquisition Precontemplation; aC = Acquisition Contemplation; and aPR = Acquisition Preparation.
3.5. External validity for alcohol
A cluster analysis on the total sample of students in aPC for alcohol (N = 3973) replicated the previously found subgroups: MP (N = 2196), AM (N = 1098), RD (N = 488), and HR (N = 191). These subgroups were used for external validity analyses.
A one-way MANOVA using Wilks' Lambda criteria, with family support and the 11 processes of change as the dependent measures, indicated a significant difference across the four subgroups, F(36, 5319.03) = 6.32, p < 0.001, η2 = 0.040. Follow-up one-way ANOVAs and subsequent Tukey HSD tests are summarized in Table 7. Significant (p < 0.001) differences were found across the four subgroups across all variables. For family support, the MP subgroup reported significantly more family support for non-drinking than the other subgroups. For the processes, the MP subgroup was associated with the greatest means and the HR subgroup was associated with the lowest means.
Table 7.
External validity analyses for alcohol at baseline. Tabled values are means (S.D.).
| Most Protected (N = 2196) |
Ambivalent (N = 1098) |
Risk Denial (N = 488) |
High Risk (N = 191) |
η 2 | Tukey HSD*
(harmonic means) |
|
|---|---|---|---|---|---|---|
| Family support | 13.22 (5.49) | 11.87 (5.62) | 11.94 (6.16) | 10.69 (5.49) | 0.018 | MP > RD = AM > HR |
| Processes of change for alcohol prevention | ||||||
| Counter conditioning | 14.03 (2.11) | 13.29 (2.73) | 12.94 (3.52) | 11.06 (4.22) | 0.066 | MP > AM = RD > HR |
| Consciousness raising | 12.70 (2.87) | 11.98 (3.31) | 11.75 (3.73) | 9.80 (4.43) | 0.042 | MP > AM = RD > HR |
| Dramatic relief | 12.24 (3.20) | 11.49 (3.61) | 11.32 (3.99) | 9.12 (4.23) | 0.040 | MP > AM = RD > HR |
| Environmental reevaluation | 13.13 (2.80) | 12.32 (3.23) | 12.06 (3.76) | 9.86 (4.25) | 0.054 | MP > AM = RD > HR |
| Helping relationships | 13.29 (2.81) | 12.36 (3.47) | 12.19 (3.77) | 9.87 (4.31) | 0.058 | MP > AM = RD > HR |
| Refusal assertiveness | 14.06 (2.18) | 13.30 (2.81) | 13.00 (3.47) | 10.29 (4.48) | 0.088 | MP > AM = RD > HR |
| Reinforcement management | 12.58 (3.37) | 11.60 (3.89) | 11.84 (4.00) | 9.67 (4.66) | 0.035 | MP > AM = RD > HR |
| Stimulus control | 13.87 (2.38) | 13.02 (2.38) | 12.52 (3.74) | 10.30 (4.31) | 0.081 | MP > AM = RD > HR |
| Self-liberation | 13.82 (2.43) | 13.05 (3.05) | 12.88 (3.56) | 10.26 (4.33) | 0.070 | MP > AM = RD > HR |
| Social liberation | 13.90 (2.45) | 13.19 (2.94) | 12.85 (3.49) | 10.39 (4.26) | 0.075 | MP > AM = RD > HR |
| Self-reevaluation | 13.99 (2.28) | 13.27 (2.99) | 12.97 (3.57) | 10.55 (4.31) | 0.071 | MP > AM = RD > HR |
For all comparisons, overall F was significant, p < 0.001.
MP = Most Protected; AM = Ambivalent; RD = Risk Denial; HR = High Risk
Homogenous subsets using a harmonic mean sample size = 462.38.
3.5.1. Cluster membership and prospective alcohol status
Baseline cluster membership was compared to future alcohol status (aPC, aC, aPR, or drinking) at 12, 24, and 36-month assessments (see Table 8). At 12 months, a significant difference was found, χ2 = 69.90, p < 0.001, and Cramer's V = 0.103. The proportion remaining in aPC was the highest for MP (94.9%) and the lowest for HR (77.1%). At 24 months, a significant difference was found, χ2 = 53.04, p b 0.001, Cramer's V = 0.093. The proportion remaining in aPC was the highest for MP (88.3%) and the lowest for HR (69.2%). At 36 months, a significant difference was found, χ2 = 23.77, p = 0.001, and Cramer's V = 0.064. The proportion remaining in aPC was the highest for MP (78.4%) and the lowest for the HR (60.2%).
Table 8.
Prospective alcohol status 12, 24, and 36 months later by baseline cluster.
| Baseline cluster (n) | Classified as aPC |
Classified as aC or aPR |
Started drinking |
|||
|---|---|---|---|---|---|---|
| n | % | n | % | n | % | |
| 12 month assessment | ||||||
| Most Protected (1895) | 1799 | 94.9% | 55 | 2.9% | 41 | 2.2% |
| Ambivalent (895) | 825 | 92.2% | 38 | 4.2% | 32 | 3.6% |
| Risk Denial (395) | 358 | 90.6% | 19 | 4.8% | 18 | 4.6% |
| High Risk (140) | 108 | 77.1% | 16 | 11.4% | 16 | 11.4% |
| 24 month assessment | ||||||
| Most Protected (1764) | 1557 | 88.3% | 115 | 6.5% | 92 | 5.2% |
| Ambivalent (840) | 715 | 85.1% | 71 | 8.5% | 54 | 6.4% |
| Risk Denial (351) | 288 | 82.1% | 25 | 7.1% | 38 | 10.8% |
| High Risk (130) | 90 | 69.2% | 17 | 13.1% | 23 | 17.7% |
| 36 month assessment | ||||||
| Most Protected (1654) | 1297 | 78.4% | 179 | 10.8% | 178 | 10.8% |
| Ambivalent (776) | 579 | 74.6% | 102 | 13.1% | 95 | 12.2% |
| Risk Denial (332) | 242 | 72.9% | 42 | 12.7% | 48 | 14.5% |
| High Risk (108) | 65 | 60.2% | 20 | 18.5% | 23 | 21.3% |
aPC = Acquisition Precontemplation; aC = Acquisition Contemplation; and aPR = Acquisition Preparation.
3.6. Cluster membership and demographics
Baseline cluster membership was compared across demographic variables. For gender, a non-significant difference was found for smoking, χ2 = 6.86, p = 0.076, Cramer's V = 0.041, and a significant difference was found for alcohol, χ2 = 34.65, p < 0.001, Cramer's V = 0.094. The proportion of females in MP (59.5%) for alcohol use was greater than in males (51.6%). For ethnicity, a significant difference was found for smoking, χ2 = 72.36, p < 0.001, Cramer's V =0.135, and for alcohol, χ2 = 40.08, p < 0.001, Cramer's V = 0.101. The proportion of non-Hispanics in MP for both smoking (72.7%) and alcohol use (57.0%) was greater than in Hispanics (58.9% and 44.6%, respectively). For race, a significant difference was found for smoking, χ2 = 110.27, p < 0.001, Cramer's V = 0.095, and for alcohol, χ2 = 58.91, p < 0.000, Cramer's V = 0.070. The proportion of non-Hispanic Whites in MP for both smoking (75.1%) and alcohol use (58.4%) was greater than the other groups.
4. Discussion
For smoking and alcohol, the four cluster prevention subtypes were found to replicate across all random subsamples as well as across both behaviors. The remarkably similar shapes and levels of these clusters (Figs. 1 through 10) across subsamples and behaviors suggest that these patterns were robust and had internal validity. Additionally, relations among these clusters and external variables provided evidence of the substantive meaningfulness of the clusters. The subtypes were differentially related to future smoking and drinking status, and each of these subtypes provided useful information regarding adolescent interest in trying smoking or alcohol.
4.1. Clusters for prevention
The Most Protected (MP) subtype was characterized by low Pros, high Cons, and low Temptations. It was the largest cluster for both smoking and alcohol. Students in this cluster were non-smokers/nondrinkers that had little interest in smoking/drinking, and were at low risk for engaging in these behaviors. For both smoking and alcohol, the MP subgroup was associated with the largest means for family support and all 11 processes of change. Members of this subgroup were usually the most likely to remain in aPC at 12, 24, and 36-month assessments.
The Ambivalent (AM) subtype was characterized by high Pros, average Cons, and average Temptations. Students in this cluster appeared to have some interest in smoking/drinking, but lacked strong opinions. Evidence from external validity analyses suggested that members were at moderate to high risk for smoking and at moderate risk for drinking. For smoking, the AM group was significantly the least likely to use all of the processes of change, and was the least likely to remain in aPC at 24 and 36-month assessments. For alcohol, the AM group was intermediate between MP and HR for process use, and was the second most-likely to remain in aPC at 12, 24, and 36-month assessments. The more severe outcomes for smoking may have been due to the low sample sizes for HR.
The Risk Denial (RD) subtype was characterized by average Pros, low Cons, and average Temptations. Students in this cluster appeared to have some interest in smoking/drinking and denied negative aspects of substance use. Members of this subgroup were typically at moderate risk for smoking and drinking. For smoking, these students often had levels of family support and process use comparable to the MP group, and were the second-most likely to remain in aPC at 12 and 24-month assessments. For alcohol, the RD group was intermediate between MP and HR for family support and process use, and was the second-most likely to leave aPC at 12, 24, and 36-month assessments.
The High Risk (HR) subtype was characterized by high Pros, low Cons, and very high Temptations. It was typically the smallest cluster. Students in this cluster appeared to be interested in smoking/drinking. For smoking, the HR group was more likely to use all of the processes of change than the AM group, but was the most likely to leave aPC at the 12-month assessment. For alcohol, the HR had the lowest means for family support and all 11 processes of change. Members of this subgroup were the least likely to remain in aPC at 12, 24, and 36-month assessments.
These four subtypes replicated not only across random subsamples and across behaviors, but they also replicated the results from the Velicer et al. (2007) study that investigated prevention subtypes in a different adolescent age group, high school students. The patterns and shapes of the clusters were similar, as were the results with future substance use status. These findings suggest that the four prevention clusters are robust across both middle school-age and high school-age students. The subgroups were found to vary slightly across demographics, and these findings could be explored further in future studies with a more diverse sample.
4.2. Limitations
The MP subtype was the most consistent cluster across all subsamples for both behaviors. For both smoking and alcohol, the AM and RD subgroups often had very similar sizes. The results from the cluster analyses consistently suggested that AM and RD were two separate clusters, but some students likely fell in the middle. Alternative methods of identifying homogenous subgroups (e.g., latent profile analysis; Collins & Lanza, 2009) could be employed in future studies.
The HR group included students that would typically need the most attention in an intervention. Unfortunately, this group was usually the smallest of the subgroups, which added difficulty to the interpretation of the profile. The low sample sizes reduced power in the external validity analyses for both behaviors. Future studies could utilize samples with a greater proportion of HR adolescents to better understand the characteristics of this subtype. With additional evidence that the HR group is associated with the most severe outcomes, future investigations could identify HR adolescents at baseline and ensure that they receive special attention.
5. Conclusions
Cluster subtypes for prevention have potential utility in interventions. Prevention materials could be developed specifically for each of the subgroups to be optimally helpful and relevant to students. After classifying participants at baseline (by comparing baseline scores to a comparable data set or pilot data), modern, computer-based interventions could be used to tailor materials by subgroup.
The identification of four distinct, replicable subtypes within nondrinkers and non-smokers suggests that “one-size-fits-all” interventions may not be the best approach. Students who are in the aPC stage may not view some interventions as particularly relevant, and may not engage. This is problematic because some subtypes within the aPC stage are at relatively high-risk for smoking or drinking in the future. Better understanding of these subtypes represents an important challenge, for tailoring intervention materials to these groups could be extremely beneficial for the prevention of substance abuse.
HIGHLIGHTS.
Most adolescents report not smoking or drinking and not planning to start.
Cluster analysis was utilized to better understand attitudes about substance use.
Four subtypes were found: Most Protected, Ambivalent, Risk Denial, and High Risk.
These clusters replicated across subsamples for both smoking and alcohol.
These subtypes can provide a basis for tailoring interventions.
Fig. 2.
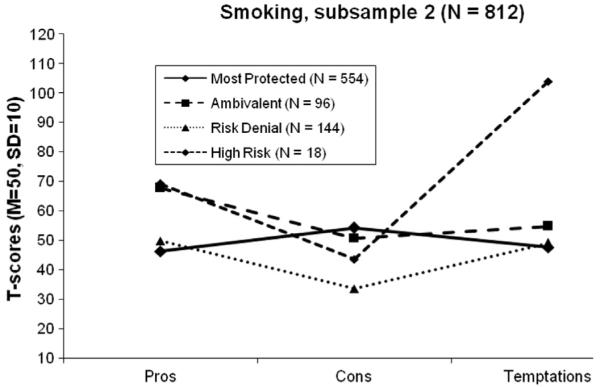
Four cluster profiles for smoking, subsample 2.
Fig. 3.
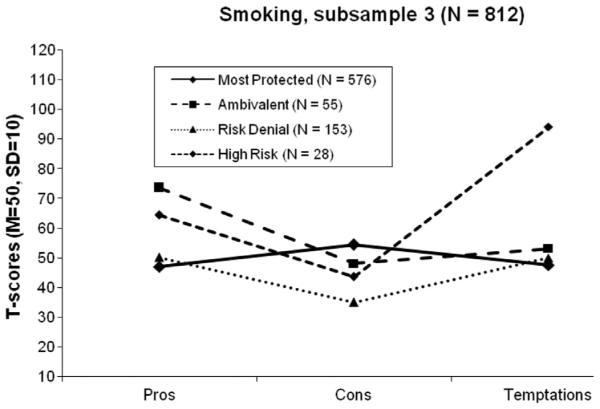
Four cluster profiles for smoking, subsample 3.
Fig. 4.
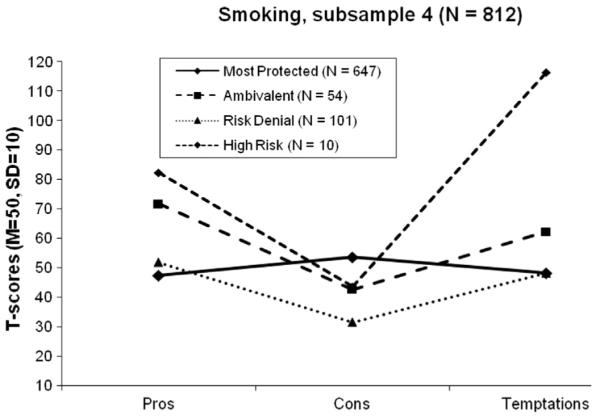
Four cluster profiles for smoking, subsample 4.
Fig. 7.
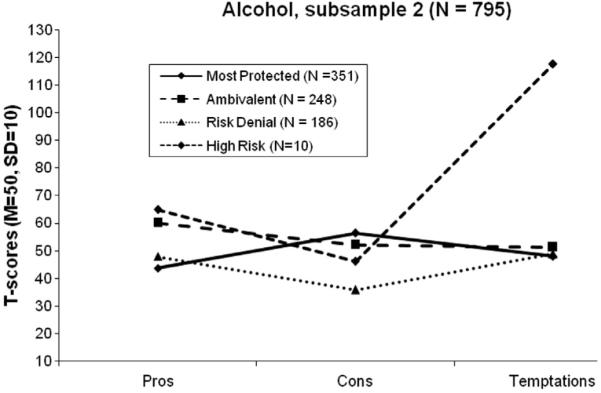
Four cluster profiles for alcohol, subsample 2.
Fig. 8.
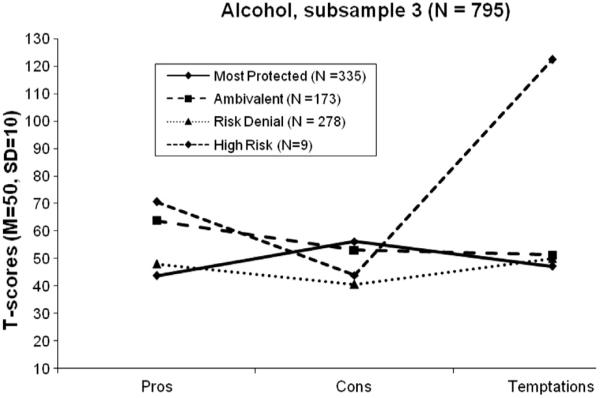
Four cluster profiles for alcohol, subsample 3.
Fig. 9.
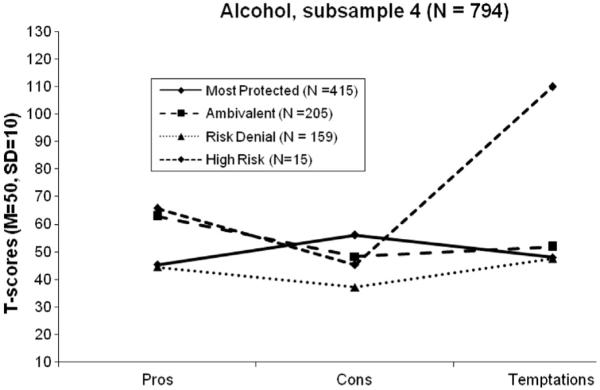
Four cluster profiles for alcohol, subsample 4.
Acknowledgments
Role of funding sources
This paper was partially supported by Grant DA020112 from NIDA (PI: Velicer). NIDA had no role in the study design, analysis, interpretation of the data, writing of the manuscript, or the decision to submit the paper for publication.
Footnotes
Conflict of interest
All authors declare that they have no conflicts of interest.
References
- Anatchkova MD, Velicer WF, Prochaska JO. Replication of subtypes for smoking cessation within the contemplation stage of change. Addictive Behaviors. 2005;30(5):915–927. doi: 10.1016/j.addbeh.2004.09.011. [DOI] [PubMed] [Google Scholar]
- Anatchkova MD, Velicer WF, Prochaska JO. Replication of subtypes for smoking cessation within the preparation stage of change. Addictive Behaviors. 2006a;31(2):359–366. doi: 10.1016/j.addbeh.2005.05.015. [DOI] [PubMed] [Google Scholar]
- Anatchkova MD, Velicer WF, Prochaska JO. Replication of subtypes for smoking cessation within the precontemplation stage of change. Addictive Behaviors. 2006b;31(7):1101–1115. doi: 10.1016/j.addbeh.2005.08.002. [DOI] [PubMed] [Google Scholar]
- Babbin SF, Harrington M, Burditt C, Redding C, Paiva A, Meier K, et al. Prevention of alcohol use in middle school students: Psychometric assessment of the decisional balance inventory. Addictive Behaviors. 2011;36:543–546. doi: 10.1016/j.addbeh.2011.01.010. [DOI] [PMC free article] [PubMed] [Google Scholar]
- Bruvold WH. A meta-analysis of adolescent smoking prevention programs. American Journal of Public Health. 1993;83(6):872–880. doi: 10.2105/ajph.83.6.872. [DOI] [PMC free article] [PubMed] [Google Scholar]
- Calinski T, Harabasz J. A dendrite method for cluster analysis. Communications in Statistics. 1974;3(1):1–27. [Google Scholar]
- Collins LM, Lanza ST. Wiley; Hoboken, NJ: 2009. Latent class and latent transition analysis: With applications in the social, behavioral, and health sciences. [Google Scholar]
- Cronbach LJ, Gleser G. Assessing similarities between profiles. Psychological Bulletin. 1953;50:456–473. doi: 10.1037/h0057173. [DOI] [PubMed] [Google Scholar]
- Danaei G, Ding EL, Mozaffarian D, Taylor B, Rehm J, Murray CJ, et al. The preventable causes of death in the United States: Comparative risk assessment of dietary, lifestyle, and metabolic risk factors. PLoS Medicine. 2009;6(4):e1000058. doi: 10.1371/journal.pmed.1000058. [DOI] [PMC free article] [PubMed] [Google Scholar]
- Eaton DK, Kann L, Kinchen S, Shanklin S, Flint KH, Hawkins J, et al. Youth risk behavior surveillance—United States, 2011. MMWR Surveillance Summaries. 2012;61(4):1–162. [PubMed] [Google Scholar]
- Graham JW, Flay BR, Johnson CA, Hansen WB, Collins LM. Group comparability: A multiattribute utility measurement approach to the use of random assignment with small numbers of aggregated units. Evaluation Review. 1984;8(2):247–260. [Google Scholar]
- Harrington M, Babbin SF, Redding C, Burditt C, Paiva A, Meier K, et al. Psychometric assessment of the temptations to try alcohol scale. Addictive Behaviors. 2011;36:431–433. doi: 10.1016/j.addbeh.2010.12.019. [DOI] [PMC free article] [PubMed] [Google Scholar]
- Hollis JF, Polen MR, Whitlock EP, Lichtenstein E, Mullooly JP, Velicer WF, et al. Teen reach: Outcomes from a randomized, controlled trial of a tobacco reduction program for teens seen in primary medical care. Pediatrics. 2005;115(4):981–989. doi: 10.1542/peds.2004-0981. [DOI] [PubMed] [Google Scholar]
- Johnston LD, O’Malley PM, Bachman JG, Schulenberg JE. Bethesda. National Institute on Drug Abuse; MD: 2009. Monitoring the future: National survey results on drug use, 1975–2008: Volume I, secondary school students (NIH publication no. 09-7402) [Google Scholar]
- Krebs P, Prochaska JO, Rossi JS. A meta-analysis of computer-tailored interventions for health behavior change. Preventive Medicine. 2010;51(3):214–221. doi: 10.1016/j.ypmed.2010.06.004. [DOI] [PMC free article] [PubMed] [Google Scholar]
- Lathrop RG, Williams JE. The reliability of inverse scree tests for cluster analysis. Educational and Psychological Measurement. 1987;47(4):953–959. [Google Scholar]
- McGee HA, Babbin SF, Redding C, Pavia A, Oatley K, Meier K, et al. Prevention of smoking in middle school students: Psychometric assessment of the temptations to try smoking scale. Addictive Behaviors. 2012;37:521–523. doi: 10.1016/j.addbeh.2011.11.013. [DOI] [PMC free article] [PubMed] [Google Scholar]
- McGee HA, Brick L, Babbin S, Pavia A, Redding C, Oatley K, et al. Psychometric assessment of the decisional balance inventory for smoking prevention in middle school students (abstract) Annals of Behavioral Medicine. 2011;41(S1):s213. [Google Scholar]
- Noar SM, Benac CN, Harris MS. Does tailoring matter? Meta-analytic review of tailored print health behavior change interventions. Psychological Bulletin. 2007;133(4):673–693. doi: 10.1037/0033-2909.133.4.673. [DOI] [PubMed] [Google Scholar]
- Norman GJ, Velicer WF, Fava JL, Prochaska JO. Cluster subtypes within stage of change in a representative sample of smokers. Addictive Behaviors. 2000;25(2):183–204. doi: 10.1016/s0306-4603(99)00054-4. [DOI] [PubMed] [Google Scholar]
- Pallonen UE, Prochaska JO, Velicer WF, Prokhorov AV, Smith NF. Stages of acquisition and cessation for adolescent smoking: An empirical integration. Addictive Behaviors. 1998;23(3):303–324. doi: 10.1016/s0306-4603(97)00074-9. [DOI] [PubMed] [Google Scholar]
- Plummer BA, Velicer WF, Redding CA, Prochaska JO, Rossi JS, Pallonen UE, et al. Stage of change, decisional balance, and temptations for smoking: Measurement and validation in a large, school-based population of adolescents. Addictive Behaviors. 2001;26(4):551–571. doi: 10.1016/s0306-4603(00)00144-1. [DOI] [PubMed] [Google Scholar]
- Prochaska JO, Velicer WF, DiClemente CC, Fava JL. Measuring the processes of change: Applications to the cessation of smoking. Journal of Consulting and Clinical Psychology. 1988;56:520–528. doi: 10.1037//0022-006x.56.4.520. [DOI] [PubMed] [Google Scholar]
- Schwinn TM, Schinke SP. Preventing alcohol use among late adolescent urban youth: 6-year results from a computer-based intervention. Journal of Studies on Alcohol and Drugs. 2010;71(4):535–538. doi: 10.15288/jsad.2010.71.535. [DOI] [PMC free article] [PubMed] [Google Scholar]
- Spencer L, Pagell F, Hallion ME, Adams TB. Applying the transtheoretical model to tobacco cessation and prevention: A review of literature. American Journal of Health Promotion. 2002;17(1):7–71. doi: 10.4278/0890-1171-17.1.7. [DOI] [PubMed] [Google Scholar]
- Sussman S. Effects of sixty six adolescent tobacco use cessation trials and seventeen prospective studies of self-initiated quitting. Tobacco Induced Diseases. 2002;1(1):35–81. doi: 10.1186/1617-9625-1-1-35. [DOI] [PMC free article] [PubMed] [Google Scholar]
- U.S. Department of Health and Human Services . US Department of Health and Human Services, Centers for Disease Control and Prevention, National Center for Chronic Disease Prevention and Health Promotion, Office on Smoking and Health; Atlanta, GA: 2012. Preventing tobacco use among youth and young adults: A report of the surgeon general. [Google Scholar]
- Velicer WF, DiClemente CC, Prochaska JO, Brandenburg N. Decisional balance measure for assessing and predicting smoking status. Journal of Personality and Social Psychology. 1985;48(5):1279–1289. doi: 10.1037//0022-3514.48.5.1279. [DOI] [PubMed] [Google Scholar]
- Velicer WF, DiClemente C, Rossi JS, Prochaska JO. Relapse situations and self-efficacy: An integrative model. Addictive Behaviors. 1990;15:271–283. doi: 10.1016/0306-4603(90)90070-e. [DOI] [PubMed] [Google Scholar]
- Velicer WF, Hughes SL, Fava JL, Prochaska JO, DiClemente CC. An empirical typology of subjects within stage of change. Addictive Behaviors. 1995;20(3):299–320. doi: 10.1016/0306-4603(94)00069-b. [DOI] [PubMed] [Google Scholar]
- Velicer WF, Redding CA, Anatchkova MD, Fava JL, Prochaska JO. Identifying cluster subtypes for the prevention of adolescent smoking acquisition. Addictive Behaviors. 2007;32(2):228–247. doi: 10.1016/j.addbeh.2006.03.041. [DOI] [PubMed] [Google Scholar]
- Velicer WF, Redding CA, Paiva AL, Mauriello LM, Blissmer B, Oatley K, et al. Multiple behavior interventions to prevent substance abuse and increase energy balance behaviors in middle school students. Translational Behavioral Medicine: Practice, Policy, Research. 2013;3(1):82–93. doi: 10.1007/s13142-013-0197-0. [DOI] [PMC free article] [PubMed] [Google Scholar]
- Ward JH. Hierarchical grouping to optimize an objective function. Journal of the American statistical association. 1963;58(301):236–244. [Google Scholar]


