Abstract
Cochlear implantation is a procedure performed to treat profound hearing loss. Accurately determining the postoperative position of the implant in vivo would permit studying the correlations between implant position and hearing restoration. To solve this problem, we present an approach based on parametric Gradient Vector Flow snakes to segment the electrode array in post-operative CT. By combining this with existing methods for localizing intra-cochlear anatomy, we have developed a system that permits accurate assessment of the implant position in vivo. The system is validated using a set of seven temporal bone specimens. The algorithms were run on pre- and post-operative CTs of the specimens, and the results were compared to histological images. It was found that the position of the arrays observed in the histological images is in excellent agreement with the position of their automatically generated 3D reconstructions in the CT scans.
Keywords: Cochlear Implant, Snake Segmentation, Contour Advance
1. INTRODUCTION
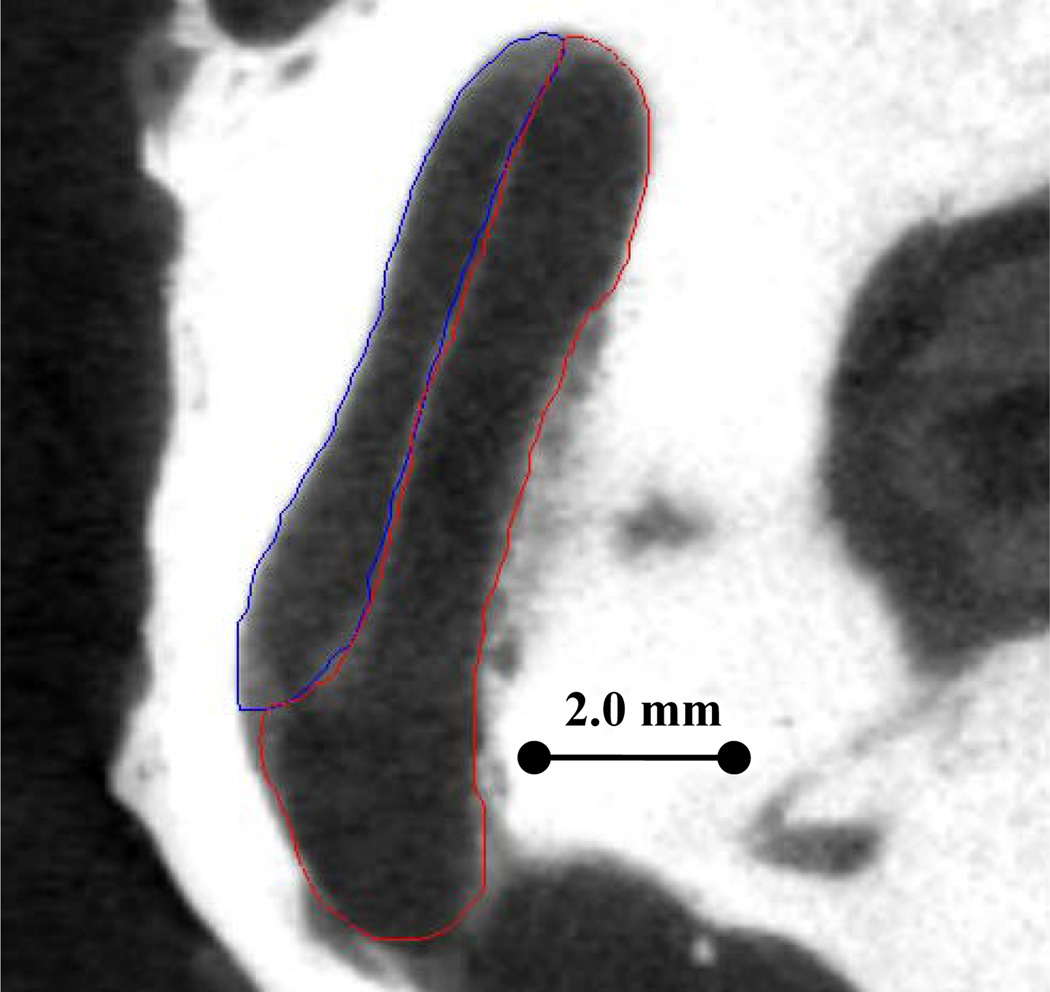
Cochlear implantation is a procedure performed to treat profound hearing loss. In surgery, an electrode array is inserted into the cochlea. After recovery, the electrodes are used to stimulate the auditory nerve, inducing the sensation of hearing. The cochlea contains several internal cavities, the two principal ones being the scala tympani and scala vestibuli (see Figure 1). The optimal positioning of the electrode array is still an open question, but some research has suggested that insertion of the array into the scala tympani can lead to better hearing restoration [1]. Another study has indicated that scala tympani insertion is only achievable in up to 75% of implantations with a select population of electrodes [2]. Until recently, determining intra-cochlear electrode position in vivo has only been done using a rigid model of the cochlea [1,2]. However, research has shown that there are substantial non-rigid variations in intra-cochlear anatomy [3]. Thus, unless a more accurate model of intra-cochlear anatomy that recovers non-rigid variations is used, accurately correlating procedure outcome and electrode position can only be done through postmortem histological analysis, which severely limits the number of samples on which such a study can be conducted.
Figure 1.
µCT of a cadaveric cochlea in axial view. Delineated are Scala Tympani (red) and Scala Vestibuli (blue).
To solve these problems, we have devised a fast, automatic approach to determine the intra-cochlear position of the implant using CT. The algorithms require only a conventional pre-operative CT, such as one that is typically acquired prior to cochlear implantation, and a post-operative CT, of which image quality is not as important. In fact, we achieve good results using flat-panel volumetric CT (fpvCT), which only administers about one quarter the dose of radiation compared to that of a conventional CT. Thus, the position of the implant can be assessed in vivo, requiring only one extra CT that is of low radiation dose. This is of significance, because information about the location of the electrode would permit correlating placement and hearing restoration. It could also be used to give surgeons technical feedback and to aid implant programming, ultimately helping to better restore the patient’s hearing.
Determining the intra-scalar position of the implant requires locating the electrode, as well as the scala tympani and scala vestibuli. Although finding the scalae in CT is not a straightforward task, we have previously presented and validated very accurate methods to accomplish this in pre-operative CT [3]. Note that it is currently not feasible to locate the scalae in post-operative imaging due to the artifact introduced by the metallic electrodes. Since methods exist to locate the scalae in preoperative CT, the focus of this paper is to present a robust algorithm for locating the position of the electrode in post-operative CT.
Algorithm 1.
Method for Localizing Electrode Arrays
| Initialize: |
| Project curve from atlas to target via non-rigid transformation |
| Iterate Until Convergence: |
| Update curve by solving Eqn. (7) |
| Resample curve points |
| Finalize: |
| Update curve by solving Eqn. (10) |
| Resample curve points |
| Project surface onto curve using thin-plate splines |
The approach can be summarized as follows. The scalae are segmented in the preoperative CT using the methods proposed in [3]. Next, the post-operative CT is rigidly registered to the preoperative CT, giving us a very accurate localization of the scalae in the post-operative image. We then localize the electrode using techniques based on parametric Gradient Vector Flow (GVF) snakes [4,5]. These electrode segmentation techniques are detailed in this paper.
2. METHODS
The algorithm to be presented is summarized in pseudocode (Algorithm 1). The following sections detail this approach.
2.1 Segmentation Model
The electrode is modeled as a set of points representing the centerline of the array. Once these centerline points are matched to the metallic artifact in the image, a model of the array surface can be projected onto the centerline to get an accurate representation of the electrode location. This article focuses on the use of the Cochlear™ Contour Advance® electrode array, but the method is applicable to many types of electrodes simply by changing the centerline model and the surface model of the array itself. The Cochlear array and the centerline model are shown in Figure 2. The placement of centerline points with respect to the array is somewhat arbitrary, but as a matter of convenience, the points in the model were chosen such that each electrode in the array is aligned with a point. Points are also placed along the array prior to the contact position in a few locations. The non-contact region is included in the model because the entry point to the cochlea usually lies in this region. Throughout the segmentation process, the centerline is restricted such that it is composed of this set of points separated by the distances as shown in the array model.
Figure 2.

Model of the Cochlear Contour Advance electrode array. Shown are the surface model (top), the corresponding curve points (middle), and the distances in mm between curve points (bottom).
2.2 Initialization
To initialize the iterative segmentation approach, a reasonable initial placement of the centerline model in the target image must be found. We chose to use image registration to initialize the segmentation with an atlas-based approach. Prior to electrode segmentation, the scalae are segmented with a process that is initialized using registration between an “atlas” CT and the target pre-operative CT [3]. The registration scheme used is an affine, followed by a non-rigid registration process. Affine transformations are computed by optimizing translation, rotation, scaling, and skew parameters using Powell’s direction set method and Brent’s line search algorithms [9]. Mutual information is the similarity measure that is maximized and is computed between images X and Y using the equation
| (1) |
where H(․) is the Shannon entropy of an image, and H(․, ․) is the joint entropy between the images [7]. An estimation of the entropy in an image can be computed as:
| (2) |
where p(k) is the intensity probability density function and is estimated using histograms with 64 bins.
Non-rigid image registration is performed using the adaptive bases algorithm [6]. This algorithm models the deformation field that registers the two images as a linear combination of radial basis functions with finite support
| (3) |
where x⃗ is a coordinate vector, Φ is one of Wu’s compactly supported positive radial basis functions [10], and the c⃗l’s are the coefficients on the basis functions. The c⃗l’s that maximize the normalized mutual information [11] between the images are computed using a steepest gradient descent and line minimization optimization approach. The direction of optimization is determined using the steepest gradient computation, and the optimal step in that direction is found using the line minimization calculation. The algorithm is applied using a multi-scale and multi-resolution approach. The algorithm begins optimization on a low-resolution image with few basis functions each having large support. The image resolution is then increased and the number and support of the basis function is decreased. This leads to transformations that become more local as the algorithm progresses.
To obtain a non-rigid transformation between the atlas and target cochleae, first, an affine transformation is computed between the full head images. This is followed by local affine, then non-rigid registrations over the region surrounding the cochlea. A non-rigid transformation between the same atlas CT and the post-operative CT is achieved by combining this compound non-rigid transformation between the atlas and pre-operative CT with the rigid transformation that registers the pre- and post-operative CT. This registration approach is much more effective than directly registering the atlas to the post-operative CT, because accurate non-rigid registration of the cochlea would not be possible due to the strong metallic artifact in the post-operative CT. The rigid transformation between pre- and post-operative CTs can be computed using the affine registration process described above while constraining the transformation to be rigid by optimizing only the translation and rotation parameters.
A curve was manually defined in the atlas image at a position that is typical for a cochlear implant. To initialize the segmentation, this permanently defined curve is projected onto the target post-operative CT via the non-rigid transformation, providing a rough estimation of the implant position.
2.3 Locating the Centerline of the Array
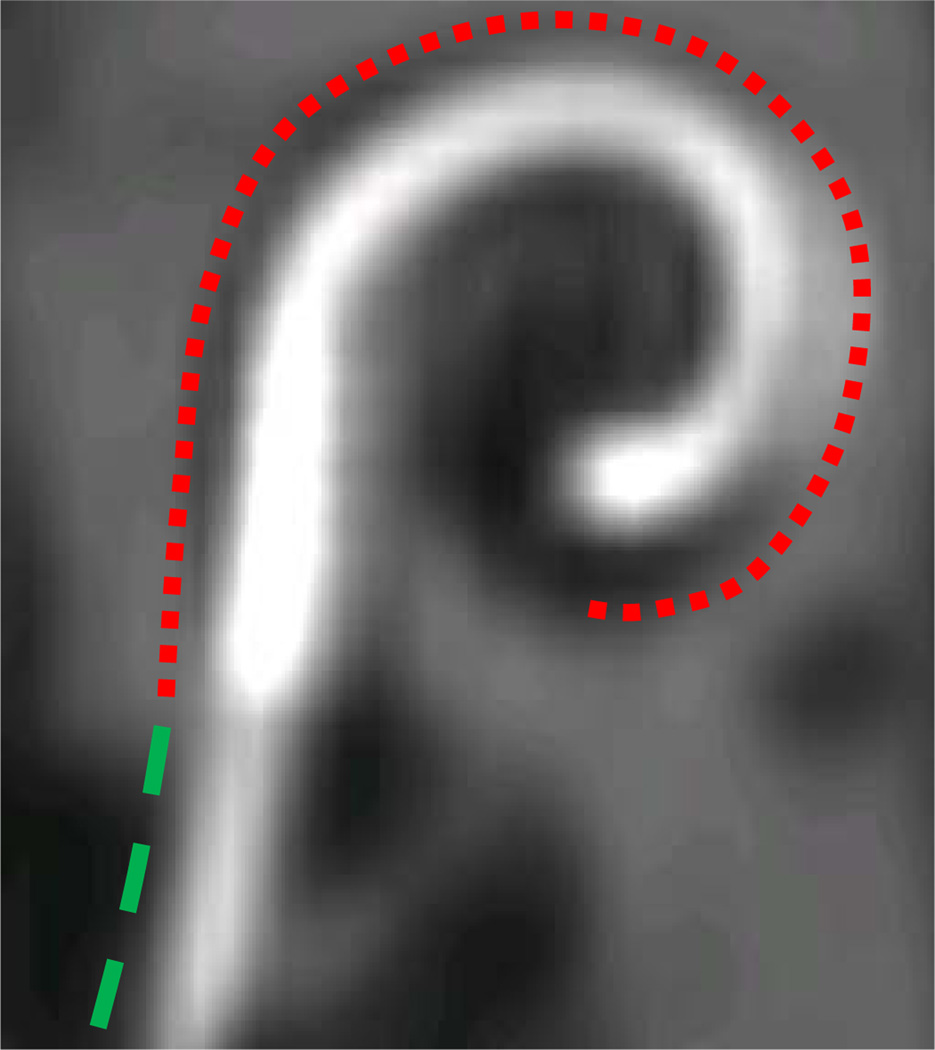
The electrode array produces a metallic artifact in CT that is much brighter than surrounding anatomical structures (see Figure 3). The medial axis of the artifact should correspond to the centerline of the electrode array. Thus, the next step in the algorithm we have developed is a process to localize the centerline of the metallic artifact in the image. Once the curve is initialized, tracking the centerline of the artifact is achieved by minimizing the energy equation
| (4) |
which is the standard snake energy equation. v(s) is the position of the parameterized curve at s, w1 and w2 are tension and rigidity weighting terms, and Eext is the external energy term. Following the traditional formulation, a curve that minimizes E satisfies the corresponding Euler-Lagrange equation
| (5) |
Figure 3.
Implanted electrode array. Curves are used to indicate the electrode contact region (red) and non-contact region (green).
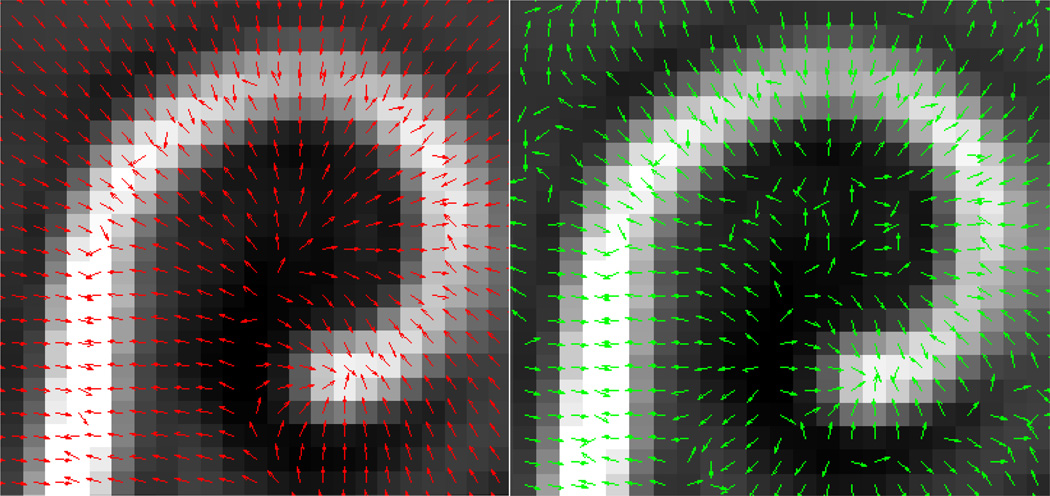
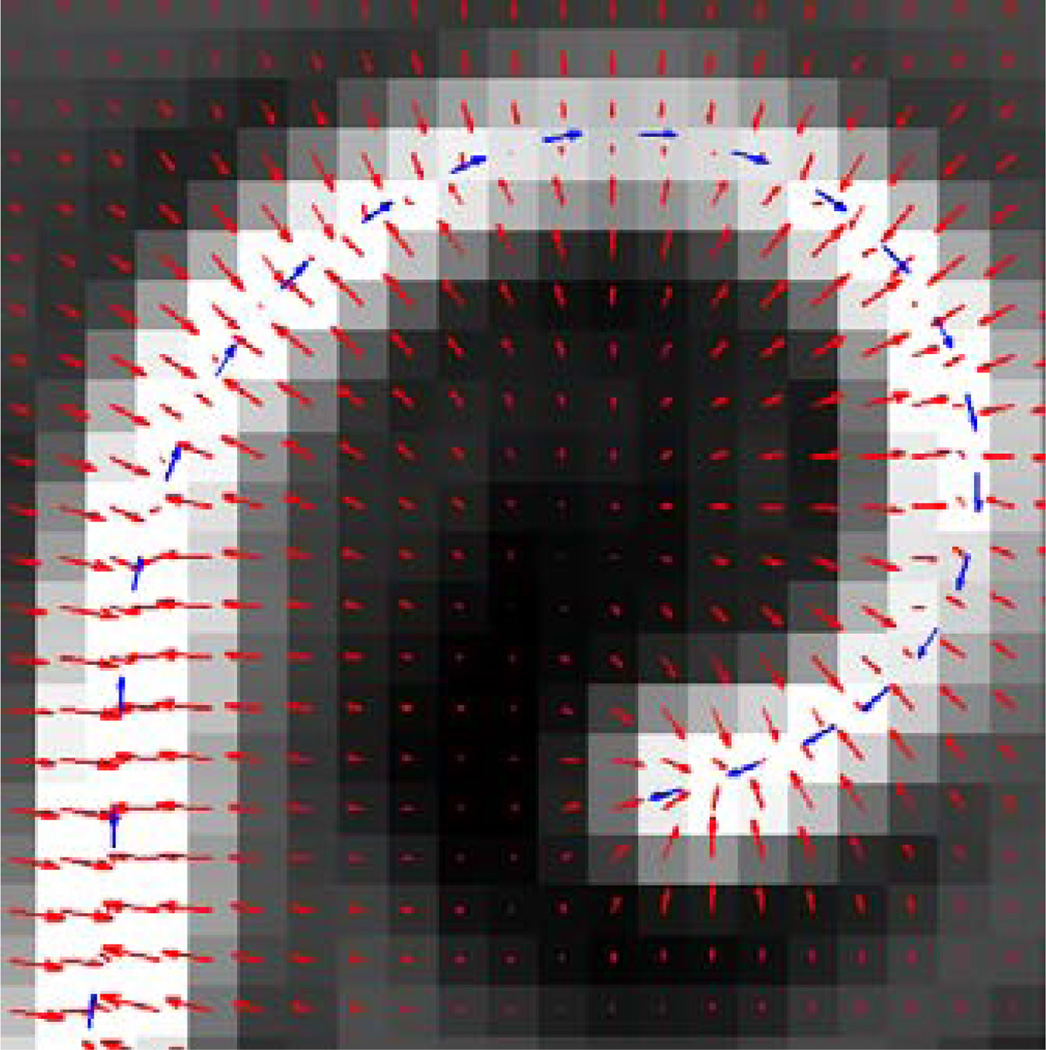
As can be seen in Figure 3, the metallic artifact in the image is much brighter than any anatomical structure. We therefore derive an external energy that will attract the model to the bright regions of the image. One approach would be to use the intensity gradient of the image as the external force. An example of this is shown in the right panel of Figure 4. In the figure, normalized gradient vectors are overlaid on the image to show the direction of the gradient force throughout the image. The gradient vectors point towards the centerline in a very local region around the array. But, a few voxels away from the array, the gradient vectors point in various directions. Thus, this force will result in a snake with a very limited capture range. This limited capture range led us to a solution based on Gradient Vector Flow (GVF). GVF has been found to be a very robust attraction force for snake-like segmentation models. The algorithm produces a field of vectors over the range of the image that point towards bright regions with very nice field properties. In the original paper, GVF was applied to gradient magnitude images; here it can be applied to the image itself. The field is computed by minimizing an energy functional that favors the gradient vectors where the image gradient is strong and favors spatially smooth variation of neighboring vectors in homogeneous regions of the image. The resulting optimization process effectively diffuses the gradient vectors from bright regions throughout the image using equations identical to those that describe heat conduction. A normalized gradient vector flow vector field is shown in the left panel of Figure 4 to show the direction of GVF vectors throughout the image. The vectors clearly point towards the array over a much larger range than the intensity gradient vector field. An example of a GVF vector field with properly scaled vectors is shown in Figure 5. As can be seen from the figure, GVF produces a smoothly varying vector field that points towards the centerline of the metallic artifact in the image with stronger vectors closer to the centerline.
Figure 4.
Normalized vector fields produced by GVF (left) and standard gradient computations (right).
Figure 5.
Example of GVF field (red arrows) and forward force (blue arrows).
The GVF force alone is not enough to ensure accurate results. A large portion of the implant lead in which we are not interested extends laterally beyond the contact region into the non-contact region and also produces bright metallic artifact in the image (see Figure 3). Thus, the GVF vector field will point toward the contact region as well as the rest of the lead. To ensure that the electrode model is attracted to this electrode contact region, another force must be introduced. Akin to the balloon force introduced by Cohen and Cohen [8], we introduce a “forward” force, which has the effect of pushing the curve forward. Therefore we define the external force as
| (6) |
where f⃗ is the GVF field and w3 is a weighting parameter on the forward force that scales the length of the forward force vector. The v′ term defines the direction of the forward force, such that the curve is pushed forward in the direction of its derivative. Example forward force vectors are shown in Figure 5.
A solution to Eqn. (5) can be approximated by applying finite differences and switching to a discrete, time-varying, iterative formulation. Taking into account a time-step equal to 1, Eqn. (5) is satisfied by solving
| (7) |
Eqn. (7) is solved iteratively for , where the terms weighted by w1 and w2 are approximations of v″(s) and v‴′(s) and are the standard finite difference formulation. v̂′(s) is approximated by the term weighted by w3, which is a finite difference approximation of the curve derivative. In practice, this is solved easily using well-known linear system solvers. The first conditional in Eqn. (7) is applied to all the curve points where boundary conditions are not an issue. Central differences are used to approximate all derivatives. The second equation is applied to the points adjacent to the endpoints. Here, the rigidity term, v‴′(s) is removed. This is done because a central difference approximation is not possible, and the forward and reverse approximations are not well-behaved. The last two conditional equations apply to the endpoints. Again, there is no rigidity term. The v″(s) tension term is also removed, and is replaced with a linear extrapolation-based smoothing term. The direction of linear extrapolation is the negative of the non-central finite difference approximation of v″(s), which is not well-behaved for this open-curve snake model. The curve derivative is approximated with forward and reverse differences. w1 and w2, the tension and rigidity weightings, are chosen to be constant values of 0.1 and 0.05. The forward force weighting w3 is treated as a function of time and is equal to
| (8) |
This is a piecewise-linear, continuous function of t, such that when the curve is initially evolving, the forward energy has very little influence and the curve evolves toward the center of the artifact. The forward energy weighting increases over time and reaches a maximum of 0.15 well after the curve should be on the artifact centerline. All weighting values were chosen experimentally.
This time varying formulation is used in an iterative process to accurately locate the centerline of the metallic artifact. At each iteration, Eqn. (7) is solved and the curve is resampled. The re-sampling process is applied to ensure that the distances between points are maintained as specified by the model (see Figure 2). To re-sample the curve, the tip point is treated as fixed, and the remaining curve points are sequentially re-sampled from the electrode tip point toward the lead. When necessary the lead points are defined using linear extrapolation. Repeating this iterative curve update and re-sampling process until convergence produces a very accurate estimation of the artifact centerline.
2.4 Centerline Adjustment
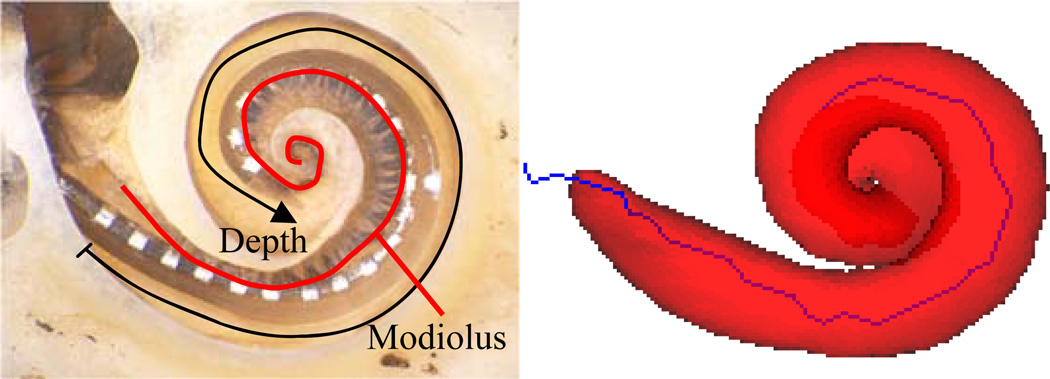
Experiments have shown that the position of the centerline of the metallic artifact in CT does not exactly agree with the position of the centerline of the array in histological imaging (see Figure 6). In fact, the metallic artifact is located further laterally in the cochlea and also appears to terminate at a cochlear depth prior to the actual tip of the electrode. Work is currently being done to understand this phenomenon; however, for the purposes of segmentation, we can employ one further step to make our centerline more accurate with respect to the true anatomical location. In this adjustment step we include another term that moves the centerline towards the medial wall of the cochlea, and we increase the strength of the forward force. This step is performed by solving
| (9) |
where n̂ is a vector normal to the curve that points toward the medial wall of the cochlea, w4 is a distance weighting on the forward force set equal to 0.35, and w5 is a distance weighting on the normal vector set to 0.15. Both weightings were chosen experimentally.
Figure 6.
Histological image (left) and CT reconstruction (right) of cochlear implant. The manually localized artifact centerline from CT (blue line) seen in the Scala Tympani (red surface) is distinctly different from actual electrode position in histological image.
2.5 Electrode Array Surface Reconstruction
To finish the segmentation, the electrode array surface must be reconstructed around the extracted centerline. To do this, a thin-plate spline (TPS) transformation is used [9]. This is a non-rigid transformation that is computed by matching two corresponding point-sets. The first point-set is extracted by acquiring points in cylinder patterns around each point along the extracted centerline curve, where the cylinders are chosen to be identical in radius to the array. This point set is matched to points acquired in the same cylinder pattern around the corresponding centerline points in the electrode surface model. Cylindrical point-sets are used, rather than just the centerline points, because (1) a TPS transformation between points in a 3D space and points in a straight line is ill-conditioned, and (2) matching cylinders that are identical in radius to the electrode array will lead to a TPS that includes the entire electrode array within the interpolating region of the transformation. This is desirable because non-rigid transformations, like those based on TPS, are generally much more accurate and well-behaved in the interpolation, rather than the extrapolation, regions. To reconstruct the array surface, the electrode surface model is passed through the TPS-based transformation that is defined by the two point-sets.
2.6 Validation
To validate the localization of the centerline of the artifact, automatic localization results are compared to the centerlines of manual segmentations of the electrode artifact using seven specimens. Pre- and post-operative CTs (Xoran XCAT fpvCT with voxel size 0.3×0.3×0.3 mm3) were acquired for each specimen, and the proposed reconstruction approach was carried out using these CTs. After the software is executed, each electrode artifact localization was validated by measuring the closest distance between the automatic curve and the manual segmentation centerline.
Next, the centerline adjustment procedure is used to identify the position of the array in CT that matches the true position of the array as seen in histological images, so that it can be used for accurate qualitative assessment of electrode position. As such, we validate the surface reconstruction through qualitative assessment. The important properties of the array position that we would like to measure include the depth (see Figure 5), the cavity in which each contact is located, and the proximity to the modiolus of each contact (also shown in Figure 5). We qualitatively measure these three quantities by examining the histological images and the automatic reconstructions independently, and then compare the two results.
3. RESULTS
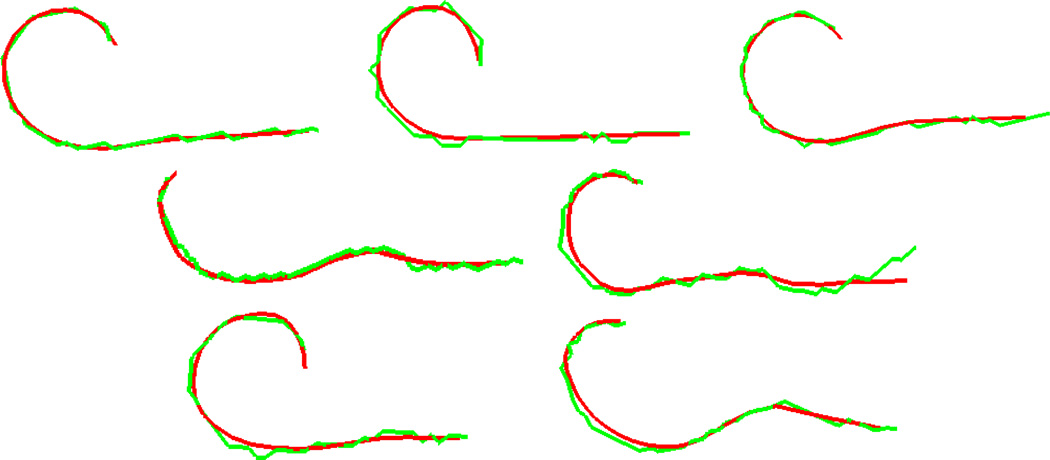
All algorithms were implemented in C++. The whole process of localizing the scalae and electrode array takes approximately 3 minutes on a Windows Server-based machine with dual 2.6 GHz Intel Xeon processors. Mean and max error results for the localization of the artifact centerline are shown in Table 1. It can be seen that all mean errors are under 0.3 mm (under 1 voxel’s width), and that the maximum error is less than 0.9 mm (under 3 voxel’s width). Renderings of these results are shown in Figure 7. All results appear qualitatively accurate.
Table 1.
Quantitative electrode artifact localization results.
| Experiment | 1 | 2 | 3 | 4 | 5 | 6 | 7 | Overall Stats. |
|---|---|---|---|---|---|---|---|---|
| Mean Err (mm) | 0.157 | 0.185 | 0.182 | 0.190 | 0.235 | 0.203 | 0.214 | 0.195 |
| Max Err (mm) | 0.436 | 0.330 | 0.548 | 0.365 | 0.826 | 0.722 | 0.345 | 0.826 |
Figure 7.
Renderings of electrode artifact localization results. Shown are the automatic (red) and manually (green) localized curves for experiments 1–7 (left-to-right, top-to-bottom).
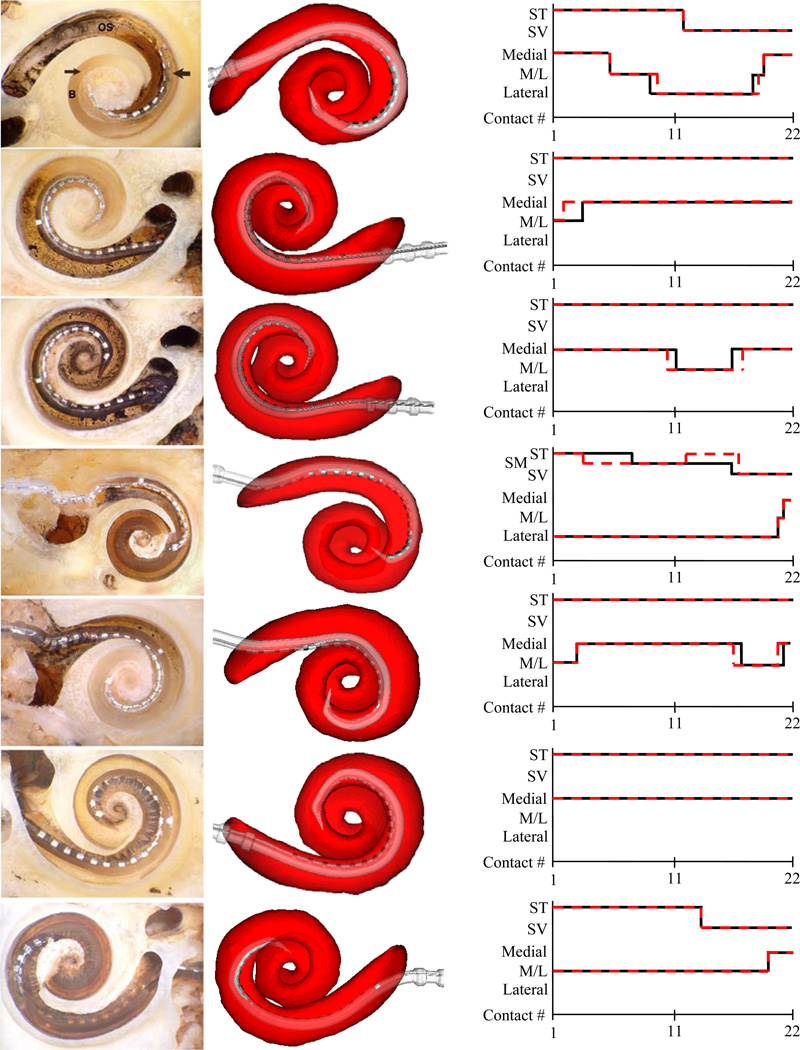
Surface reconstruction results of the experiments are shown in Figure 8. In the figure, histological images can be seen in the left column. In the middle column are 3D renderings of the automatic reconstruction results. The scala tympani is rendered transparently in red to allow visualization of the relative position of the array. The cavity in which each contact is positioned and the modiolar proximity are assessed first by qualitatively examining the histological images (results shown as black line in the graphs), and then by examining the automatic 3D reconstructions (results shown as red-dashed line). Each electrode is labeled as being positioned within the scala tympani (ST) or scala vestibuli (SV), or in the case of experiment 4, the scala media (SM). Experiment 4 is representative of a particularly traumatic insertion, where the array became partially lodged underneath both the scala tympani and vestibuli in the region known as scala media. Modiolar proximity is qualified as being Medial (modiolar hugging), Lateral (far from the modiolus), or M/L (between medial and lateral). As can be seen from the graph, there is excellent agreement between the histological and reconstruction based assessments. The errors in cochlear depth are shown in Table 2. This is the error in the cochlear depth of the tip electrode measured in terms of number of electrodes. This was measured using the following process: Let the deeper of histological or reconstruction based views of the array be labeled D and the shallower of the two views be A. The error in cochlear depth is equal to the number of electrodes in D that are implanted deeper than A. As can be seen from the table, the worst disagreement in depth estimation is two electrodes, and several experiments result in perfect agreement.
Figure 8.
Renderings of array reconstruction results. Shown are the histological image (left), automatic reconstruction (middle) and graphs of the electrode position assessment based on histology (black lines) and automatic reconstruction (red dashed lines) for experiments 1–7 (top-to-bottom).
Table 2.
Depth error of array surface reconstructions. Error is reported in number of electrodes.
| Experiment # | 1 | 2 | 3 | 4 | 5 | 6 | 7 |
|---|---|---|---|---|---|---|---|
| Depth Error | 1 | 0 | 1 | 0 | 2 | 1 | 0 |
4. CONCLUSIONS
This work presents the first method for determining the position of a cochlear implant electrode array in vivo that takes advantage of non-rigid models to produce highly accurate patient-specific reconstructions of cochlear anatomy. The methods employed for localizing the scalae have been shown in [3] to produce the most accurate patient-specific reconstructions of cochlear anatomy to date. Thus, the level of accuracy achievable with the proposed approach exceeds other approaches that rely on a rigid model of cochlear anatomy [1] or approaches that rely purely on an expert’s visual assessment [2]. To the best of our knowledge, this work also presents the first approach for automatically segmenting, and generating a realistic 3D reconstruction of a cochlear implant array, which allows the position of the array to be easily assessed in an interactive 3D rendering environment. To validate these results, assessment of electrode position was conducted using the proposed approach and by examining histological results independently. This validation study has shown that our reconstructions are accurate, and thus could be useful in several applications.
The approach required manually tuning five weighting values. Two of these parameters, w4 and w5, assign lengths to the forward and normal forces of the centerline adjustment step. Choosing these values was accomplished simply by measuring the average disparities between the artifact position in CT and the array position in histological images. The other three parameters required tuning by observing the behavior of the algorithm on the testing volumes. Future work will include studying the sensitivity of the approach to the choice of parameters, as well as to explain the apparent disparity between the position of metallic artifact in CT and the histological assessment of electrode position.
Using the proposed approach to assess electrode positioning in live subjects, researchers will be able to correlate hearing restoration with data such as depth of insertion, in which cavity each contact is placed, and the modiolar proximity of each contact with a high degree of accuracy. Since the approach only requires an additional low dose CT, it should be possible to assess implant position, and establish correlation with hearing restoration, using a large number of patients.
ACKNOWLEDGMENTS
This work was supported by NIH grants R01EB006193 from the National Institute of Biomedical Imaging and Bioengineering, and F31DC009791 and R01DC008408 from the National Institute of Deafness and Other Communication Disorders. The content is solely the responsibility of the authors and does not necessarily represent the official views of these institutes.
REFERENCES
- 1.Skinner MW, Holden TA, Whiting BR, et al. In vivo estimates of the position of advanced bionics electrode arrays in the human cochlea. Ann Otol Rhinol Laryngol Suppl. 2007 Apr;197:2–24. [PubMed] [Google Scholar]
- 2.Aschendorff A, Kromeier J, Klenzner T, Laszig R. Quality Control After Insertion of the Nucleus Contour and Contour Advance Electrode in Adults. Ear & Hearing. 2007 Apr;28:75S–79S. doi: 10.1097/AUD.0b013e318031542e. [DOI] [PubMed] [Google Scholar]
- 3.Noble JH, Rutherford RB, Labadie RF, Majdani O, Dawant BM. Modeling and segmentation of intra-cochlear anatomy in conventional CT. Proceedings of the SPIE – Medical Imaging 2010: Image Processing. :762302. [Google Scholar]
- 4.Xu C, Prince JL. Snakes, shapes, and gradient vector flow. IEEE Trans. on Image Processing. 1998;7(3):259–269. doi: 10.1109/83.661186. [DOI] [PubMed] [Google Scholar]
- 5.Kass M, Witkin A, Terzopoulos D. Snakes: Active Contour Models. Int’l Jour. Of Computer Vision. 1988:321–331. [Google Scholar]
- 6.Rohde GK, Aldroubi A, Dawant BM. The adaptive bases algorithm for intensity-based nonrigid image registration. IEEE Trans. Med. Imag. 2003;22:1470–1479. doi: 10.1109/TMI.2003.819299. [DOI] [PubMed] [Google Scholar]
- 7.Maes F, Collignon A, Vandermeulen D, Marchal G, Suetens P. Multimodality image registration by maximization of mutual information. IEEE Trans Med Imag. 1997;16:187–198. doi: 10.1109/42.563664. [DOI] [PubMed] [Google Scholar]
- 8.Cohen L, Cohen I. Finite-Element Methods for Active Contour Models and Balloons for 2-D and 3-D Images. IEEE Trans on Patt. Anal. And Mach. Intel. 1993;15(11):1131–1147. [Google Scholar]
- 9.Press WH, Flannery BP, Teukolsky SA, Vetterling WT. Numerical Recipes in C. 2nd ed. ch. 10. Cambridge, U. K.: Cambridge Univ. Press; 1992. pp. 412–419. [Google Scholar]
- 10.Wu Z. Multivariate compactly supported positive definite radial functions. Adv. Comput. Math. 1995;4:283–292. [Google Scholar]
- 11.Studholme C, Hill DLG, Hawkes DJ. An overlap invariant entropy measure of 3D medical image alignment. Pattern Recognition. 1999;32(1):71–86. [Google Scholar]


