

Article first published online 21 April 2015.
Supplemental Digital Content is Available in the Text.
Key Words: inflammatory bowel disease, ulcerative colitis, Crohn's disease, gene expression, pathways analysis
Abstract
Background:
Ulcerative colitis (UC) and Crohn's disease (CD) share some pathogenetic features. To provide new steps on the role of altered gene expression, and the involvement of gene networks, in the pathogenesis of these diseases, we performed a genome-wide analysis in 15 patients with CD and 14 patients with UC by comparing the RNA from inflamed and noninflamed colonic mucosa.
Methods:
Two hundred ninety-eight differentially expressed genes in CD and 520 genes in UC were identified. By bioinformatic analyses, 34 pathways for CD, 6 of them enriched in noninflamed and 28 in inflamed tissues, and 19 pathways for UC, 17 in noninflamed and 2 in inflamed tissues, were also highlighted.
Results:
In CD, the pathways included genes associated with cytokines and cytokine receptors connection, response to external stimuli, activation of cell proliferation or differentiation, cell migration, apoptosis, and immune regulation. In UC, the pathways were associated with genes related to metabolic and catabolic processes, biosynthesis and interconversion processes, leukocyte migration, regulation of cell proliferation, and epithelial-to-mesenchymal transition.
Conclusions:
In UC, the pattern of inflammation of colonic mucosa is due to a complex interaction network between host, gut microbiome, and diet, suggesting that bacterial products or endogenous synthetic/catabolic molecules contribute to impairment of the immune response, to breakdown of epithelial barrier, and to enhance the inflammatory process. In patients with CD, genes encoding a large variety of proteins, growth factors, cytokines, chemokines, and adhesion molecules may lead to uncontrolled inflammation with ensuing destruction of epithelial cells, inappropriate stimulation of antimicrobial and T cells differentiation, and inflammasome events.
Ulcerative colitis (UC) and Crohn's disease (CD) represent the 2 main forms of inflammatory bowel disease (IBD). Although these disorders share similar clinical and pathological features, their clinical picture is heterogeneous.1 Currently, pathogenetic models emphasize complex interactions between environmental factors and promoting/modifying genetic determinants, ensuing in the clinical expression of each of the 2 diseases.2 Recently, a meta-analysis of genome-wide association studies identified 163 definite IBD susceptibility loci (23 associated with UC, 30 with CD, and 110 shared by both diseases).3 As previous UC and CD loci account for about one-quarter of disease heritability, the usefulness of these markers for risk prediction may be modest.4,5 However, the number of identified genes is likely to be underestimated, as the associations emerged from the genome-wide association studies do not identify the responsible gene(s) but simply “tag” a region containing 1 or more susceptibility genes. In most cases, the identification of susceptibility genes was featured by several in silico approaches, such as gene relationship across implicated loci (GRAIL), pathway analysis, and/or presence of an expression quantitative loci (eQTL) or nonsynonymous single-nucleotide polymorphisms.
When studying complex diseases, pathway analysis approaches are currently a main avenue of research, as they allow to analyze simultaneously several genes, all of them co-operating in a given cellular process or function.6–8 These approaches typically examine whether a group of related genes involved in a given functional pathway are jointly associated (i.e., enriched) with a trait of interest.9 We applied a novel and statistically well-founded pathway analysis that complements the classical single gene analysis and is able to highlight biologically relevant association signals. Enrichment pathway analysis offers several advantages for unveiling the molecular basis of complex diseases because (1) it provides highly reproducible results and (2) it is able to integrate weak association signals usually lost by the constraints imposed for managing multiple comparisons problems. In addition, messenger RNA expression profile using DNA microarrays allows a comprehensive picture of gene expression at the tissue level, helping to fully characterize the underlying pathophysiological processes.10 To date, studies using microarray platforms to probe gut specimens from patients with IBD have identified a number of novel genes differentially deregulated in inflamed tissue samples compared with noninflamed areas, or with tissues obtained from normal subjects.11–15
In the present study, we evaluated colonic mucosal specimens of either inflamed and adjacent non-inflamed gut areas of patients with IBD with the aims (1) to perform whole genome gene expression profiling using microarray and (2) to characterize altered genetic pathways in UC and CD.
METHODS
Patients Recruitment and Biopsies Selection
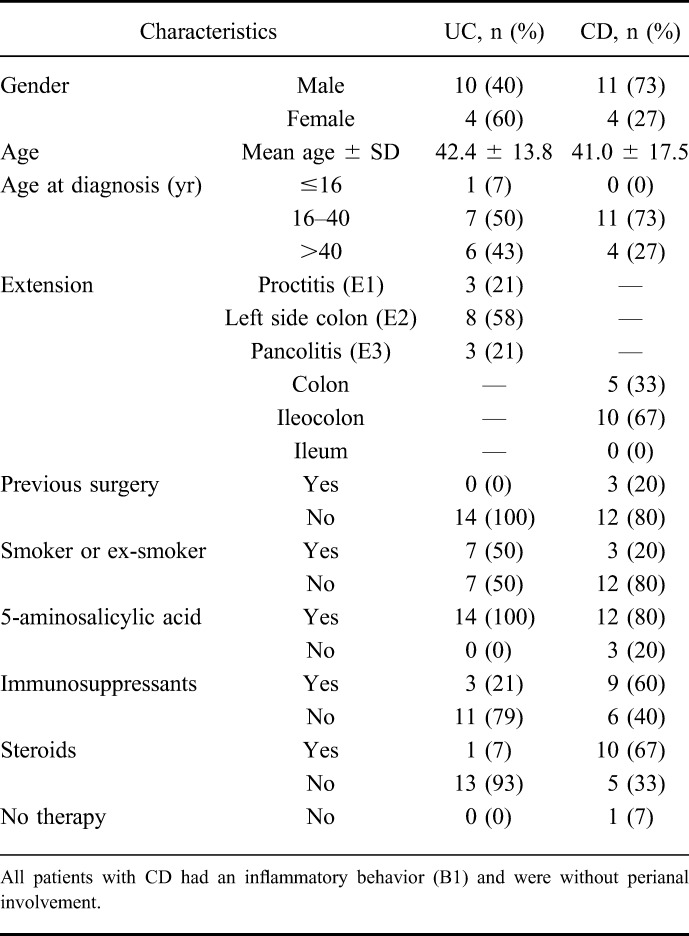
Twenty-nine patients with IBD (15 with CD and 14 with UC), diagnosed according to Lennard-Jones' criteria16 at the Division of Gastroenterology of the IRCCS “Casa Sollievo della Sofferenza” Hospital, San Giovanni Rotondo, Italy, were enrolled. The main inclusion criterion was an active flare of the disease, as defined by an Harvey–Bradshaw score >4 and a Mayo score >3, respectively. Their main clinical characteristics are summarized in Table 1. After a written informed consent, mucosal biopsies were sampled at inflamed and adjacent noninflamed areas of the colon. Unaffected areas were defined as mucosal regions without macroscopic/endoscopic sign of inflammation (e.g., discoloration, hemorrhagic appearance, edema, ulceration, or mucinous/fibrinous coating); these biopsies were obtained at least 30 cm distant from the inflamed area. To preserve the transcriptional profile, the specimens were rapidly transferred in RNAlater (Qiagen, Valencia, CA) or snap-frozen in liquid nitrogen. Total RNA was extracted from each biopsy using Trizol (Invitrogen, Paisley, United Kingdom) or RNeasy Mini Kit (Qiagen), according to the manufacturer's protocol. RNA was quantified using the NanoDrop ND-1000 spectrophotometer (NanoDrop Technologies, Wilmington, DE); RNA quality control was performed using Agilent 2100 Bioanalyzer (http://www.chem.agilent.com).
TABLE 1.
Demographic Characteristics and Clinical Features of CD and UC According to Montreal's Classification
Microarray Analysis
The GeneChip Human Gene 1.0 ST Array System (Affymetrix, Santa Clara, CA) was used, which interrogates 28,869 well-annotated genes by using an average of 26 probes per gene. Probes are designed to cover the full-length transcripts, unlike the 3′ focused arrays that contain probes targeting the transcript at its 3′ end. Probes on the array were perfect match only; mismatch probes found on the 3′ focused arrays have been replaced on the Gene Arrays with a set of approximately 20,000 generic background probes. The Gene 1.0 Array labeling protocol starts with 100 ng of total RNA (in a maximum volume of 3.0 µL). A random priming method is used to generate complementary DNA from all RNA transcripts present in a sample. The random primers incorporate a T7 promoter sequence that is subsequently used in an in vitro transcription to produce antisense complementary RNA fragments. Single-stranded complementary DNA complementary to the complementary RNA is then produced, that is, in the sense orientation, where a modified deoxyuridine triphosphate is incorporated instead of deoxythymidine triphosphate. The modified deoxyuridine triphosphate is subsequently recognized by the enzymes uracil-DNA glycosylase and human apurinic/apyrimidinic endonuclease 1, which will cut the DNA, resulting in fragmentation of the complementary DNA. Each DNA fragment is end-labeled with biotin using terminal deoxynucleotidyl transferase before being hybridized to the arrays for 16 hours at 45°C in a GeneChip hybridization Oven 640. Following hybridization and posthybridization washes, we scanned the arrays by using the Affymetrix GeneChip Scanner 3000 7G to generate the raw data (CEL file). The quality control steps of the experiment were performed by using the Expresssion Console (Affymetrix) software, whereas the statistical analysis was performed using Partek Genomic Suite (Partek, Inc., St. Louis, MO). Briefly, raw intensity values were imported by setting up robust multiarray analysis background correction, quartile normalization, and log transformation; Principal components analysis (PCA) was performed because it is an excellent method for visualizing high-dimensional data and underlie outliers samples; mixed model ANOVA was used to identify differentially expressed genes.
Statistical Analyses
Gene Sets
The database of gene sets used in this article was the Molecular Signatures Database (MSigDB),7 release v3.1, September 2012. This is a collection composed of curated gene sets based on high-throughput experiments and expert knowledge from literature or databases (BioCarta, Gene Arrays, BioScience Corp, KEGG, Reactome, Sigma-Aldrich Pathways, Signal Transduction Knowledge Environment, Signaling Gateway). In particular, for our analysis, we used 639 gene sets annotated in the canonical pathways category and 825 gene sets belonging to Biological Processes of Gene Ontology.
Single-gene Analysis
For determining the genes significantly associated to analyzed phenotypic differences, we studied genes singularly. To this end, the differential expression P-value was evaluated for each gene by a 2-tailed Student's t test and the P-values were controlled for multiple testing by using the Benjamini–Hochberg procedure. In particular, to control the expected proportion of incorrectly rejected null hypotheses, we evaluated the false discovery rate (FDR).17 Genes resulted differentially expressed with a P < 0.001 and FDR <0.05 were considered as associated to trait.
For the replication of the signals of genes selected on the basis of the association levels and literature data, a real-time polymerase chain reaction was used (Figs. 1 and 2). The reactions were performed with ABI7900HT (Applied Biosystems, Foster City, CA) using TaqMan Gene Expression Assays in the presence of GAPDH (Applied Biosystems), according the manufacturer's instructions. Samples were analyzed with ABI 2.4 software, and the relative gene expression was normalized to GAPDH using the comparative 2^-DDCT method.18 For the statistical analysis was used the Wilcoxon signed rank test.
FIGURE 1.
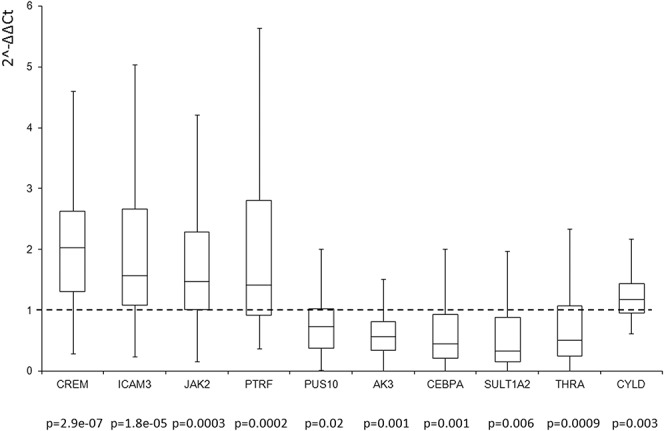
Real-time polymerase chain reaction analysis for the genes CREM, ICAM3, JAK2, PTRF, PUS10, AK3, CEBPA, SULT1A2, THRA, and CYLD in inflamed versus not inflamed CD (n = 40). Box plot indicates the expression levels of all tested samples. Data were expressed as 2-ΔΔCt.
FIGURE 2.
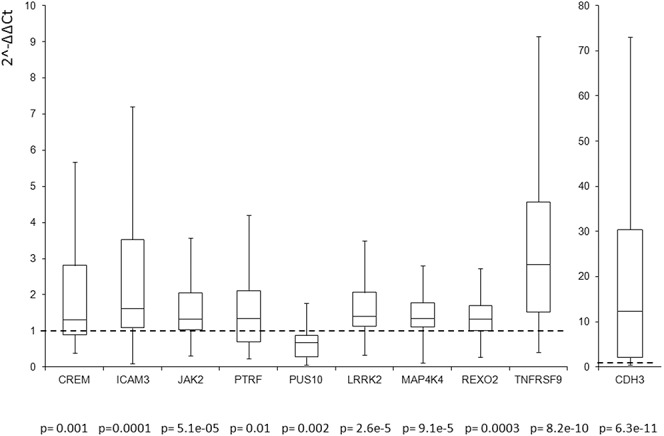
UC, pathways enriched in UC; Real-time polymerase chain reaction analysis for the genes CREM, ICAM3, JAK2, PTRF, PUS10, LRRK2, MAP4K4, REXO2, TNFRSF9, and CDH3 in inflamed versus not inflamed UC (n = 40). Box plot indicates the expression levels of all tested samples. Data were expressed as 2-ΔΔCt.
Pathway Analysis
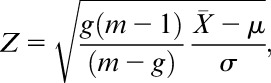
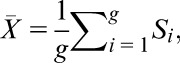
To test the enrichment of a gene set for differentially expressed genes, a restandardized P-value was computed using a random set (RS) procedure.19 In details, the statistical significance of the relationship of a given pathway with the phenotype is assessed with respect to 2 null hypotheses: the first one concerns the lack of association between gene expression profiles and phenotype; the second one concerns the invariance of the enrichment score with respect to the identity of the genes involved in the gene set.18 The procedure is described in the following. Let si (i = 1, … , m) be a score associated to each gene. This score is a quantitative measure of differential expression, which in our case is based on a 2-sample t statistics ti, where the 2 samples are different phenotypes or conditions. Specifically,
where is the cumulative distribution function for a t distribution having n − 2 degrees of freedom and is the standard normal cumulative distribution function. Given the gene set G with g = card(G), the restandardized measure of its deregulation is as follows:
 |
where
 |
and are the mean and the SD estimated on the full set of genes scores, respectively. Significantly large values of Z are expected if G is deregulated in the experimental conditions analyzed. The P-values are computed using a nonparametric permutation test.20 In particular, to test the first null hypothesis, RS method performs 1000 random permutations of the sample labels and recomputes the statistic on each permuted data set. The restandardization of the statistics is performed to take into account the second test. The statistical significance of the enrichment score for each analyzed pathway was controlled for multiple testing by applying the Benjamini–Hochberg FDR algorithm.17 The procedure assesses the expected proportion of false positives among all discoveries (rejected null hypotheses) at a given level of statistical significance.
Data obtained from the analysis were exported in CSV format and processed using a script to get adjacency matrix and graph structure. The script generates a node for each gene sets or “annotation terms/categories,” whereas edges are created between nodes sharing one or more gene.
The script was written ad hoc to perform this analysis using the R statistic software (http://www.R-project.org/). Furthermore, graph data were computed and plotted with Pajek software (http://vlado.fmf.uni-lj.si/pub/networks/pajek/).
Graph was plotted using some preliminary transformations: edges and nodes have been weighted (line thickness is proportional to the number of genes shared by nodes, node size is proportional to number of genes contained in set), nodes have been colored according to tissue status (red: enriched pathways in inflamed tissues; green: enriched pathways in noninflamed tissues), and node brightness was set according to ranges of P-values. Only significantly enriched (P < 0.01) gene sets were considered. Graph layout was drawn using Kamada–Kawai algorithm, and finally, nodes were handily rearranged so that each position responds to lower scale (CD − UC).
RESULTS
Overall Patterns of Gene Expression in CD and UC
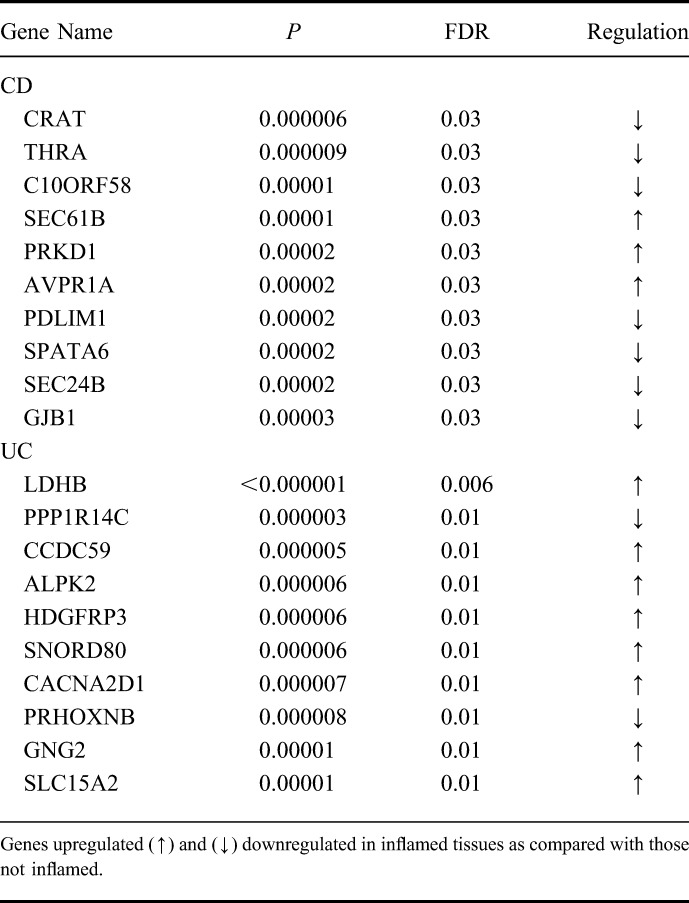
After comparing inflamed with noninflamed, 298 genes in CD (69% of them upregulated) (P < 0.001; FDR < 0.05) and 520 genes in UC (56% of them upregulated) (P < 0.001; FDR < 0.02) were shown to differently express. Only 38 of these genes (5%) were shared by both diseases (see Table, Supplemental Digital Content 1, http://links.lww.com/IBD/A795). In CD, the 10 most deregulated genes were CRAT, THRA, C10ORF58, SEC61B, PRKD1, AVPR1A, PDLIM1, SPATA6, SEC24B, and PRKCZ (P < 0.00003; FDR < 0.03). Among these genes, the THRA, PRKD1, AVPR1A, and PDLIM1 genes are implicated in receptor activity. In UC, LDHB, PPP1R14C, CCDC59, ALPK2, HDGFRP3, SNORD80, CACNA2D1, PRHOXNB, GNG2, and SLC15A2 genes (P < 0.00001; FDR < 0.01) seemed deregulated (Table 2), with CACNA2D1, GNG2, SLC15A2 being all involved in transmembrane transporter activity. Of the 38 genes shared by both IBD, the SLC7A11, SEC61B, and SEC6A14 genes are involved in transmembrane transporter activity, and the CYP2B6, CYP7B1, UGTA1, and SULT1A2 are important for oxidation of biological processes.
TABLE 2.
Expression Changes in the 10 Most Dysregulated Genes in CD and UC
Validation of Selected Deregulated Genes
A total of 10 genes for each disease were analyzed in 40 patients with CD and 40 with UC, of whom the biopsies of the inflamed tissues and the counterpart not inflamed were available. The 5 genes associated exclusively to CD were AK3, CEBPA, SULT1A2, THRA, and CYLD, whereas the 5 genes exclusively associated to UC were CDH3, LRRK2, MAP4K4, REXO2, and TNFRSF9. Furthermore, CREM, ICAM3, JAK2, PTRF, and PUS10 were the 5 genes associated with both diseases. All the analyzed genes were statistically associated to the disease (P < 0.01) (see Figs., Supplemental Digital Content 2 and 3, http://links.lww.com/IBD/A796 and http://links.lww.com/IBD/A797). In addition, all the genes had the same level/sign of expression in the inflamed specimens as compared with noninflamed tissues as those reported in mucosal samples using microarray platforms.
Pathway Analysis
To search for functional commonalities, we performed additional bioinformatic analyses on the entire set of genes and 639 pathways annotated in canonical pathways and 825 gene sets in Biological Processes of Gene Ontology. We identified 34 pathways for CD (P < 0.01), 6 enriched in noninflamed and 28 in inflamed tissues, and 19 pathways for UC, of whom 17 enriched in noninflamed and 2 in inflamed tissues. In CD, the enriched pathways included genes associated with cytokines and cytokine receptors connection, host resistance to microbial infection, response to external stimuli, activation of cell proliferation, differentiation, cell migration, apoptosis, regulation of immune system, and regulation of metabolic and oxidative processes (see Table, Supplemental Digital Content 4, http://links.lww.com/IBD/A798 and Fig. 3). In UC, the enriched pathways were associated with genes related to metabolic (aminoacids, steroids, xenobiotics, butanoate, and short chain fatty acids) and catabolic processes (nucleotides, nitrogen, proteins, xenobiotics, and phosphate regulation), biosynthesis and interconversion processes (bile acid, protein, fatty acids, and sugar acids), leukocyte migration, regulation of cell proliferation, and epithelial-to-mesenchymal transition (EMT) (see Table, Supplemental Digital Content 4, http://links.lww.com/IBD/A798 and Fig. 3).
FIGURE 3.

Nodes denote enriched gene sets or “annotation terms/categories”; node size is proportional to the number of genes in each gene set. Node color (red: enriched pathways in inflamed tissues; green: enriched pathways in noninflamed tissues) denotes the gene set enrichment score. Only significantly enriched (P < 0.01) gene sets are shown. Pathways shared by both diseases have at least one P < 0.01 and the other one P < 0.05. CD, pathways enriched in CD; IBD, pathways enriched shared between CD and UC; UC, pathways enriched in UC.
Subsequently, we searched for functional gene sets specific for CD or UC or shared by both conditions. Pathways were considered significantly associated with both diseases when the P-value was <0.01 at least for a disease and <0.05 for the other one. With this representation, we observed in the CD-associated genes a strong enrichment signal for response to external stimulus, inflammatory response, cytokine signaling, JAK-STAT signaling, immune response–associated processes, and host resistance to microbial infection pathways. All processes were upregulated in inflamed tissues (see Table, Supplemental Digital Content 1, http://links.lww.com/IBD/A798 and Fig. 3). In the UC-associated genes, pathways mainly involved metabolism (aminoacids, steroids, xenobiotics, and butanoate), nucleotide–sugar interconversion was downregulated, and nucleobase, nucleoside, and nucleotide metabolic processes were upregulated.
More importantly, genes shared by both conditions were those controlling pathways implicated in leukocyte migration, regulation of cell proliferation, EMT, regulation of protein and phosphorylation, and fatty acid metabolism.
To support the findings of our differential expression pathway analysis, we compared them with the results reported in Jostins et al.3 In this article, by analyzing genome-wide single-nucleotide polymorphism genotype data, the authors identified 286 Gene Ontology terms and 56 canonical pathways showing significant enrichment in genes contained within IBD loci. As a first step, for both canonical pathways and Gene Ontology terms, we computed RS unsigned scores and P-values to make our analysis comparable with that in the study by Jostins et al.3 Next, the Kolmogorov–Smirnov test was used to compare the distribution of P-values for differential expression of the IBD pathways identified by Jostins et al,3 with the distribution of P-values for all other pathways. The test showed that the Gene Ontology pathways associated to IBD loci are characterized by RS P-values, which are stochastically decreased with respect to the remaining pathways considering both our analyses of UC and CD datasets (P = 10−10 and P = 10−14, respectively). Moreover, the 56 IBD canonical pathways identified by Jostins et al3 resulted significantly enriched of pathways with altered expression also in our dataset in both UC and CD (P = 10−6 and P = 10−10, respectively).
DISCUSSION
In the present study, we analyzed the difference between inflamed and contiguous noninflamed colonic specimens in patients with IBD by applying approaches of both classical and theoretical genetics. In particular, we adopted a new gene set enrichment approach for the analysis of high-throughput gene expression data. In this general framework, analyzing sets of genes rather than individual genes has many advantages in the study of complex and multifactorial diseases.19 Studies that analyze genes singularly are poorly reproducible and, in addition, much of the information associated to genes weakly connected with the phenotype is lost due to the univariate statistics usually adopted in these studies. Gene set analysis methods integrate information embedded in all the genes cooperating in a given cellular function or pathway, by using in this process also genes exhibiting poor association with the analyzed phenotype. By exploiting the intrinsic correlation existing between the expression levels of genes cooperating in a given pathway, gene set analysis methods unveil subtle phenotypic associations even when a few number of samples is available as the simulation studies in19 highlight. Finally, the gene set enrichment method adopted in the described analysis exhibits a low false-positive rate because it assesses the deregulation of a gene set in a phenotype by comparing the actual enrichment score with the one obtained under the null hypothesis of no association exploiting nonparametric permutation tests.
In our analysis in CD, the genes most downregulated were CRAT and THRA, whereas SEC61B and PRKD1 were upregulated. CRAT encodes for carnitine acyltransferase and plays a crucial role in the transport of fatty acids for β-oxidation; dysregulation of transferase enzymes can lead to severe diseases in humans.21 THRA encodes thyroid hormone receptor α, and thyroid hormones regulate skeletal growth, maturation of the central nervous system, cardiac and gastrointestinal function, and energy homeostasis22; SEC61B, a component of the Sec61 translocon, is retrotranslocated from the endoplasmic reticulum to the cytoplasm. PRKD1 is a serine/threonine kinase that regulates various endocellular functions, such as cell proliferation, angiogenesis, apoptosis, adhesion, and cell motility.23
In inflamed UC specimens, the most upregulated gene identified was LDHB, which encodes for subunits H, components of the mature enzyme lactate dehydrogenase. The LDHB interacts with mTOR and STAT3 and plays a pivotal role in tumorigenesis caused by deregulation of v-akt murine thymoma viral oncogene homolog/mammalian target of rapamycin pathway.24
In contrast, the most downregulated gene in UC was the KEPI/PPP1R14C (P = 0.0005; FDR = 0.02), which encodes for a protein kinase C–potentiated inhibitory protein of type 1 Ser/Thr protein phosphatases.
A further downregulated gene was the MCT1/SLC16A1 (P = 0.006; FDR = 0.04), which plays a pivotal role in exporting lactate out of tumor cells. The MCT1 gene belongs to the monocarboxylate trasporter family (MCT1 to MCT4) and was shown to interact specifically with BSG/CD147 glycoprotein/chaperone. BSG gene was also found downregulated (P = 0.0003; FDR = 0.02) in inflamed specimens. In addition, MCT1 strongly facilitates the transport of unchanged short fatty acids, such as acetate, proprionate, and butyrate.
When we considered pathway analysis, UC was found associated with the whole butanoate metabolism pathway (P = 0.002; FDR = 0.15). This pathway encompasses 26 genes, including ABAT, ACADS, ACAT1, ALDH1A1, ALDH2, ALDH9A1, ECHS1, EHHADH, HADHA, HMGCL, and PDHA1, that were downregulated in inflamed tissue (P < 0.01; FDR < 0.06) and the ALDH1A2 gene that was upregulated (P = 0.04; FDR = 0.11).
In the gut, transporters and metabolic enzymes mediate the biotransformation and excretion of xenobiotics. A focal role is played by enzymes that are members of the cytochrome P450 protein (CYP) subfamilies CYP3A and CYP2C (mainly CYP3A4, CYP2C9, and CYP2C19), which are highly expressed in the small intestine.25 CYP3A4 and CYP2C9 were both downregulated (P < 0.005; FDR < 0.04) in our study. CYP3A4 contributes substantially to the first-pass metabolism of many drugs and, in particular, is highly expressed at the tip of microvilli. The downregulation of CYP genes is coupled with pathways named tryptophan metabolism, xenobiotic metabolic process, metabolism of xenobiotics by cytochrome p450, and bile acid biosynthesis resulted enriched in UC.
UGT is another family of genes that seems to play a dominant role in the pathogenesis of UC and is involved in several pathways, all downregulated, named pentose and glucoronate interconversion, and androgen and estrogen metabolism. UGT1A1 (P = 0.0002; FDR = 0.02) is the only enzyme involved in the conjugation of bilirubin, an important endogenous antioxidant. Increased levels of bilirubin may protect against IBD.26
In both IBD phenotypes, multiple aberrancies in lipid metabolism are an emerging area of interest. Fatty acids exert nutritional and protective effects on cell membrane structures, mucus production, and barrier integrity; serve as activators of transcription; and constitute precursors of inflammatory mediators. Fatty acid metabolism pathway (P < 0.006; FDR = 0.27) encompasses 46 genes, and among these 21 genes (ACAA2, ACADM, ACADS, ACADSB, ACAT1, ACOX1, ACSL5, ADH1A, ADH1C, ADH5, ADH6, ALDH2, ALDH9A1, CPT1A, CPT2, ECHS1, EHHADH, HADH, HADHA, HADHB and PECI) were downregulated in inflamed tissue of both diseases (P < 0.03; FDR < 0.11). The only gene upregulated in both diseases was ACSL4 (P = 0.005; FDR = 0.05), and it has been also increased in colon cancer,27 breast cancer,28 and hepatocellular carcinoma.29 The downregulated fatty acid pathway could be involved also in deregulation of other lipids, including lipoxins, resolvins, and protectins, that in cooperation with defensin facilitate recover of inflamed tissues. Notably, alpha- and beta-defensin, in particular DEFA3 (P = 0.01; FDR = 0.09), DEFB4 (P = 0.04; FDR = 0.13), DEFB107A (P = 0.04; FDR = 0.13), and DEFB103A (P = 0.04; FDR = 0.13), were all upregulated only in patients with CD. Beta-defensin DEFB106A (P = 0.03; FDR = 0.10), DEFB124 (P = 0.02; FDR = 0.13), and DEFB113 (P = 0.003; FDR = 0.03) were all downregulated in patients with UC. However, the impairment of butyrate, fatty acid, and beta-oxidation pathways, at least in part related to colonic intestinal dysbiosis, could disrupt endoplasmic reticulum homeostasis and lead to breakdown of unfolded proteins.
In both CD and UC, the pathway EMT, a process in which epithelial cells are stimulated to differentiate into myofibroblast-like cells, was enriched of genes in inflamed tissue (P < 0.007; FDR < 0.60). A number of distinct molecular processes are engaged to initiate EMT and enable it to reach completion. It is regulated by 9 genes and 4 of these (TGF-β1, TGF-β2, and HGF) were upregulated in both diseases, whereas BMP7 was associated to UC and S100A4/FSP1 only to CD. S100A4/FSP1 was found upregulated in ileal stricture, suggesting its role during stricture formation in CD,30 and was proposed as a marker of mesenchymal products generated by the EMTs during the development of fibrosis.31
The pathway cytokine–cytokine receptor interaction plays a role of “master regulator” in inflamed tissues of patients with CD, not only for the connections with many CD-associated pathways but also because cytokines orchestrate the immunoinflammatory process leading to tissue damage.
The pathway encompasses 243 genes and resulted enriched in CD: 89 genes were upregulated and 9 downregulated (P = 0.003; FDR = 0.21). Inhibition of several of these cytokine/cytokine receptor axes by a variety of biological drugs has substantially advanced the treatment of IBD, by targeting the excessive activity of the adaptive immune system. The expression of many genes that are targeted by biological drugs were upregulated in our patients with IBD naïve to biological drugs. TNFα gene was upregulated in our study (P < 0.009; FDR < 0.07); it was the first cytokine targeted by anti-TNF molecules, such as infliximab, adalimumab, and certolizumab, that may heal inflamed mucosa. Other cytokines belong to the pathway were targeted by biologics. We found that all the genes involved in the p40 axis (targeted by Ustekinumab and briakinumab), at exception of IL23R, were all upregulated. In particular, IL12A/p40 (P = 0.008; FDR = 0.07), a functional component of IL23 and IL12, resulted the most associated.
The pathway named response to wounding was found enriched in inflamed tissue in CD and presented 181 genes, among which 67 were upregulated and 9 downregulated (P = 0.003; FDR = 0.25). Overall, expression levels of adrenomedullin (ADM), platelet-activating factor receptor (PTAFR), and S100 calcium binding protein A8 (S100A8) were significantly higher in inflamed colon tissues (P < 0.0007; FDR < 0.04). The protein encoded by the S100A8 gene is remarkable because together with S100A9 (also upregulated in inflamed tissue; P = 0.006; FDR = 0.06) forms different heterodimers and tetramers, which are collectively termed calprotectin. The release of both proteins is attributable to damaged cells under conditions of cell stress, summarized under the term damage-associated molecular pattern proteins, and represents non–pathogen-derived molecules, which may act as exogenous triggers of innate immunity for enhanced proinflammatory activities.32
The pathways named lymphocyte, monocyte, and neutrophil were enriched in inflamed specimens (P < 0.003; FDR < 0.21) and contained the genes SELL, SELE, SELP (encoding L selectin, E selectin and P selectin), intercellular adhesion molecule-1 (ICAM), platelet endothelial cell adhesion molecule-1 (PECAM1), and CD44 molecule (CD44) encoding for adhesion/homing molecules, integrin alpha 4 (ITGA4), integrin alpha M (ITGAM), integrin alpha L (ITGAL), integrin beta 1 (ITGB1), and integrin beta 1 (ITGB2) encoding for integrins were upregulated in inflamed tissues (P < 0.04; FDR < 0.14). Selectins, adhesion/homing molecules (immunoglobulin), and integrins finely regulated a complex multistep process composed of a leukocyte migration from the peripheral circulation to the gut mucosa. Recently, integrins have been highlighted as a novel therapeutic target of anti-inflammatory biological therapies, in particular natalizumab and vedolizumab.
When we restrict our pathway analysis to GO terms and canonical pathways analyzed in the study by Jostins et al,3 we retrieved that the gene set, belong to GO terms, associated in both studies were statistically significant in both UC and CD datasets (P = 10−10 and P = 10−14, respectively) and the same associations were reported for canonical pathways (UC; P = 10−6 and CD; P = 10−10, respectively). This comparison highlights the consistency between our pathway analysis for differential expression of UC and CD and the pathway association to IBD loci resulting by genome-wide association studies.
In conclusion, with the goal of identifying specific gene and molecular signatures from colonic specimens distinctively associated to CD or UC, or shared by both diseases, we identified 298 deregulated genes in CD inflamed mucosal biopsies and 521 deregulated genes in UC. Only 5% of the deregulated genes were shared by both the diseases, corroborating the evidence that the pattern of inflammation is dissimilar between the 2 major IBDs. These differences were greatly crystallized when we applied a pathway analysis, which evidenced that 89% of the deregulated pathways identified in UC were enriched in noninflamed tissue; conversely, only the 18% of the deregulated pathways in CD resulted enriched in noninflamed specimens and were all shared with UC. Taken together, both differential expression and pathway analyses highlighted that the pattern of inflammation in UC is due to a complex interaction network between host, gut microbiome, and diet, suggesting that bacterial products or molecules derived from synthesis or catabolism, together with receptors and molecular transporters, contribute to impairment of the immune response to breakdown of epithelial barrier and to increase of inflammation. In CD, we registered a number of pathways that resulted all enriched in the inflamed mucosa, including chemokine/chemokine receptor interaction, lymphocyte, monocyte, and neutrophil regulation, response to external stimuli and to wounding. In these pathways are located a number of genes encoding a large variety of proteins, such as growth factors, cytokines, chemokines, adhesion molecules, and both pathogen- and damage-associated molecular patterns that result in uncontrolled inflammation due to destruction of epithelial cells, inappropriate stimulation of antimicrobial cells and T-cell differentiation, and inflammasome events.
Expression Data
The messenger RNA expression data have been submitted to ArrayExpress Annotare 2.0 (https://www.ebi.ac.uk/fg/annotare) with the series accession number E-MTAB-2967.
ACKNOWLEDGMENTS
The authors thank all patients and the physicians and nursing staff who helped with samples recruitment.
Footnotes
Supplemental digital content is available for this article. Direct URL citations appear in the printed text and are provided in the HTML and PDF versions of this article on the journal's Web site (www.ibdjournal.org).
Supported by the Italian Ministry of Health (GR-2008-1144485, RC1202GA39, and RC1302GA33) and by the “5 × 1000” voluntary contributions. The study was co-funded by a grant from Fondazione Cassa di Risparmio di Puglia (CI: 3102011041457/RV12GAMICI). This work was partially supported by grants from Regione Puglia PO FESR 2007-2013 Progetto BISIMANE (Cod. n. 44), Progetto FIRB RBAP11B2SX, Progetto di Ricerca Finalizzata 2009 RF/2009-1471624.
The authors have no conflicts of interest to disclose.
REFERENCES
- 1.Xavier RJ, Podolsky DK. Unravelling the pathogenesis of inflammatory bowel disease. Nature. 2007;448:427–434. [DOI] [PubMed] [Google Scholar]
- 2.Gaya DR, Russell RK, Nimmo ER, et al. New genes in inflammatory bowel disease: lessons for complex diseases? Lancet. 2006;367:1271–1284. [DOI] [PubMed] [Google Scholar]
- 3.Jostins L, Ripke S, Weersma RK, et al. Host-microbe interactions have shaped the genetic architecture of inflammatory bowel disease. Nature. 2012;491:119–124. [DOI] [PMC free article] [PubMed] [Google Scholar]
- 4.Franke A, McGovern DP, Barrett JC, et al. Genome-wide meta-analysis increases to 71 the number of confirmed Crohn's disease susceptibility loci. Nat Genet. 2010;42:1118–1125. [DOI] [PMC free article] [PubMed] [Google Scholar]
- 5.Anderson CA, Boucher G, Lees CW, et al. Meta-analysis identifies 29 additional ulcerative colitis risk loci, increasing the number of confirmed associations to 47. Nat Genet. 2011;43:246–252. [DOI] [PMC free article] [PubMed] [Google Scholar]
- 6.Walsh T, McClellan JM, McCarthy SE, et al. Rare structural variants disrupt multiple genes in neurodevelopmental pathways in schizophrenia. Science. 2008;320:539–543. [DOI] [PubMed] [Google Scholar]
- 7.Subramanian A, Tamayo P, Mootha VK, et al. Gene set enrichment analysis: a knowledge-based approach for interpreting genome-wide expression profiles. Proc Natl Acad Sci U S A. 2005;102:15545–15550. [DOI] [PMC free article] [PubMed] [Google Scholar]
- 8.Maglietta R, Piepoli A, Catalano D, et al. Statistical assessment of functional categories of genes deregulated in pathological conditions by using microarray data. Bioinformatics. 2007;23:2063–2072. [DOI] [PubMed] [Google Scholar]
- 9.Wang K, Li M, Hakonarson H. Analysing biological pathways in genome-wide association studies. Nat Rev Genet. 2010;11:843–854. [DOI] [PubMed] [Google Scholar]
- 10.Stoughton RB. Applications of DNA microarrays in biology. Annu Rev Biochem. 2005;74:53–82. [DOI] [PubMed] [Google Scholar]
- 11.Lawrance IC, Fiocchi C, Chakravarti S. Ulcerative colitis and Crohn's disease: distinctive gene expression profiles and novel susceptibility candidate genes. Hum Mol Genet. 2001;10:445–456. [DOI] [PubMed] [Google Scholar]
- 12.Noble CL, Abbas AR, Cornelius J, et al. Regional variation in gene expression in the healthy colon is dysregulated in ulcerative colitis. Gut. 2008;57:1398–1405. [DOI] [PubMed] [Google Scholar]
- 13.Noble CL, Abbas AR, Lees CW, et al. Characterization of intestinal gene expression profiles in Crohn's disease by genome-wide microarray analysis. Inflamm Bowel Dis. 2010;16:1717–1728. [DOI] [PubMed] [Google Scholar]
- 14.Langmann T, Moehle C, Mauerer R, et al. Loss of detoxification in inflammatory bowel disease: dysregulation of pregnane X receptor target genes. Gastroenterology. 2004;127:26–40. [DOI] [PubMed] [Google Scholar]
- 15.Okahara S, Arimura Y, Yabana T, et al. Inflammatory gene signature in ulcerative colitis with cDNA macroarray analysis. Aliment Pharmacol Ther. 2005;21:1091–1097. [DOI] [PubMed] [Google Scholar]
- 16.Lennard-Jones JE. Classification of inflammatory bowel disease. Scand J Gastroenterol Suppl. 1989;170:2–6. [DOI] [PubMed] [Google Scholar]
- 17.Benjamini Y, Hochberg Y. Controlling the false discovery rate: a practical and powerful approach to multiple testing. J R Stat Soc Series B Stat Methodol. 1995;57:289–300. [Google Scholar]
- 18.Livak KJ, Schmittgen TD. Analysis of relative gene expression data using real-time quantitative PCR and the 2(-Delta Delta C(T)) method. Methods. 2001;25:402–508. [DOI] [PubMed] [Google Scholar]
- 19.Abatangelo L, Maglietta R, Distaso A, et al. Comparative study of gene set enrichment methods. BMC Bioinformatics. 2009;10:275. [DOI] [PMC free article] [PubMed] [Google Scholar]
- 20.Good P. Permutation Tests: A Practical Guide to Resampling Methods for Testing Hypotheses (Springer Series in Statistics). New York: Springer; 2000. [Google Scholar]
- 21.Jogl G, Tong L. Crystal structure of carnitine acetyltransferase and implications for the catalytic mechanism and fatty acid transport. Cell. 2003;112:113–122. [DOI] [PubMed] [Google Scholar]
- 22.Bochukova E, Schoenmakers N, Agostini M, et al. A mutation in the thyroid hormone receptor alpha gene. N Engl J Med. 2012;366:243–249. [DOI] [PubMed] [Google Scholar]
- 23.Eiseler T, Döppler H, Yan IK, et al. Protein kinase D1 regulates cofilin-mediated F-actin reorganization and cell motility through slingshot. Nat Cell Biol. 2009;11:545–556. [DOI] [PMC free article] [PubMed] [Google Scholar]
- 24.Zha X, Wang F, Wang Y, et al. Lactate dehydrogenase B is critical for hyperactive mTOR-mediated tumorigenesis. Cancer Res. 2011;71:13–18. [DOI] [PubMed] [Google Scholar]
- 25.Langmann T, Schmitz G. Loss of detoxification in inflammatory bowel disease. Nat Clin Pract Gastroenterol Hepatol. 2006;3:358–359. [DOI] [PubMed] [Google Scholar]
- 26.de Vries HS, Te Morsche RH, Jenniskens K, et al. A functional polymorphism in UGT1A1 related to hyperbilirubinemia is associated with a decreased risk for Crohn's disease. J Crohns Colitis. 2012;6:597–602. [DOI] [PubMed] [Google Scholar]
- 27.Cao Y, Dave KB, Doan TP, et al. Fatty acid CoA ligase 4 is up-regulated in colon adenocarcinoma. Cancer Res. 2001;61:8429–8434. [PubMed] [Google Scholar]
- 28.Monaco ME, Creighton CJ, Lee P, et al. Expression of long-chain fatty Acyl-CoA Synthetase 4 in breast and prostate cancers is associated with sex steroid hormone receptor negativity. Transl Oncol. 2010;3:91–98. [DOI] [PMC free article] [PubMed] [Google Scholar]
- 29.Sung YK, Hwang SY, Park MK, et al. Fatty acid-CoA ligase 4 is overexpressed in human hepatocellular carcinoma. Cancer Sci. 2003;94:421–424. [DOI] [PMC free article] [PubMed] [Google Scholar]
- 30.Cunningham MF, Docherty NG, Burke JP, et al. S100A4 expression is increased in stricture fibroblasts from patients with fibrostenosing Crohn's disease and promotes intestinal fibroblast migration. Am J Physiol Gastrointest Liver Physiol. 2010;299:G457–G466. [DOI] [PubMed] [Google Scholar]
- 31.Kalluri R, Weinberg RA. The basics of epithelial-mesenchymal transition. J Clin Invest. 2009;119:1420–1428. [DOI] [PMC free article] [PubMed] [Google Scholar]
- 32.Foell D, Wittkowski H, Roth J. Monitoring disease activity by stool analyses: from occult blood to molecular markers of intestinal inflammation and damage. Gut. 2009;58:859–868. [DOI] [PubMed] [Google Scholar]