The current findings suggest the potential utility of the 95% percentile of the standard uptake value as a prognostic biomarker to identify a high-risk group in whom a high incidence of radiation pneumonitis is expected.
Abstract
Purpose
To examine the association between pre–radiation therapy (RT) fluorine 18 fluorodeoxyglucose (FDG) uptake and post-RT symptomatic radiation pneumonitis (RP).
Materials and Methods
In accordance with the retrospective study protocol approved by the institutional review board, 228 esophageal cancer patients who underwent FDG PET/CT before chemotherapy and RT were examined. RP symptoms were evaluated by using the Common Terminology Criteria for Adverse Events, version 4.0, from the consensus of five clinicians. By using the cumulative distribution of standardized uptake values (SUVs) within the lungs, those values greater than 80%–95% of the total lung voxels were determined for each patient. The effect of pre-chemotherapy and RT FDG uptake, dose, and patient or treatment characteristics on RP toxicity was studied by using logistic regression.
Results
The study subjects were treated with three-dimensional conformal RT (n = 36), intensity-modulated RT (n = 135), or proton therapy (n = 57). Logistic regression analysis demonstrated elevated FDG uptake at pre-chemotherapy and RT was related to expression of RP symptoms. Study subjects with elevated 95% percentile of the SUV (SUV95) were more likely to develop symptomatic RP (P < .000012); each 0.1 unit increase in SUV95 was associated with a 1.36-fold increase in the odds of symptomatic RP. Receiver operating characteristic (ROC) curve analysis resulted in area under the ROC curve of 0.676 (95% confidence interval: 0.58, 0.77), sensitivity of 60%, and specificity of 71% at the 1.17 SUV95 threshold. CT imaging and dosimetric parameters were found to be poor predictors of RP symptoms.
Conclusion
The SUV95, a biomarker of pretreatment pulmonary metabolic activity, was shown to be prognostic of symptomatic RP. Elevation in this pretreatment biomarker identifies patients at high risk for posttreatment symptomatic RP.
© RSNA, 2015
Introduction
Radiation pneumonitis (RP) is an inflammatory reaction in response to radiation injury (1). Pretreatment risk factors include the percentage of lung irradiated (2–5), chemotherapy type (6–8), and inflammation-prone conditions (9). Bronchoalveolar lavage (10) and lung biopsies (11) have shown that acute RP is characterized by leukocyte infiltration. Leukocytes, recruited from the circulation by a persistent cascade of proinflammatory cytokines (12) originating from the injured site and possibly cancer cells (13), migrate into the injured lung tissue (12). Normally, to limit damage to healthy tissue, the inflammatory response is quenched following a similar cascade of signals (14,15). Variation in either cascade or their termination may account for the observed variable RP response (16). Can aspects of this patient-specific variability be found on pretreatment imaging studies?
Several investigators have found that the presence of interstitial pneumonitis on pretreatment computed tomographic (CT) scans is predictive of an increased risk of symptomatic RP (17–19). Makimoto et al (17) found that pretreatment radiographic findings of underlying lung disease were associated with a higher incidence of RP (47.1% vs 5.3%, P < .001). Sanuki et al (18) found interstitial findings at CT were associated with grade 3 or higher RP (26% vs 3%, P < .001). Finding these subtle CT features requires an experienced chest radiologist. Fluorine 18 fluorodeoxyglucose (FDG) positron emission tomography (PET)/CT imaging also provides assessment of pneumonitis; pulmonary inflammation appears as enhanced FDG uptake (20–22). In preclinical and clinical studies, FDG uptake was found to reflect postmigratory neutrophil activity (20,21,23–25).
Petit et al (26) performed a quantitative image analysis study using pre–radiation therapy (RT) FDG PET/CT in 101 non–small cell lung cancer patients. They found the standardized uptake value (SUV) of the highest 5% FDG uptake (95% percentile of the SUV [SUV95]) within the lungs was predictive of RP at multivariate analysis (P = .016). This subtle elevation in pre-RT FDG uptake in the lungs may represent an enhanced inflammatory response to ambient background stimuli (eg, pollen, dust, etc). In this study, we will investigate this prognostic biomarker of RP in patients with esophageal cancer who have cancer-free lungs.
The aim of this retrospective study was to examine the association between pre-RT FDG uptake and post-RT symptomatic RP. Our working hypothesis is that pre-RT inflammation in the lung, manifesting as an elevated pulmonary SUV, increases the risk for symptomatic RP. The statistical associations of irradiated lung dosimetric and pretreatment patient-specific parameters with RP were also studied.
Materials and Methods
Patient Population
The study population comprised patients treated at our institution for esophageal cancer between November 2003 and April 2011 (n = 228). All patients who had pretreatment FDG PET studies and dosimetric record available electronically and who underwent staging PET/CT 45 days or less prior to the start of RT were included. There were no exclusions. All patients had biopsy-proven esophageal cancer. Patient identifiers were removed in accordance with a retrospective study protocol (PA11–0801) approved by our institutional review board.
FDG PET/CT Imaging
Patients fasted 6 hours prior to their FDG PET/CT imaging session. Blood glucose levels were required to be less than 120 mg/dL to proceed with the imaging study. Intravenous injection of 629 MBq (range, 550–740 MBq) of FDG in the arm occurred 60 minutes prior to the image acquisition. The Discovery ST PET/CT scanner (GE Medical Systems, Waukesha, Wis) was used to acquire the FDG PET/CT images. The CT images were converted into 511-keV equivalents for attenuation correction. The SUVs were calculated from the attenuation-corrected FDG PET emission images by using the following equation (27): SUV = FDGcr/FDGid, where FDGcr is FDG count rate per milliliter times body weight (in grams) and FDGid is decay-corrected FDG injected dose (in becquerels).
RT Planning
Treatment planning for megavoltage x-ray cases was performed with a Pinnacle 3, version 8.0u (Philips Medical Systems, Andover, Mass) treatment-planning system. Proton beam treatment planning was performed with an Eclipse (Varian Medical Systems, Palo Alto, Calif) treatment-planning system. By using a constant relative biologic effectiveness of 1.1, proton therapy doses were converted to cobalt 60 gray equivalents. The distributions of radiation dose were calculated by using lung heterogeneity corrections. The mean lung dose and the percentage of lung volume irradiated above 5 Gy (V5), 10 Gy (V10), 20 Gy (V20), and 30 Gy (V30) were used as dosimetric parameters to represent the lung volumes irradiated.
Clinical Toxicity and Radiation Parameters
Pneumonitis was scored by using the National Cancer Institute Common Terminology Criteria for Adverse Events, version 4. All patient documents were used in the scoring, including consultation notes, radiographic images, clinical notes, summaries, and scanned outside medical records until 6 months after completing radiation or until esophagectomy. A simple group consensus was recorded; cases were reviewed until all discrepancies in scoring were agreed upon unanimously. The consensus group consisted of five members, including one attending physician (T.M.G.) with 12 years of experience in thoracic radiation oncology, one attending physician (H.S.) with 2 years of experience in thoracic radiation oncology, a 1st-year medical resident in radiation oncology (N.P.), a pulmonologist with 5 years of clinical experience (S.A.G.), and a 4th-year medical student (S.A.). Clinically symptomatic pneumonitis was defined as grade 2 or higher. Within RT treatment field, radiographic findings consistent with RP on CT and/or PET/CT images were required for a score of 1 or greater.
Pretreatment Radiographic Findings
Pretreatment imaging studies were evaluated for the extent of parenchymal disease prior to RT. A thoracic radiologist (D.P.) with 8 years of experience assessed the lung parenchyma in each portion of the PET-CT studies, in addition to any other available CT studies the patients had at least 2 months prior to the start of RT. A visual scoring system was implemented to define the extent of any abnormality (ie, inclusive of focal, diffuse, acute, or chronic). The scoring specifications were defined as follows: score 1, any findings involving 30% or less of the lungs; score 2, findings involving between 30% and 70% of the lungs; and score 3, findings involving 70% or more of the lungs. Subsequent findings were summarized to assess the potential confounding influence of pre-RT radiographic abnormality, with radiation toxicity scoring after treatment.
Image Analysis
The image analysis for each patient was processed and evaluated by using custom Matlab software (v2011a, Mathworks, Natick, Mass). The FDG PET/CT images were spatially registered to the planning CT by using an affine transformation generated by an automated point-matching algorithm (28) following the approach described by Ourselin et al (29). The image registrations were all visually verified for spatial accuracy. The lung regions of interest (ROIs) were segmented by using histogram segmentation with connectivity of the lung parenchyma. Overlap of liver or heart into the lung ROI (arrows in Fig 1) was manually removed. Attenuation cold-spot artifacts at the diaphragm surface (30) were also manually removed. The resulting binary lung ROIs were used in subsequent analyses.
Figure 1:
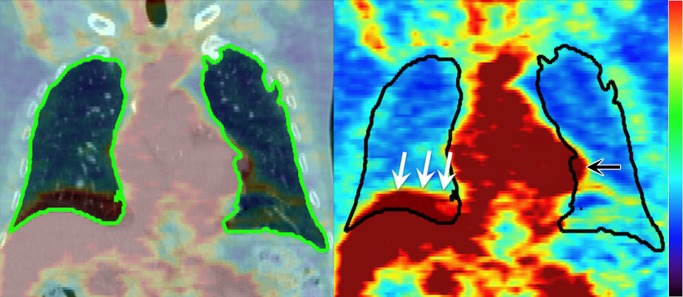
Left: Coronal section from pre-RT FDG PET/CT image, with the lung ROI segmented from CT (green on left, black on right). Right: Manual editing is required to remove the liver (white arrows) and heart (black arrow) from the lung ROI due to motion-induced misalignment of PET and CT.
Pretreatment PET/CT Analysis
The SUVs of all FDG PET image voxels in the lung ROI were binned into histograms, and the mean SUV, the standard deviation of the SUV, and the maximum SUV were calculated as described in Petit et al (31). A cumulative probability distribution was constructed from each histogram (Fig 2) and used to determine the 80th, 90th, and 95th percentiles of the SUV distribution (SUV80, SUV90, and SUV95 respectively). To assess the statistical association of pretreatment CT attenuation and RP, the parameters mentioned above were also calculated for the CT image voxels: the mean HU, standard deviation of HU, maximum HU and 80th, 90th, and 95th percentiles of the HU, where HU is the CT image value in Hounsfield units.
Figure 2:
Determination of the SUV95. The cumulative distribution of SUV values is constructed from the voxel values within the lung ROI for the case in Figure 1. The SUV80, SUV90, and SUV95 values are obtained from these distributions. The determination of the SUV95 and an ROI comprising the voxels with values of SUV95 or greater are illustrated.
The overlap between the SUV95, SUV90, and SUV80 ROIs with the lung volumes that received ≥ 2 to 20 Gy was created and studied. This is represented in the following equation:
where each ROI is limited to those values within the lung meeting their respective criteria. SUVx refers to the numerical value of the SUV that is the xth percentile of the SUV distribution. The quantity Overlap(SUVx, Dy) represents the intersection of the region defined by an SUV greater than the SUVx and the region with radiation dose (D) greater than the given dose Dy.
Statistical Analysis
Categorical variables were summarized by using frequency tables and were evaluated for association with symptomatic RP by using Pearson χ2 test for marginal homogeneity. Age, pretreatment forced expiratory volume in 1 second, and the interval between RT and PET imaging were summarized as median and range and were evaluated for association by using Mann-Whitney U tests. Univariate logistic regression analyses were used to predict symptomatic RP as functions of pre-RT pulmonary and dosimetric characteristics (ie, SUV, attenuation values in Hounsfield units, mean lung dose, irradiated volume). Posthoc application of the sequentially rejective Bonferroni method (32) was used to adjust for multiplicity among the six SUV analyses.
Multiple logistic regression inference was used to evaluate the relationship between symptomatic RP and SUV95 in the presence of several potential confounding variables. Results are provided for the best subset of predictors (RT, SUV95, and interval between RT and PET) derived from stepwise backward model selection based on Akaike information criterion (33). Partial effects were evaluated for significance by using two-sided Wald tests. Nagelkerke coefficient of multiple determinations (34) is used to report the proportion reduction in error variation obtained by incorporating the predictors. The receiver operating characteristic (ROC) curve for predicting symptomatic RP as a function of SUV95 is provided with Delong 95% confidence interval (35) for the area under the ROC curve and Youden optimal (36) sensitivity and specificity. All tests were two sided, with α of .05 to confer statistical significance. Interreviewer variability in acquisition of SUV95 was assessed for three independent reviewers in a subsample of 20 patients; 95% limits of agreement were estimated by using one-way mixed effects analysis of variance (37). The resultant Bland-Altman plot (38) is provided.
Leave-one-out cross validation analysis was performed, whereby RP status of each patient was determined by using the optimal classification threshold attained by fitting the ROC model to the remaining 227 patients. Additionally, we evaluated the predictive performance of the model by partitioning the data into training (n = 137, or approximately 60%) and test (n = 91, or approximately 40%) sets chosen at random and subsequently determined sensitivity, specificity, and threshold parameters.
All plots and analyses were performed by using statistical software, R (R Development Core Team, http://www.r-project.org) version 3.0.
Results
An overview of the 228 study subjects and their treatment characteristics is presented in Table 1. All of the subjects were treated for primary esophageal cancer with RT (intensity-modulated RT, proton therapy, or three-dimensional conformal RT) and concurrent chemotherapy. Twenty-two percent of the patients developed symptomatic RP, that is, Common Terminology Criteria for Adverse Events, version 4.0, score of 2 or higher. Eighty-one (35.5%) patients received RT without developing any evidence of RP (grade 0); 97 (42.5%) patients developed mild symptoms without requiring interventions (grade 1); 36 (15.8%) required medication or had respiratory symptoms affecting the extended activities of daily living (grade 2); 12 (5.3%) patients required oxygen (grade 3); and two (0.9%) patients died (grade 5) of respiratory failure 210 days and 137 days after the start of RT.
Table 1.
Patient Characteristics
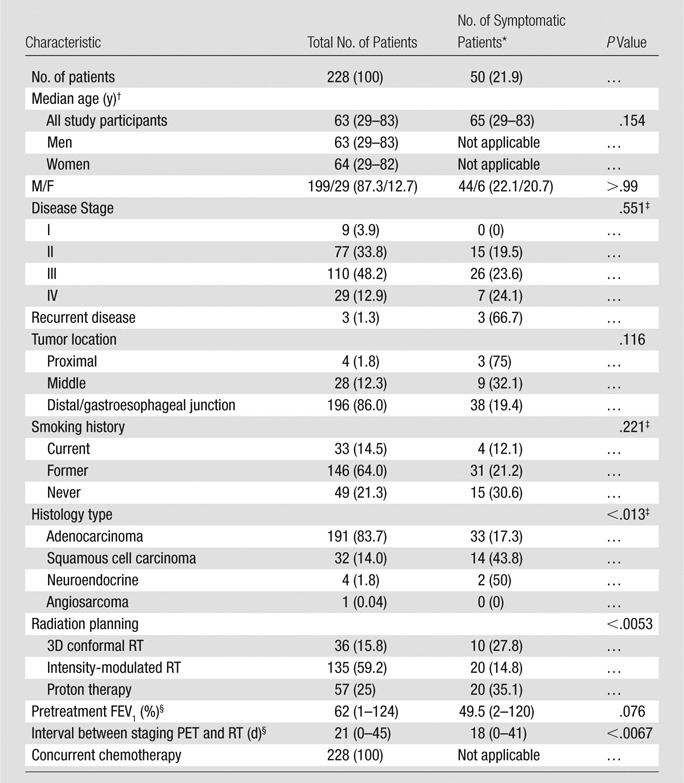
Note.—Unless otherwise indicated, data in parentheses are percentages. FEV1 = forced expiratory volume in 1 second, 3D = three-dimensional. Hypothesis testing for association used the Mann-Whitney U test for continuous predictors; Pearson χ2 test was used for marginal homogeneity for categorical predictors.
*Symptomatic status defined according to Common Terminology Criteria for Adverse Events (version 4.0) RP grade 2 or higher.
†Data are medians and data in parentheses are the range.
‡Yates continuity correction applied.
§Data in parentheses are the range.
The distribution of patients per study availability for pretreatment assessment of radiographic abnormality is shown in Table 2. The abnormalities found are shown in Table 3. In total, 38 of 228 patients (16.6%) demonstrated some degree of parenchymal abnormality. In those cases for which additional CT studies were available, the results of all CT observations were consistent with those determined by using the CT portion of the corresponding PET/CT study, despite differences in imaging technique. Among those patients with additional available CT studies (n = 175), 137 CT studies were performed with 2.5-mm axial images, with coronal and sagittal reformats available. For the remaining (n = 38) patients, CT studies were acquired with 5-mm axial images.
Table 2.
Distribution of Patients per Study Availability for Pretreatment Evaluation of Radiographic Abnormality
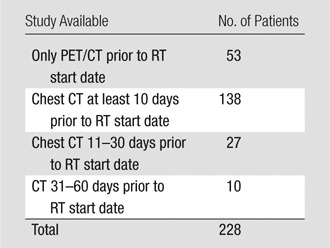
Table 3.
Distribution of Pre-RT Radiographic Findings according to Abnormality and Score
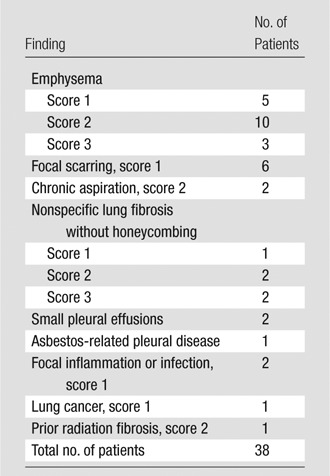
Note.—Score defined according to percentage of lung involvement: score 1, 30% of the lungs or less, score 2, between 30% and 705 of the lungs, and score 3, 70% or more of the lungs.
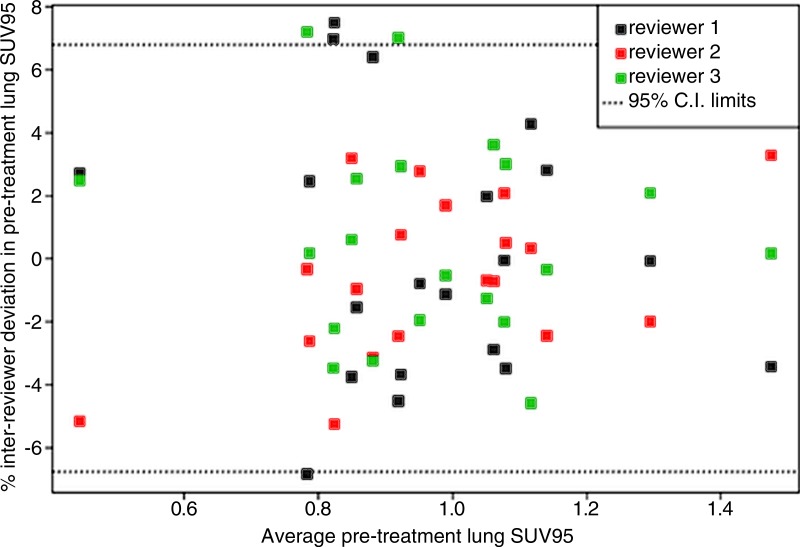
Interreviewer agreement among three independent reviewers for determination of the SUV95 using a sample of 20 patients is plotted in Figure 3. For each case, each reviewer independently determined the SUV95 starting with the registered images. All subjective processes, including manual editing of the lung ROIs, were included. The results suggest with 95% confidence that on average, the interreviewer effect for acquiring SUV95 was within approximately 7% of the reviewer average.
Figure 3:
Bland-Altman plot for interreviewer agreement in the acquisition of pretreatment lung SUV95. Observed percentage deviation from mean SUV95 in a subsample of 20 patients assessed by three independent reviewers. One-way mixed-effects analysis of variance obtains 95% confidence boundaries of ±6.8%.
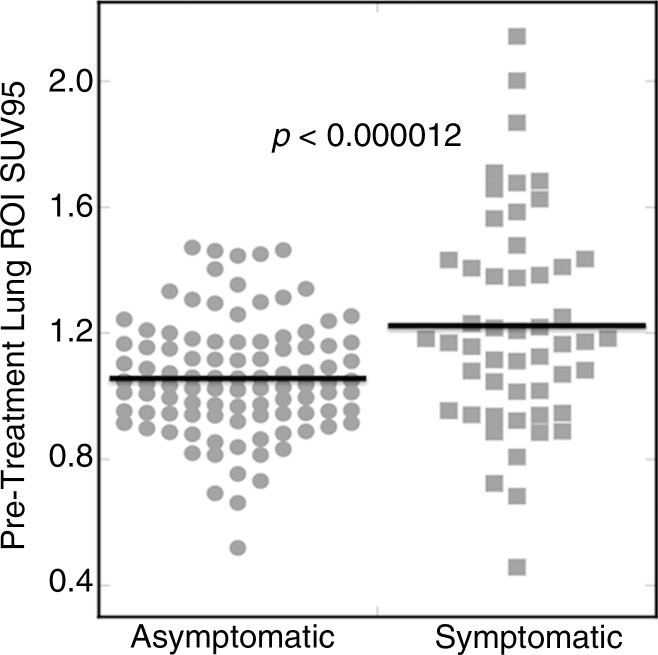
Histology subtype, RT modality, and duration between staging PET and RT were significantly associated with development of symptomatic RP marginally by using the disparate hypothesis tests summarized Table 1. Descriptive summaries of treatment dosimetric variables, as well as FDG PET variables, are summarized in Table 4. Univariate logistic regression analyses are summarized in Table 5. All SUV-derived parameters were significantly associated with the development of symptomatic RP after multiplicity adjustment. Standard deviation of SUV (P < .0000023) and SUV95 (P < .000012) were the most significant marginal predictors of postradiation lung toxicity. Figure 4 shows a dot plot of the lung SUV95 for the set of 228 esophageal cancer cases. Other image parameters previously reported to be predictors of RP, including RT dosimetric parameters mean lung dose, V5, V20, V30, and pre-RT CT derived parameters, did not reach statistical significance for association with symptomatic RP in this studied population of patients.
Table 4.
Descriptive Summaries of the Continuous Variables for the 228 Study Participants
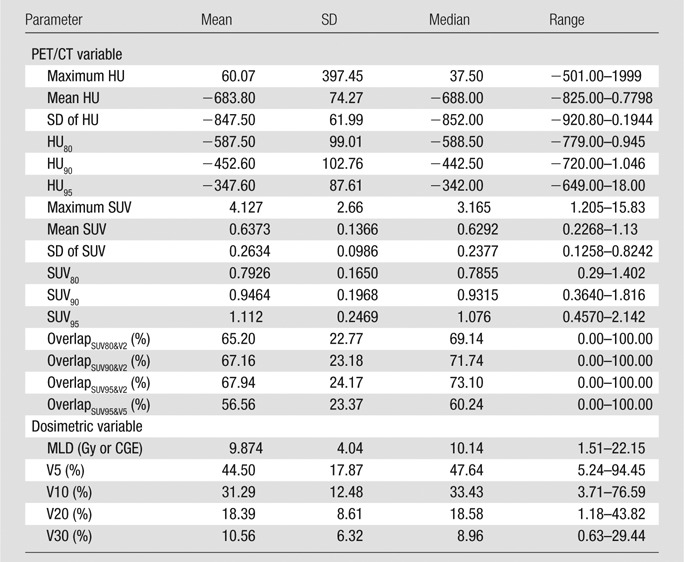
Note.—CGE = cobalt 60 gray equivalent, HU = attenuation value in Hounsfield unit, MLD = mean lung dose, SD = standard deviation.
Table 5.
Logistic Regression Analysis for RP Grade 2 or Higher
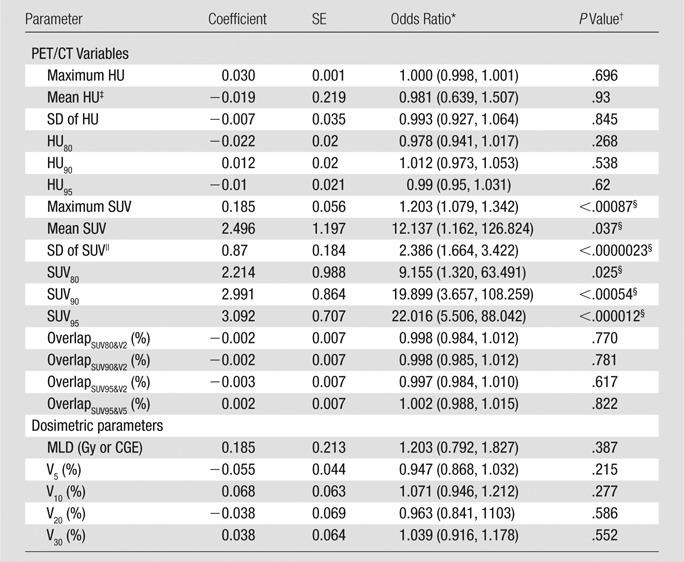
Note.— CGE = cobalt 60 gray equivalent, HU = attenuation value in Hounsfield unit, MLD = mean lung dose, SE = standard error of the estimated coefficient parameter, SD = standard deviation.
*Data in parentheses are 95% CIs.
†Derived from two-sided hypothesis tests by using Wald χ2.
‡Scaled by 0.01.
§Odds of RP grade 2 or higher increased with each of the six SUV-derived parameters. SUV parameters maintain significance after posthoc application of the sequentially rejective Bonferroni method (32) to adjust for multiplicity, with familywise error controlled at the α of .05 significance level.
||Scaled by 10.
Figure 4:
Pretreatment SUV95. Dot plot of SUV95 found in the lung ROI for 228 esophageal cancer cases. Symptomatic patients exhibited a significantly higher mean SUV95. P value derives from univariate logistic regression analysis (P < .000012).
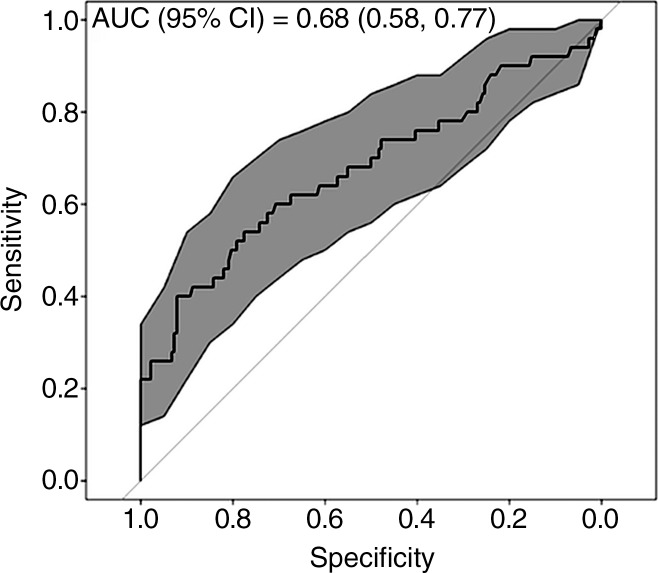
Results from multiple logistic regression analysis with the Akaike information criterion optimal subset of predictors are summarized in Table 6. SUV95 contributed the only significant partial effect in the multivariate inference (P < .000019). For a given RT modality and staging interval, each increase in SUV95 of size 0.1 was associated with a 1.36-fold increase in the odds of subsequently developing symptomatic RP. Thus, a patient treated with intensity-modulated RT presenting with SUV95 of 1.2 was associated with a 1.6-fold increase in the risk of RP when compared with a patient with SUV95 of 1. For three-dimensional conformal RT and proton therapy, the corresponding relative risks of RP were 1.39 and 1.44. Other clinical and FDG PET variables were conditionally independent of symptomatic RP in the presence of SUV95, including standard deviation of SUV, which was highly correlated with SUV95 (Pearson product-moment correlation = 0.79). ROC analysis (depicted graphically in Fig 5) resulted in an area under the ROC curve of 0.676 (95% confidence interval: 0.58, 0.77). Youden optimal threshold at SUV95 of 1.37 provided sensitivity of 0.40 and specificity of 0.92. The threshold at SUV95 of 1.17 provided sensitivity of 0.60 and specificity of 0.71.
Table 6.
Multiple Logistic Regression Analysis for RP Grade 2 or Higher in 228 Patients

Note.—The odds of symptomatic RP increased with SUV95. Stepwise backward model selection based on Akaike information criterion was used. Symptomatic RP was conditionally independent of treatment modality, tumor location, tumor histology, smoking status, interval between staging PET/CT and RT, pretreatment forced expiratory volume in 1 second, age, and standard deviation of SUV in the presence of SUV95. Nagelkerke coefficient of multiple determination, R2 = 0.218.
*SE = standard error of the estimated coefficient parameter.
†Data in parentheses are 95% confidence intervals.
‡Derived from two-sided hypothesis tests by using Wald χ2.
Figure 5:
ROC curve analysis of pre-RT FDG PET–derived SUV95 to predict symptomatic RP. Gray-shaded area provides bootstrap-derived 95% confidence interval (CI) estimate for ROC shape implemented with statistical software. The area under the ROC curve was 0.676 (95% CI: 0.58, 0.77). Youden optimal threshold at SUV95 of 1.37 provided sensitivity of 0.40 and specificity of 0.92. The threshold at SUV95 of 1.17 provided sensitivity of 0.60 and specificity of 0.71.
Leave-one-out cross validation analysis yielded classification thresholds among the 228 individual ROC analyses ranging between 1.363 and 1.373. This resulted in 20 true-positive classifications out of 50 patients with RP (sensitivity, 0.40) and 163 true-negative classifications out of 178 patients without RP (specificity, 0.915). Partitioning the data into training (n = 137) and test (n = 91) sets yielded eight of 17 true-positive (sensitivity, 0.47) and 66 of 72 true-negative (specificity, 0.92) results, with threshold of 1.373.
Discussion
This report investigated the prognostic value of pretreatment FDG PET for symptomatic RP in patients with esophageal cancer who receive thoracic RT. We found the study subjects who had evidence of underlying pulmonary inflammation before RT (ie, SUV95 ≥ 1.2), determined with quantitative evaluation of the pre-RT FDG PET images, were 1.6 times more likely to develop symptomatic RP than one with lower baseline lung activities (SUV95 of 1.0). Classification thresholds determined via leave-one-out cross validation yielded sensitivity and specificity parameters nearly identical to those reported in the full-data analysis.
Moreover, evaluation of pretreatment imaging studies for the presence of radiographic abnormalities prior to RT demonstrated that the majority of patients (83.4%) had no demonstrable radiographic findings. Those patients who presented with only radiographic abnormality at follow-up were scored as grade 1 and not considered symptomatic. On the basis of these observations, we conclude that the findings at CT were not able to better predict symptomatic RP response compared with the SUV95, given that the majority of patients did not have lung disease.
A monotonic relationship between SUV95 and RP was observed. Every 0.1 unit increase in SUV95 in a given RT modality and staging interval was associated with a 1.36–fold increase in the odds of developing RP. As expected, the risk of symptomatic RP increased even when the pre-RT pulmonary inflammation was not in the subsequent RT treatment field. This result was expected because the individual’s tissue injury and inflammation sequestration signaling are not location specific. The innate immune response, which results in RP inflammation, arises from the blood. The ambient background stimuli (eg, pollen, dust, etc) that cause the SUV95 response may be viewed as a pre-RT response test.
Other image parameters were previously found to be predictors of RP, such as RT dosimetric parameters mean lung dose, V5, V20, et cetera (2–5) and pre-RT CT interstitial findings (17,18). In this study, those dosimetric parameters did not reach statistical significance. Our results are similar to the findings reported by Petit et al (26) for patients with non–small cell lung cancer. In addition to pre-RT inflammation in the lungs and dosimetry-derived parameters, previous retrospective studies have found the use of pulmonary function images (eg, single photon emission CT [SPECT] perfusion) to improve RP prediction over volume alone (39); its elusive validation (40) most likely reflects the underlying multifactorial nature of RP. Genetic prediction of RP toxicity remains a distant goal (41,42). A multiparameter model coupling the SUV95, pulmonary function, and dosimetric parameters may improve the predictive power for pre-RT high-risk subject selection. Multiparameter modeling for RP risk assessment will be the subject of our future studies.
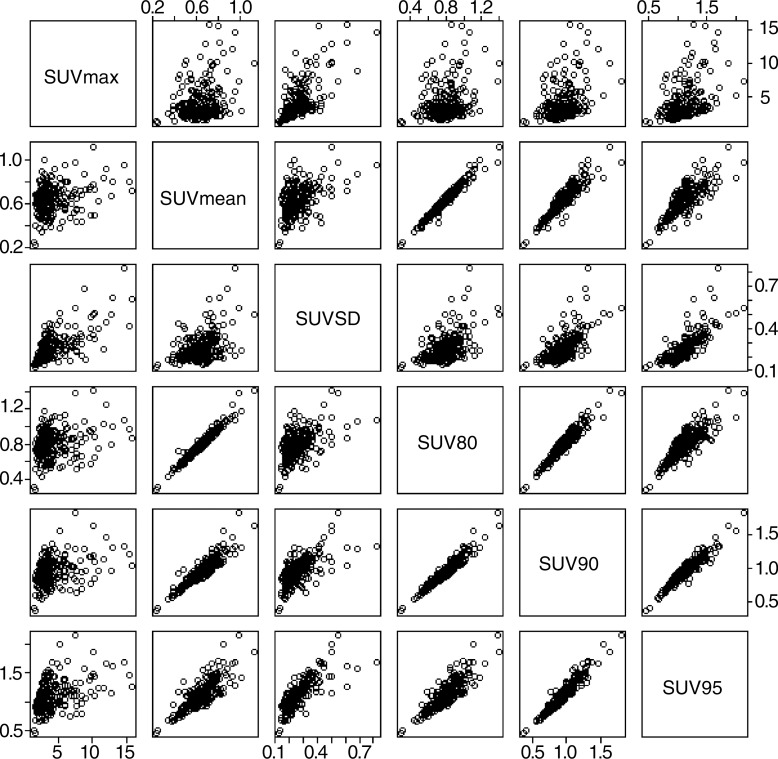
While pre-RT SUV95 yielded the strongest evidence of association with RP presence, it is warranted to note that alternative summaries of the empirical SUV distribution are expected to perform well, since these metrics are likely highly correlated with SUV95 within a patient. Figure 6 presents pairwise scatterplots of the SUV-derived metrics, demonstrating that in our study, SUV95 was indeed highly correlated with mean SUV, SUV80, and SUV90 and moderately correlated with maximum SUV and standard deviation of SUV. In essence, these variables contribute the nearly identical information. For this reason, any multivariate prediction model need not incorporate more than one. Thus, in the present work, mean SUV, maximum SUV, SUV80, and SUV90 were excluded from the multiple logistic regression analysis. Standard deviation of SUV was considered and found to be conditionally independent of RP in the presence of SUV95.
Figure 6:
Correlation among metrics derived from the empirical SUV distribution. Pairwise scatterplots of the SUV-derived metrics are shown, demonstrating correlation of SUV95 with mean SUV (SUVmean), SUV80, and SUV90. Moderate correlation with maximum SUV (SUVmax) and standard deviation of SUV (SUVSD) is also indicated.
The present study had several limitations that warrant further evaluation. The time from pretreatment PET to radiation varied since this is a retrospective study. Also, pneumonitis was scored by using the medical record rather than being acquired prospectively by using validated patient reporting instruments. To improve the quality of this work, we propose a prospective study utilizing uniform image acquisition parameters, such as the National Cancer Institute’s consensus guidelines (43), and validated patient reporting instrument. Standardizing the image acquisition would reduce one source of uncertainty in the SUV values. Our finding that pre-RT FDG PET/CT provides a prognostic biomarker (SUV95) that is significantly associated with post-RT RP symptoms warrants the search for a mechanism. We hypothesize this pre-RT–enhanced FDG uptake reflects the individual variability in pulmonary inflammation resulting from environmental or infectious stimuli. Does an elevated SUV95 also indicate increased alveolar polymorphonuclear lymphocytes and inflammatory biomarkers? This question can be studied prospectively with bronchioalveolar lavage immediately following FDG PET/CT imaging (44).
The SUV95 image parameter was derived from FDG PET images acquired as part of the standard of care for esophageal cancer (45), creating the potential for broad application. In this study, patients with high FDG uptake prior to treatment were more likely to develop symptomatic RP. These findings should be independently validated with a prospectively acquired validation set. The current findings suggest the potential utility of the SUV95 as a prognostic biomarker to identify a high-risk group in whom a high incidence of RP is expected. Use of a study group with a high incidence of expected events allows clinical trials to be designed with fewer total study subjects.
Advances in Knowledge
■ An image biomarker derived from quantitative analysis of pre-treatment fluorine 18 fluorodeoxyglucose (FDG) PET/CT images helped identify high-risk group for radiation pneumonitis (RP).
■ Spatial overlap between pretreatment regions of enhanced FDG uptake and the radiation therapy (RT) dose distribution did not contribute to the risk of RP.
■ A total of 22% of the esophageal cancer patients developed symptomatic RP, a National Cancer Institute Common Terminology Criteria for Adverse Events, version 4, score of 2 or higher.
■ A monotonic relationship between the 95th percentile of the standardized uptake value (SUV95) and symptomatic RP was observed; every 0.1 unit increase in SUV95 in a given RT modality and staging interval was associated with a 1.36–fold increase in the odds of developing RP.
Implications for Patient Care
■ The SUV95 provides a method to risk-stratify study subjects in clinical trials where treatment toxicity is an end-point to ensure balance between study arms or to enrich the study cohort with expected events.
■ Findings of elevated pulmonary FDG uptake at pre-treatment staging PET/CT should alert the responsible clinician to the risk of RP.
Acknowledgments
Acknowledgments
We extend our warmest gratitude to the thoracic radiation oncology faculty, thoracic surgeons, and gastrointestinal medical oncologists at M. D. Anderson Cancer Center whose patients comprised this study.
Received March 24, 2014; revision requested April 29; revision received July 24; accepted August 18; final version accepted November 19.
Study supported in part by an NIH Director’s New Innovator Award. RC supported by an NIH Research Scientist Development Award. B.H. supported by the Cancer Center Support Grant.
Funding: This research was partially funded by the National Institutes of Health and National Cancer Institute (grants R21CA141833, DP2OD007044, K01CA181292, and P30 CA016672).
Abbreviations:
- FDG
- fluorine 18 fluorodeoxyglucose
- ROC
- receiver operating characteristic
- ROI
- region of interest
- RP
- radiation pneumonitis
- RT
- radiation therapy
- SUV
- standardized uptake value
- SUV80
- 80th percentile of the SUV
- SUV90
- 90th percentile of the SUV
- SUV95
- 95th percentile of the SUV
Disclosures of Conflicts of Interest: R.C. disclosed no relevant relationships. N.P. disclosed no relevant relationships. E.C. disclosed no relevant relationships. S.A.G. disclosed no relevant relationships. S.A. disclosed no relevant relationships. B.H. disclosed no relevant relationships. D.P. disclosed no relevant relationships. H.S. disclosed no relevant relationships. T.M.G. disclosed no relevant relationships.
References
- 1.Gross NJ. Pulmonary effects of radiation therapy. Ann Intern Med 1977;86(1):81–92. [DOI] [PubMed] [Google Scholar]
- 2.Graham MV, Purdy JA, Emami B, et al. Clinical dose-volume histogram analysis for pneumonitis after 3D treatment for non-small cell lung cancer (NSCLC). Int J Radiat Oncol Biol Phys 1999;45(2):323–329. [DOI] [PubMed] [Google Scholar]
- 3.Claude L, Pérol D, Ginestet C, et al. A prospective study on radiation pneumonitis following conformal radiation therapy in non-small-cell lung cancer: clinical and dosimetric factors analysis. Radiother Oncol 2004;71(2):175–181. [DOI] [PubMed] [Google Scholar]
- 4.Rancati T, Ceresoli GL, Gagliardi G, Schipani S, Cattaneo GM. Factors predicting radiation pneumonitis in lung cancer patients: a retrospective study. Radiother Oncol 2003;67(3):275–283. [DOI] [PubMed] [Google Scholar]
- 5.Rodrigues G, Lock M, D’Souza D, Yu E, Van Dyk J. Prediction of radiation pneumonitis by dose: volume histogram parameters in lung cancer—a systematic review. Radiother Oncol 2004;71(2):127–138. [DOI] [PubMed] [Google Scholar]
- 6.Taghian AG, Assaad SI, Niemierko A, et al. Risk of pneumonitis in breast cancer patients treated with radiation therapy and combination chemotherapy with paclitaxel. J Natl Cancer Inst 2001;93(23):1806–1811. [DOI] [PubMed] [Google Scholar]
- 7.Guerrero T, Martinez J, McCurdy MR, Wolski M, McAleer MF. Elevation in exhaled nitric oxide predicts for radiation pneumonitis. Int J Radiat Oncol Biol Phys 2012;82(2):981–988. [DOI] [PMC free article] [PubMed] [Google Scholar]
- 8.Barriger RB, Fakiris AJ, Hanna N, Yu M, Mantravadi P, McGarry RC. Dose-volume analysis of radiation pneumonitis in non-small-cell lung cancer patients treated with concurrent cisplatinum and etoposide with or without consolidation docetaxel. Int J Radiat Oncol Biol Phys 2010;78(5):1381–1386. [DOI] [PubMed] [Google Scholar]
- 9.Frankovich J, Donaldson SS, Lee Y, Wong RM, Amylon M, Verneris MR. High-dose therapy and autologous hematopoietic cell transplantation in children with primary refractory and relapsed Hodgkin’s disease: atopy predicts idiopathic diffuse lung injury syndromes. Biol Blood Marrow Transplant 2001;7(1):49–57. [DOI] [PubMed] [Google Scholar]
- 10.Cordier JF, Mornex JF, Lasne Y, et al. Bronchoalveolar lavage in radiation pneumonitis. Bull Eur Physiopathol Respir 1984;20(4):369–374. [PubMed] [Google Scholar]
- 11.Mark E. Lung biopsy interpretation. Baltimore, Md: Williams & Wilkins, 1984. [Google Scholar]
- 12.Rubin P, Johnston CJ, Williams JP, McDonald S, Finkelstein JN. A perpetual cascade of cytokines postirradiation leads to pulmonary fibrosis. Int J Radiat Oncol Biol Phys 1995;33(1):99–109. [DOI] [PubMed] [Google Scholar]
- 13.Rübe CE, Palm J, Erren M, et al. Cytokine plasma levels: reliable predictors for radiation pneumonitis? PLoS ONE 2008;3(8):e2898. [DOI] [PMC free article] [PubMed] [Google Scholar]
- 14.Levy BD, Serhan CN. Resolution of acute inflammation in the lung. Annu Rev Physiol 2014;76:467–492. [DOI] [PMC free article] [PubMed] [Google Scholar]
- 15.Nathan C, Ding A. Nonresolving inflammation. Cell 2010;140(6):871–882. [DOI] [PubMed] [Google Scholar]
- 16.Hart JP, McCurdy MR, Ezhil M, et al. Radiation pneumonitis: correlation of toxicity with pulmonary metabolic radiation response. Int J Radiat Oncol Biol Phys 2008;71(4):967–971. [DOI] [PMC free article] [PubMed] [Google Scholar]
- 17.Makimoto T, Tsuchiya S, Hayakawa K, Saitoh R, Mori M. Risk factors for severe radiation pneumonitis in lung cancer. Jpn J Clin Oncol 1999;29(4):192–197. [DOI] [PubMed] [Google Scholar]
- 18.Sanuki N, Ono A, Komatsu E, et al. Association of computed tomography-detected pulmonary interstitial changes with severe radiation pneumonitis for patients treated with thoracic radiotherapy. J Radiat Res (Tokyo) 2012;53(1):110–116. [DOI] [PubMed] [Google Scholar]
- 19.Yamashita H, Kobayashi-Shibata S, Terahara A, et al. Prescreening based on the presence of CT-scan abnormalities and biomarkers (KL-6 and SP-D) may reduce severe radiation pneumonitis after stereotactic radiotherapy. Radiat Oncol 2010;5:32. [DOI] [PMC free article] [PubMed] [Google Scholar]
- 20.Jones HA, Clark RJ, Rhodes CG, Schofield JB, Krausz T, Haslett C. In vivo measurement of neutrophil activity in experimental lung inflammation. Am J Respir Crit Care Med 1994;149(6):1635–1639. [DOI] [PubMed] [Google Scholar]
- 21.Chen DL, Rosenbluth DB, Mintun MA, Schuster DP. FDG-PET imaging of pulmonary inflammation in healthy volunteers after airway instillation of endotoxin. J Appl Physiol (1985) 2006;100(5):1602–1609. [DOI] [PubMed] [Google Scholar]
- 22.Chen DL, Ferkol TW, Mintun MA, Pittman JE, Rosenbluth DB, Schuster DP. Quantifying pulmonary inflammation in cystic fibrosis with positron emission tomography. Am J Respir Crit Care Med 2006;173(12):1363–1369. [DOI] [PMC free article] [PubMed] [Google Scholar]
- 23.Jones HA, Sriskandan S, Peters AM, et al. Dissociation of neutrophil emigration and metabolic activity in lobar pneumonia and bronchiectasis. Eur Respir J 1997;10(4):795–803. [PubMed] [Google Scholar]
- 24.Chen DL, Bedient TJ, Kozlowski J, et al. [18F]fluorodeoxyglucose positron emission tomography for lung antiinflammatory response evaluation. Am J Respir Crit Care Med 2009;180(6):533–539. [DOI] [PMC free article] [PubMed] [Google Scholar]
- 25.Chen DL, Schuster DP. Positron emission tomography with [18F]fluorodeoxyglucose to evaluate neutrophil kinetics during acute lung injury. Am J Physiol Lung Cell Mol Physiol 2004;286(4):L834–L840. [DOI] [PubMed] [Google Scholar]
- 26.Petit SF, van Elmpt WJC, Oberije CJG, et al. [¹⁸F]fluorodeoxyglucose uptake patterns in lung before radiotherapy identify areas more susceptible to radiation-induced lung toxicity in non-small-cell lung cancer patients. Int J Radiat Oncol Biol Phys 2011;81(3):698–705. [DOI] [PubMed] [Google Scholar]
- 27.Strauss LG, Conti PS. The applications of PET in clinical oncology. J Nucl Med 1991;32(4):623–648; discussion 649–650. [PubMed] [Google Scholar]
- 28.Castillo E, Castillo R, White B, Rojo J, Guerrero T. Least median of squares filtering of locally optimal point matches for compressible flow image registration. Phys Med Biol 2012;57(15):4827–4833. [DOI] [PMC free article] [PubMed] [Google Scholar]
- 29.Ourselin S, Roche A, Prima S, Ayache N. Block matching: a general framework to improve robustness of rigid registration of medical images. In: Delp S, DiGoia A, Jaramaz B, eds. Medical Image Computing and Computer-Assisted Intervention–MICCAI 2000. Berlin, Germany: Springer-Verlag, 2000; 557–566. [Google Scholar]
- 30.Osman MM, Cohade C, Nakamoto Y, Wahl RL. Respiratory motion artifacts on PET emission images obtained using CT attenuation correction on PET-CT. Eur J Nucl Med Mol Imaging 2003;30(4):603–606. [DOI] [PubMed] [Google Scholar]
- 31.Nestle U, Hellwig D, Schmidt S, et al. 2-Deoxy-2-[18F]fluoro-D-glucose positron emission tomography in target volume definition for radiotherapy of patients with non-small-cell lung cancer. Mol Imaging Biol 2002;4(3):257–263. [DOI] [PubMed] [Google Scholar]
- 32.Proschan MA, Waclawiw MA. Practical guidelines for multiplicity adjustment in clinical trials. Control Clin Trials 2000;21(6):527–539. [DOI] [PubMed] [Google Scholar]
- 33.Akaike H. A new look at the statistical model identification. IEEE Trans Automat Contr 1974;19(6):716–723. [Google Scholar]
- 34.Nagelkerke NJD. A note on a general definition of the coefficient of determination. Biometrika 1991;78(3):691–692. [Google Scholar]
- 35.DeLong ER, DeLong DM, Clarke-Pearson DL. Comparing the areas under two or more correlated receiver operating characteristic curves: a nonparametric approach. Biometrics 1988;44(3):837–845. [PubMed] [Google Scholar]
- 36.Youden WJ. Index for rating diagnostic tests. Cancer 1950;3(1):32–35. [DOI] [PubMed] [Google Scholar]
- 37.McCulloch C, Searle S, Neuhaus J. Generalized, linear, and mixed models. 2nd ed. Hoboken, NJ: Wiley, 2008. [Google Scholar]
- 38.Bland JM, Altman DG. Statistical methods for assessing agreement between two methods of clinical measurement. Lancet 1986;1(8476):307–310. [PubMed] [Google Scholar]
- 39.Wang D, Li B, Wang Z, et al. Functional dose-volume histograms for predicting radiation pneumonitis in locally advanced non-small cell lung cancer treated with late-course accelerated hyperfractionated radiotherapy. Exp Ther Med 2011;2(5):1017–1022. [DOI] [PMC free article] [PubMed] [Google Scholar]
- 40.Kocak Z, Borst GR, Zeng J, et al. Prospective assessment of dosimetric/physiologic-based models for predicting radiation pneumonitis. Int J Radiat Oncol Biol Phys 2007;67(1):178–186. [DOI] [PMC free article] [PubMed] [Google Scholar]
- 41.Barnett GC, Coles CE, Elliott RM, et al. Independent validation of genes and polymorphisms reported to be associated with radiation toxicity: a prospective analysis study. Lancet Oncol 2012;13(1):65–77. [DOI] [PubMed] [Google Scholar]
- 42.Voets AM, Oberije C, Struijk RB, et al. No association between TGF-β1 polymorphisms and radiation-induced lung toxicity in a European cohort of lung cancer patients. Radiother Oncol 2012;105(3):296–298. [DOI] [PubMed] [Google Scholar]
- 43.Shankar LK, Hoffman JM, Bacharach S, et al. Consensus recommendations for the use of 18F-FDG PET as an indicator of therapeutic response in patients in National Cancer Institute Trials. J Nucl Med 2006;47(6):1059–1066. [PubMed] [Google Scholar]
- 44.Chen DL, Schuster DP. Imaging pulmonary inflammation with positron emission tomography: a biomarker for drug development. Mol Pharm 2006;3(5):488–495. [DOI] [PubMed] [Google Scholar]
- 45.Ajani JA, Barthel JS, Bentrem DJ, et al. Esophageal and esophagogastric junction cancers. J Natl Compr Canc Netw 2011;9(8):830–887. [DOI] [PubMed] [Google Scholar]


