This study demonstrates the possibility of engineering an MR imaging reporter gene into oncolytic viruses that is detectable with chemical exchange saturation transfer MR imaging at acute stages of viral infection and does not interfere with viral replication or therapeutic effectiveness.
Abstract
Purpose
To (a) evaluate whether the lysine-rich protein (LRP) magnetic resonance (MR) imaging reporter gene can be engineered into G47Δ, a herpes simplex–derived oncolytic virus that is currently being tested in clinical trials, without disrupting its therapeutic effectiveness and (b) establish the ability of chemical exchange saturation transfer (CEST) MR imaging to demonstrate G47Δ-LRP.
Materials and Methods
The institutional subcommittee for research animal care approved all in vivo procedures. Oncolytic herpes simplex virus G47Δ, which carried the LRP gene, was constructed and tested for its capacity to replicate in cancer cells and express LRP in vitro. The LRP gene was detected through CEST imaging of lysates derived from cells infected with G47Δ-LRP or the control G47Δ–empty virus. G47Δ-LRP was then tested for its therapeutic effectiveness and detection with CEST MR imaging in vivo. Images of rat gliomas were acquired before and 8–10 hours after injection of G47Δ-LRP (n = 7) or G47Δ–empty virus (n = 6). Group comparisons were analyzed with a paired t test.
Results
No significant differences were observed in viral replication or therapeutic effectiveness between G47Δ-LRP and G47Δ–empty virus. An increase in CEST image contrast was observed in cell lysates (mean ± standard deviation, 0.52% ± 0.06; P = .01) and in tumors (1.1% ± 0.3, P = .02) after infection with G47Δ-LRP but not G47Δ–empty viruses. No histopathologic differences were observed between tumors infected with G47Δ-LRP and G47Δ–empty virus.
Conclusion
This study has demonstrated the ability of CEST MR imaging to show G47Δ-LRP at acute stages of viral infection. The introduction of the LRP transgene had no effect on the viral replication or therapeutic effectiveness. This can aid in development of the LRP gene as a reporter for the real-time detection of viral spread.
© RSNA, 2015
Introduction
The ability of chemical exchange saturation transfer (CEST) magnetic resonance (MR) imaging to demonstrate proteins opens new avenues for imaging biological therapeutics by using protein reporters. With CEST, selective radiofrequency pulses are used to saturate the magnetization of protein-exchangeable protons, which, owing to fast chemical exchange with bulk water protons, results in a decreased water MR imaging signal (1,2). We have previously shown that CEST MR imaging could be used to image tumor cells stably transfected with the lysine-rich protein (LRP) gene (3).
Oncolytic viruses selectively infect and replicate in tumor cells, lyse them, and release viral progeny that spreads to new cancer cells. Oncolytic viruses have potential for improving the treatment of incurable cancers, such as glioblastoma multiforme (4,5). However, while the safety was proven in the first forays into clinical trials to test the toxicity of oncolytic viruses in patients with glioblastoma multiforme, the therapeutic effectiveness was curtailed because of the differential susceptibility of cancer cells to infection by the oncolytic virus strains being used, the presence of host antiviral immunity, and the inefficient spread of the virus in the extracellular tumor matrix (4,5). New advancements in the field of oncolytic virotherapy have overcome some of these limitations, providing increased relevance for oncolytic viruses as a tool for successful anticancer treatments. Oncolytic virotherapy is in phase I clinical trials for brain tumors and phase III clinical trials for tumors outside the brain (6), and it is receiving increased attention from pharmaceutical companies for translation into mainstream cancer therapy (7). It is believed that if the full replicating and spreading potential of oncolytic viruses is achieved in vivo, oncolytic virotherapy could change the prognosis of currently incurable cancers (5,7). Pharmaceutical means to increase oncolytic virus intratumoral spread and persistence, such as immune-suppressive chemotherapeutic drugs, immune-chelating agents, and disruptors of the tumor extracellular matrix, are being investigated in preclinical (4,5,8) and clinical (9) studies. However, the lack of means to noninvasively monitor oncolytic virus delivery constitutes an important limitation in evaluating the outcome of these therapeutic strategies.
The purpose of this work was (a) to evaluate whether the LRP MR imaging reporter gene can be engineered into G47Δ (10), a herpes simplex–derived oncolytic virus that is currently being tested in clinical trials (11), without disrupting its therapeutic effectiveness, and (b) to establish the ability of CEST MR imaging to demonstrate G47Δ-LRP.
Materials and Methods
Cell Lines
Monkey kidney Vero and 9L rat glioma cells (ATCC, Manassas, Va) were grown in Dulbecco’s modified Eagle’s medium supplemented with 10% fetal calf serum. D74/HveC rat glioma cells were previously transduced to express the herpes simplex virus (HSV) HveC receptor (12) and have been a standard model for oncolytic HSV therapy in our laboratory. Cells were grown in complete Dulbecco’s modified Eagle’s medium supplemented with 7.5-μg/mL blasticidin S (Calbiochem; EMD Biosciences, Billerica, Mass).
Virus Construction
The G47Δ oncolytic HSV has deleted γ34.5 and α47 genes and contains an inactivating insertion of Escherichia coli lacZ into the ICP6 locus (10). This virus is in clinical trials for glioblastoma multiforme (11) and was used as a test vector for imaging the LRP transgene through CEST MR imaging.
The LRP-coding complementary DNA was tagged with the hemagglutinin epitope (YPYDVPDYA) for Western blot detection and a Kozak sequence (ACC) to enhance protein expression. Addition of these two sequences was achieved by means of extension polymerase chain reaction by using the following primers: FW primer CGGGATCCCGACCATGCGTACCCATACGATGTTCCAGATTACGCTGCTAGCGCTACCGGACTCAGATCT and REV primer GGATATCCAAGCGGCTTCGGCCAGTAAC.
The final protein translates as N-HAtag-LRP-C, and its DNA was subcloned into the shuttle vector pVec92 (New England Biolabs, Ipswich, Mass), which allows transfer of transgenes to a specific site of the oncolytic HSV artificial chromosome G47Δ-BAC by using the Cre recombinase system (Fig E1 [online]) (13). G47Δ-BAC contains the full genome of G47Δ and was constructed to rapidly insert transgenes into the G47Δ virus by using the previously published “Flip-Flop” technology (13).
The LRP transgene was inserted under the control of the human cytomegalovirus immediate early promoter, which is activated 1 hour after viral infection (14). The final virus, G47Δ-LRP, was isolated from G47Δ-BAC as described previously (13). An empty vector, G47Δ-empty, was obtained through the same cloning technology in the absence of the LRP-coding DNA and was used as a negative control.
Correct insertion of the artificial gene was confirmed by means of restriction analysis and sequencing. Expression of the peptide was checked with the Western blot of infected cell lysates by using a rat monoclonal anti-hemagglutinin antibody (rat antihemagglutinin, 11867423001, clone 3F10; Roche, Indianapolis, Ind) and fluorescein isothiocyanate–labeled goat antirat immunoglobulin (112–095–003; Jackson Immunoresearch Laboratories, West Grove, Pa).
Both M.T.M. and A.A.G are inventors of the LRP gene, which is protected by a patent (US 8236572 B2), but this has not generated any to the project or the authors.
Burst Assay
The replication capacity of G47Δ-LRP in cancer cells in vitro was analyzed through a single–time-point burst assay. D74-HveC and 9L cells were infected with G47Δ-LRP or G47Δ–empty virus at a multiplicity of viral infection of 0.1. Twenty-four hours later, cells were lysed in phosphate buffer through three freeze-thaw sonication cycles. After centrifuging the lysates, titers of the resulting virus-containing supernatants were tested on Vero cells.
In Vitro CEST Phantom Preparation
Ten-centimeter dishes were used to plate 3 × 10⁶ D74/HveC cells. The following day, cells were infected with G47Δ-LRP or G47Δ–empty virus at a multiplicity of viral infection of 0.01. Eighteen hours later, cells were collected and lysed in radioimmunoprecipitation assay buffer. Proteins were extracted through three cycles of freeze-thaw sonication. Nonsoluble cell lysates were eliminated through centrifugation, and the remaining protein solutions were placed in 5-mm sample tubes for CEST MR imaging. To check for equal spreading between G47Δ-LRP and G47Δ–empty virus, infected cells were stained for β-galactosidase activity in a parallel experiment at the same time point as lysate collection.
In Vitro CEST Imaging
In vitro cell lysate phantoms were imaged at room temperature (20°C) in a 9.4-T MR imaging unit (Bruker BioSpin, Billerica, Mass) with a 90-mm volume transmit coil and a home-built elliptical surface receive coil (long axis, 49 mm; short axis, 23 mm). CEST and water saturation for shift referencing (WASSR) (15) images were acquired by using a rapid acquisition with relaxation enhancement (RARE) sequence with acquisition parameters of repetition time msec/echo time msec, 5/5000; matrix, 64 × 64; field of view, 40 × 40 mm; section thickness, 2 mm; RARE factor, 10; number of acquisitions, two; and a 3000-msec saturation prepulse. WASSR images were acquired with a saturation power of 0.5 μT and 21 different saturation frequency offsets ranging from −400 to +400 Hz. CEST images were acquired with a saturation power of 3.6 μT and 43 different saturation frequency offsets ranging from −2100 to +2100 Hz.
The experiment was performed three times to compare D74/HveC+G47Δ-LRP and D74/HveC+G47Δ–empty virus in duplicates. In each experiment, we tested phantoms that contained a different cell concentration: (a) 6 × 10⁶ cells per milliliter, (b) 1.2 × 10⁷ cells per milliliter, and (c) 1.8 × 10⁷ cells per milliliter. Thus, a total of six samples of cells infected with G47Δ-LRP and six with G47Δ–empty virus were analyzed. We normalized the variability of the magnetization transfer ratio asymmetry (MTRasym) due to different cellular concentration by dividing the MTRasym of the G47Δ-LRP-infected cells by the MTRasym of the G47Δ–empty virus–infected cells and averaged the MTRasym ratio that resulted from each of the three experiments.
Animal Studies
The institutional subcommittee for research animal care approved all in vivo procedures. Tumors were implanted into male Fisher-344 rats (n = 31) by using stereotaxy as described previously (12) and were grown for 7 days before injection of 106 particle-forming units of oncolytic HSV into the tumor by using the same stereotactic coordinates as for the tumor cell injections. This time point for viral injection was chosen from our preliminary data (8) and the mean tumor volume of 10 mm3, as determined by means of MR imaging. The dose of virus is standard for oncolytic HSV in preclinical experiments performed in brain tumors. Animals were then imaged (n = 13) or observed for survival evaluation (n = 18). Animals that were imaged were also analyzed in histopathologic examination.
CEST MR imaging.—Rats were anesthetized with 1.5% isoflurane (50:50 oxygen to medical air with a flow rate of 1.2 mL/min) and placed in a home-built rat imaging cradle with a 90-mm volume transmit coil and a 20-mm home-built surface receive coil 8–10 hours after virus intratumoral injection. WASSR and CEST images were acquired as described earlier, including the range of saturation offsets collected, with RARE acquisition parameters of 5/5000; matrix, 64 × 32; field of view, 20 × 20 mm; section thickness, 0.7 mm; RARE factor, 10; and number of acquisitions, two. The effective echo time was 5 msec. T1 relaxation rates measured at 9.4 T for various rat brain structures have been reported previously and ranged from 1.6 to 2.0 seconds (16). Tumors were imaged before injection of G47Δ-LRP or G47Δ–empty virus and 8–10 hours after the treatment. In 8–10 hours, the viruses remain in the center of the tumor, abundantly express early genes, and begin expressing late genes (8). However, viral particles are not yet formed, tumor cell lysis has not occurred, and the host antiviral response is predominantly limited to the expression of a few inflammatory genes, with little infiltration of macrophages at this time point (8). The tumor is thus intact, which is essential to avoid any background CEST signal intensity changes due to changes in cellular and protein composition.
Survival analysis.—Survival was compared through Kaplan-Meier analysis of animals with intracranial D74/HveC gliomas treated with control solution (phosphate-buffered saline), G47Δ–empty virus, and G47Δ-LRP in six animals each. Animals were observed daily after virus injection and were sacrificed when the animal facility staff who were blinded to the experiment indicated the animals were moribund.
Tumor histopathologic findings.—The rat brains were extracted after imaging and were fresh frozen in isopentane. Then, 6-μm-thick slices were cut throughout the whole tumor volume. The slices were stained as described previously (8) with X-gal (5-bromo-4-chloro-3-inodolyl-β-d-galactopyranoside) for the detection of virus or with anti-CD68 antibody (Abd-Serotec, Raleigh, NC) for the detection of macrophages and were counterstained with hematoxylin (8). The percentage of tumor infected by the virus and macrophage infiltration was quantified as described previously (8).
Coregistration of Histologic Findings and MR Images
All histologic tissue sections and T2-weighted MR imaging sections were independently registered to sections from the rat brain atlas (17) by using rotation, translation, and scaling operations in Photoshop (Adobe Systems, San Jose, Calif). The MTRasym maps were registered to the rat brain atlas by using the same transformation operations as used for the associated T2-weighted image section. Reference points for coregistration included the corpus callosum, outer brain boundary, and ventricles. On the basis of the rat brain atlas, the histologic findings and the MR imaging data were then coregistered. A region of interest (ROI) was drawn around the regions positive for the β-galactosidase staining and was copied onto MR images to verify overlap. The coregistration was performed by A.A.G., a scientist with 17 years of experience in MR molecular imaging and image processing.
CEST Analysis and Statistics
A detailed explanation of the CEST image processing is given in Figs E1–E4 (online). Briefly, the WASSR images were used to generate a B0 field map, which was used to correct the CEST images for B0 field inhomogeneities (18). The MTRasym, or CEST contrast, was calculated by subtracting the signal intensity of the positive saturation frequency offset, or S(ω+), from the negative offset, or S(ω−), normalized by the signal intensity acquired with no saturation pulse (S0), as given in the following equation:
MTRasym maps were generated for a frequency offset of 3.6 ppm that
corresponds to the exchangeable amide proton. Tumor ROIs (mean size, 7.7 mm2 ± 2.3; range, 5–13
mm2) were selected from the hyperintense regions of the magnetization
transfer image acquired with a saturation frequency offset of −2100 Hz. This
analysis was performed by C.T.F., an MR imaging physicist with 12 years of experience
with MR imaging, CEST, and imaging of tumor models. The mean CEST image contrast in the tumor ROI was normalized according to the contralateral hemisphere to remove
asymmetric magnetization transfer effects and to provide an objective ROI for normalization of the tumor CEST image contrast (19,20). The normalized tumor CEST image contrast is defined as  . The mean previrus
baseline CEST image contrast was compared with the mean CEST image contrast at the 8–10-hour time point for rats
infected with both G47Δ-LRP (n = 7) and G47Δ–empty virus
(n = 6). In addition, the change in tumor CEST contrast between the baseline and 8–10-hour time points was
calculated for each rat individually, and the mean change in CEST image contrast for G47Δ-LRP and G47Δ–empty virus–infected rats was
compared. Group comparisons were performed by using a paired t test,
and statistical significance was defined by using a P value less
than .05.
Results
Characterization of G47Δ-LRP
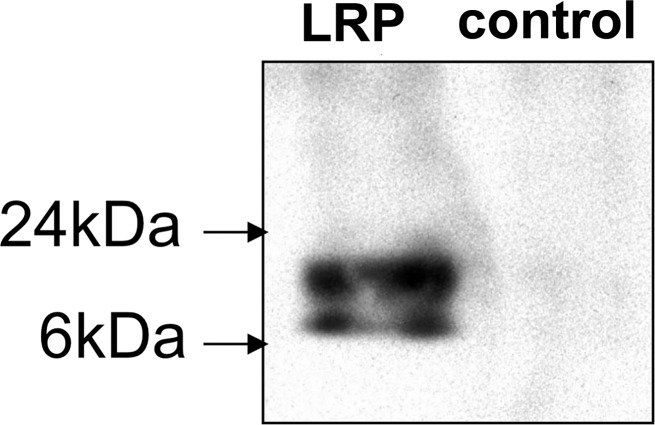
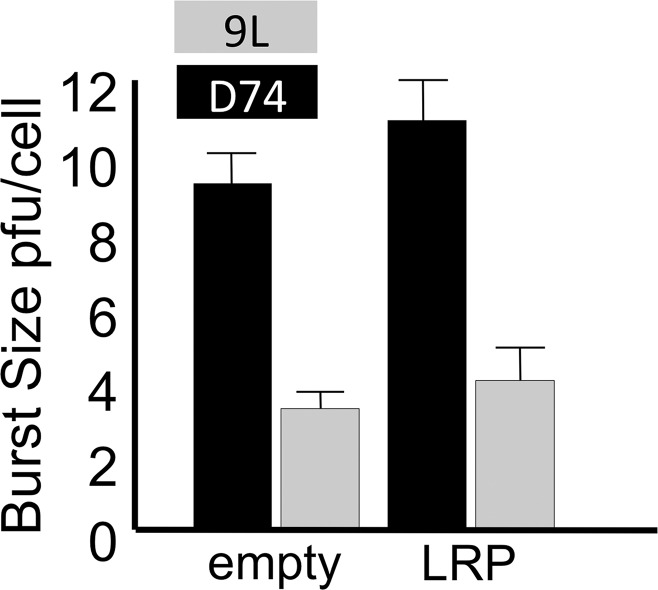
We characterized the G47Δ-LRP virus for its capacity to express the LRP gene and to replicate in cancer cells. Expression of LRP was confirmed with the Western blot (Fig 1a) and reverse transcription polymerase chain reaction (Fig E2 [online]). Through a single–time-point burst assay, we confirmed that LRP does not interfere with viral replication in cancer cells (Fig 1b). D74/HveC cells were more susceptible to HSV infection than 9L cells because they express the HSV receptor HveC and were selected for the imaging experiments.
Figure 1a:
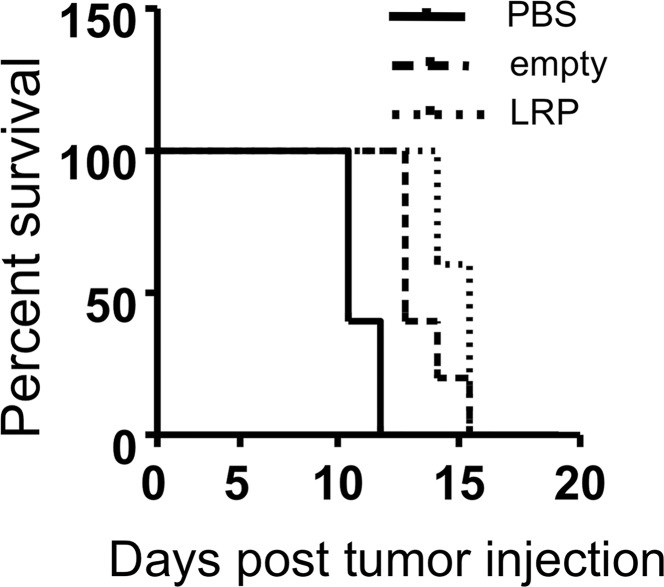
Images illustrate the characterization of G47Δ-LRP. (a) Western blot shows the LRP bands after infection of Vero cells. Bands of approximately 10 kDa and 20 kDa are seen after infection of G47Δ-LRP (left) but not control virus (right). (b) Graph depicts single–time-point burst assay of G47Δ–empty virus and G47Δ-LRP in 9L and D74/HveC rat glioma cells. The graph shows that titers of both G47Δ-LRP and G47Δ–empty virus had increased 10-fold in 24 hours in D74/HveC cells and threefold in 9L cells, indicating that addition of the LRP gene did not disrupt viral replication capacity and that the viruses replicate better in D74/HveC cells than in 9L cells. (c) Kaplan-Meier survival plot for animals with intracranial D74/HveC gliomas treated with control solution (phosphate-buffered saline [PBS]), G47Δ–empty virus, and G47Δ-LRP in six rats each. A significant difference (P = .0032) in survival (mean ± standard deviation) was observed between control animals (mean survival, 12 days ± 0.5) and animals that were treated with virus (mean survival, 15 days ± 1). No difference in survival was observed between animals treated with either G47Δ-LRP or G47Δ–empty virus (P = .1).
Figure 1b:
Images illustrate the characterization of G47Δ-LRP. (a) Western blot shows the LRP bands after infection of Vero cells. Bands of approximately 10 kDa and 20 kDa are seen after infection of G47Δ-LRP (left) but not control virus (right). (b) Graph depicts single–time-point burst assay of G47Δ–empty virus and G47Δ-LRP in 9L and D74/HveC rat glioma cells. The graph shows that titers of both G47Δ-LRP and G47Δ–empty virus had increased 10-fold in 24 hours in D74/HveC cells and threefold in 9L cells, indicating that addition of the LRP gene did not disrupt viral replication capacity and that the viruses replicate better in D74/HveC cells than in 9L cells. (c) Kaplan-Meier survival plot for animals with intracranial D74/HveC gliomas treated with control solution (phosphate-buffered saline [PBS]), G47Δ–empty virus, and G47Δ-LRP in six rats each. A significant difference (P = .0032) in survival (mean ± standard deviation) was observed between control animals (mean survival, 12 days ± 0.5) and animals that were treated with virus (mean survival, 15 days ± 1). No difference in survival was observed between animals treated with either G47Δ-LRP or G47Δ–empty virus (P = .1).
The insertion of the LRP gene did not decrease the survival of animals; the same increase in survival was observed for both G47Δ-LRP and G47Δ–empty virus–treated rats (survival ranged from 14 to 16 days, with a mean of 15 days ± 1) relative to control phosphate-buffered saline–treated rats (survival ranged from 11 to 13 days, with a mean of 12 days ± 0.5) (Fig 1c). The experiment was conducted with six rats per group, for a total of 18 rats.
Figure 1c:
Images illustrate the characterization of G47Δ-LRP. (a) Western blot shows the LRP bands after infection of Vero cells. Bands of approximately 10 kDa and 20 kDa are seen after infection of G47Δ-LRP (left) but not control virus (right). (b) Graph depicts single–time-point burst assay of G47Δ–empty virus and G47Δ-LRP in 9L and D74/HveC rat glioma cells. The graph shows that titers of both G47Δ-LRP and G47Δ–empty virus had increased 10-fold in 24 hours in D74/HveC cells and threefold in 9L cells, indicating that addition of the LRP gene did not disrupt viral replication capacity and that the viruses replicate better in D74/HveC cells than in 9L cells. (c) Kaplan-Meier survival plot for animals with intracranial D74/HveC gliomas treated with control solution (phosphate-buffered saline [PBS]), G47Δ–empty virus, and G47Δ-LRP in six rats each. A significant difference (P = .0032) in survival (mean ± standard deviation) was observed between control animals (mean survival, 12 days ± 0.5) and animals that were treated with virus (mean survival, 15 days ± 1). No difference in survival was observed between animals treated with either G47Δ-LRP or G47Δ–empty virus (P = .1).
In Vitro CEST Imaging
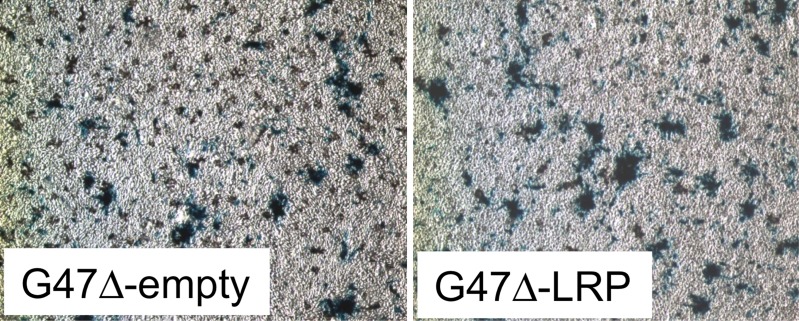
CEST MR imaging performed on in vitro cell lysates from D74/HveC cells infected with G47Δ-LRP showed a significantly (P = .01) higher MTRasym (1.52% ± 0.06) compared with G47Δ–empty virus (1.00% ± 0.02)–infected cells (Fig 2), demonstrating the ability of CEST MR imaging to show the oncolytic virus–encoded LRP reporter. No difference in viral spread was observed between cells infected with G47Δ-LRP or G47Δ–empty virus, with approximately 20% of cells infected in each case.
Figure 2a:
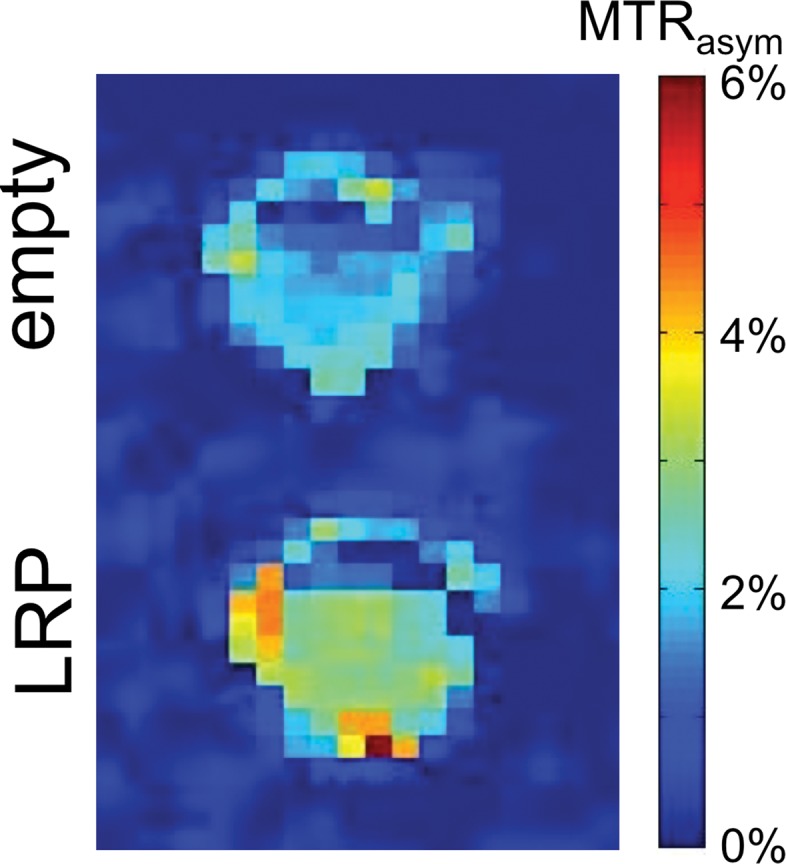
Images derived from CEST MR imaging of G47Δ–empty virus and G47Δ-LRP–infected cell lysates. (a) Representative MTRasym map for phantoms that contained lysates of D74/HveC cells infected with either G47Δ–empty virus (upper half of the image) or G47Δ-LRP (lower half of the image). (b) Graph shows quantification of the MTRasym induced by G47Δ-LRP in these cells. Significantly (P = .01) higher MTRasym was observed in D74/HveC cell lysates infected with G47Δ-LRP (1.52% ± 0.06) compared with G47Δ–empty virus (1.0% ± 0.02). (c) Photomicrographs (lacZ staining for β-galactosidase activity; original magnification, ×10) show that staining for viral β-galactosidase activity in cells infected with G47Δ-LRP or G47Δ–empty virus indicate equal spread for the two viruses (approximately 20% of cells were infected 18 hours after infection).
Figure 2b:
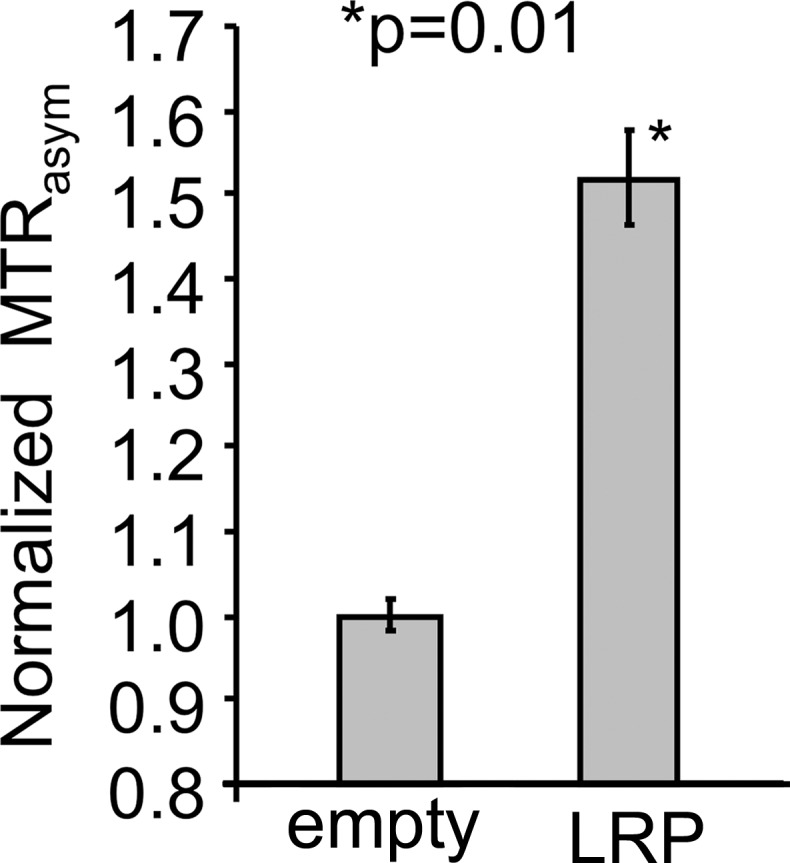
Images derived from CEST MR imaging of G47Δ–empty virus and G47Δ-LRP–infected cell lysates. (a) Representative MTRasym map for phantoms that contained lysates of D74/HveC cells infected with either G47Δ–empty virus (upper half of the image) or G47Δ-LRP (lower half of the image). (b) Graph shows quantification of the MTRasym induced by G47Δ-LRP in these cells. Significantly (P = .01) higher MTRasym was observed in D74/HveC cell lysates infected with G47Δ-LRP (1.52% ± 0.06) compared with G47Δ–empty virus (1.0% ± 0.02). (c) Photomicrographs (lacZ staining for β-galactosidase activity; original magnification, ×10) show that staining for viral β-galactosidase activity in cells infected with G47Δ-LRP or G47Δ–empty virus indicate equal spread for the two viruses (approximately 20% of cells were infected 18 hours after infection).
Figure 2c:
Images derived from CEST MR imaging of G47Δ–empty virus and G47Δ-LRP–infected cell lysates. (a) Representative MTRasym map for phantoms that contained lysates of D74/HveC cells infected with either G47Δ–empty virus (upper half of the image) or G47Δ-LRP (lower half of the image). (b) Graph shows quantification of the MTRasym induced by G47Δ-LRP in these cells. Significantly (P = .01) higher MTRasym was observed in D74/HveC cell lysates infected with G47Δ-LRP (1.52% ± 0.06) compared with G47Δ–empty virus (1.0% ± 0.02). (c) Photomicrographs (lacZ staining for β-galactosidase activity; original magnification, ×10) show that staining for viral β-galactosidase activity in cells infected with G47Δ-LRP or G47Δ–empty virus indicate equal spread for the two viruses (approximately 20% of cells were infected 18 hours after infection).
In Vivo CEST Imaging
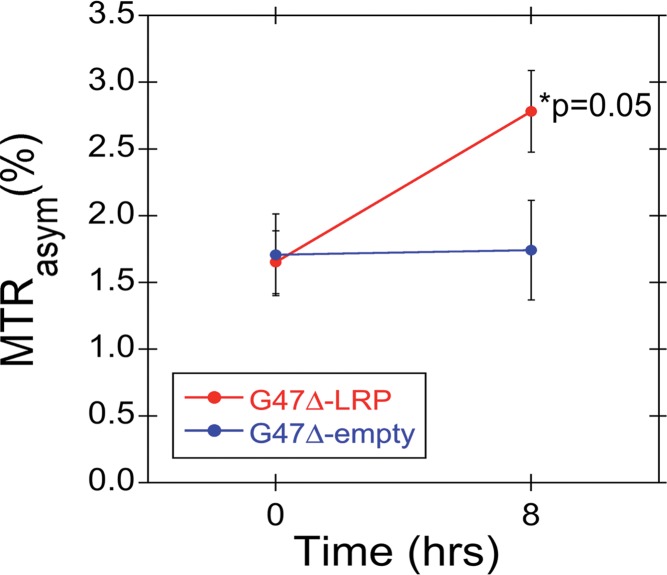
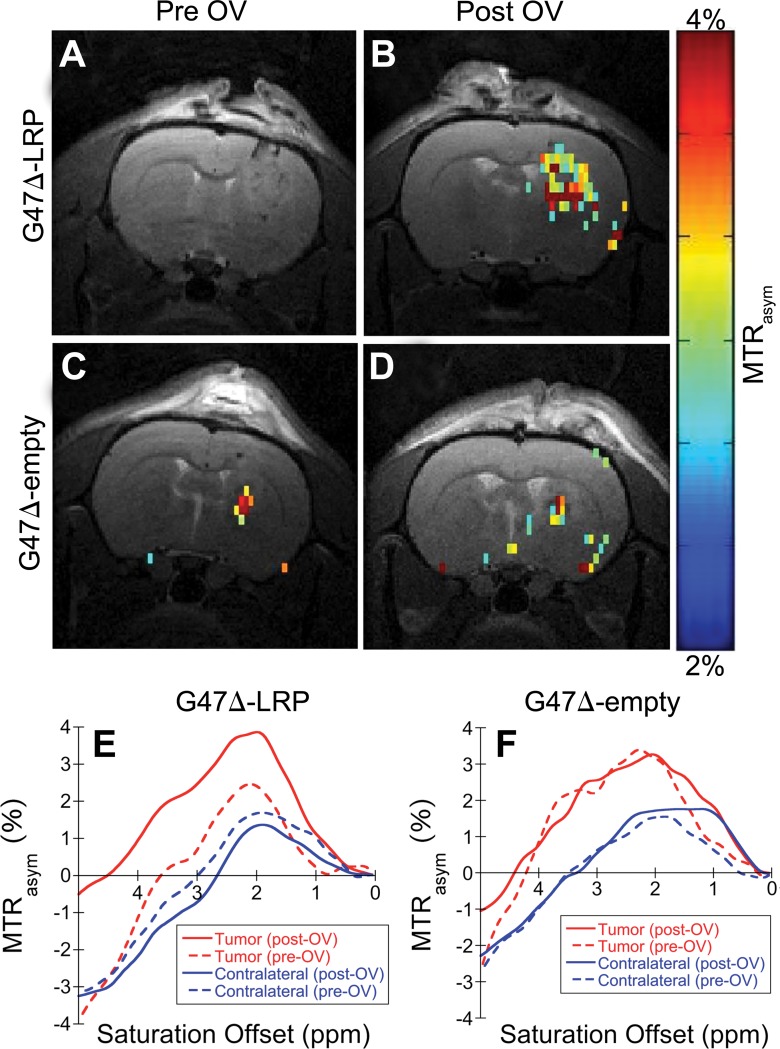
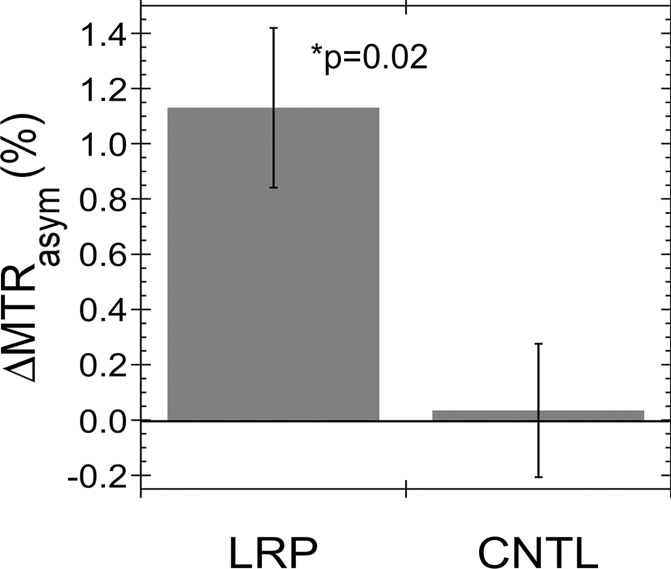
Figure E3 (online) shows representative MTRasym maps acquired before and after oncolytic virotherapy for three G47Δ-LRP and three G47Δ–empty virus–injected rats. A statistically significant (P = .02) increase in tumor MTRasym of 1.1% ± 0.3 was observed for G47Δ-LRP–infected tumors (n = 7), but not for G47Δ–empty virus–infected tumors (n = 6) (Fig 3), where the change in MTRasym was 0.0% ± 0.2. Figure 4 shows representative MTRasym maps for a saturation offset of 3.6 ppm overlaid onto the T2-weighted images for G47Δ-LRP and G47Δ–empty virus–injected rats. No significant differences were observed in the MTRasym plots as a function of saturation offset frequency for either the tumor or contralateral hemisphere in the G47Δ–empty virus–infected rat (Fig 4, F). Similarly, no differences in MTRasym plots were observed for the contralateral hemisphere of the G47Δ-LRP–infected rat (Fig 4, E). In contrast, a large shift to higher values in the MTRasym curve is observed for the tumor ROI in the G47Δ-LRP–infected rat (Fig 4, E).
Figure 3a:
Graphs show the change in MTRasym after intratumoral injection of G47Δ-LRP in vivo. (a) Graph shows the mean MTRasym (± standard error) for G47Δ-LRP (n = 7) and G47Δ–empty virus (n = 6) before and 8 hours after virus injection. MTRasym increased significantly (P = .05) from 1.7% ± 0.2 (previrus injection) to 2.8% ± 0.3 (postvirus injection) in tumors treated with G47Δ-LRP. No change in MTRasym was observed in tumors treated with G47Δ–empty virus (MTRasym of 1.7% ± 0.3 previrus injection and 1.7% ± 0.4 postvirus injection). (b) The bars of the graph indicate the mean of the MTRasym difference (ΔMTRasym) between the two time points (previrus injection and 8–10 hours postvirus injection) for each virus with a significant (P = .02) increase of 1.1% ± 0.3 observed for G47Δ-LRP–infected tumors and no increase for G47Δ–empty virus–infected tumors (0.0% ± 0.2). CNTL = control.
Figure 4:
Images depict the overlay of representative MTRasym maps onto T2-weighted anatomic images. A–D, Representative MTRasym maps (color scale) acquired with a saturation frequency offset of 3.6 ppm and overlaid onto the associated T2-weighted (gray-scale) images obtained, A, C, before and, B, D, 8 hours after injection of, B, G47Δ-LRP and, D, G47Δ–empty virus. A significant increase in MTRasym is observed after virus injection for, B, the G47Δ-LRP virus but not, D, the G47Δ–empty virus. E, F, Plots for the MTRasym as a function of the saturation frequency offset for tumor (red lines) and contralateral hemisphere (blue lines) ROIs acquired before (dashed lines) and after (solid lines) injection of, E, G47Δ-LRP and, F, G47Δ–empty virus. A significant increase in MTRasym profile after virus injection is only observed for the tumor ROI of the G47Δ-LRP–infected tumor. No significant differences are observed between previrus injections and postvirus injections for contralateral tissue ROIs or the tumor ROI of the G47Δ–empty–infected tumor. OV = oncolytic virus.
Figure 3b:
Graphs show the change in MTRasym after intratumoral injection of G47Δ-LRP in vivo. (a) Graph shows the mean MTRasym (± standard error) for G47Δ-LRP (n = 7) and G47Δ–empty virus (n = 6) before and 8 hours after virus injection. MTRasym increased significantly (P = .05) from 1.7% ± 0.2 (previrus injection) to 2.8% ± 0.3 (postvirus injection) in tumors treated with G47Δ-LRP. No change in MTRasym was observed in tumors treated with G47Δ–empty virus (MTRasym of 1.7% ± 0.3 previrus injection and 1.7% ± 0.4 postvirus injection). (b) The bars of the graph indicate the mean of the MTRasym difference (ΔMTRasym) between the two time points (previrus injection and 8–10 hours postvirus injection) for each virus with a significant (P = .02) increase of 1.1% ± 0.3 observed for G47Δ-LRP–infected tumors and no increase for G47Δ–empty virus–infected tumors (0.0% ± 0.2). CNTL = control.
Histopathologic Findings
Tumors treated with G47Δ-LRP or G47Δ–empty virus had similar sizes, similar patterns of viral distribution, and no infiltration of macrophages (Fig E4 [online]). No histopathologic differences were observed in the tumors treated with these two different viruses, suggesting that the increase in CEST image contrast for G47Δ-LRP–infected tumors is truly due to expression of LRP and not other histopathologic factors.
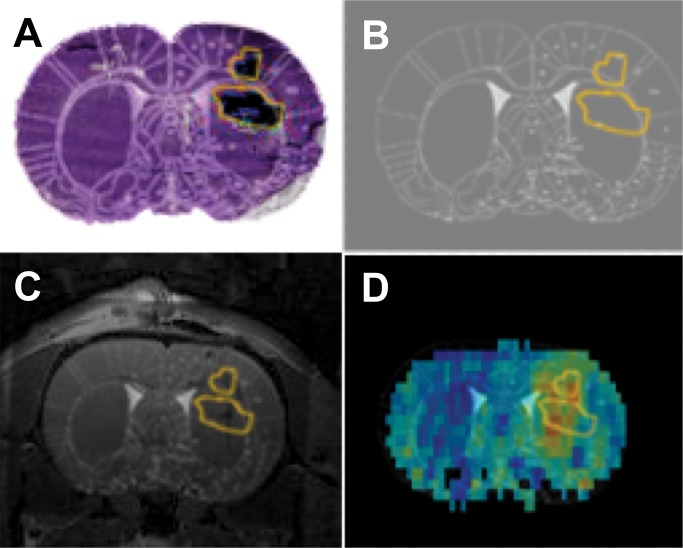
The viral spread in the tumors was heterogeneous with a mean of 40% (range, 30%–50%) of tumor volume infected (Fig E4 [online]). Similar viral heterogeneity was observed on the MTRasym maps. Coregistration of a histologic tissue section with the MTRasym map (Fig 5) demonstrated agreement between the β-galactosidase staining and regions of elevated MTRasym; the two prominent MTRasym hot spots fall partially within the two β-galactosidase–defined ROIs. The slight discrepancies in colocalization are likely due to the different slice thickness of the histologic sections (6 μm) versus CEST images (700 μm) and to tissue distortions caused by tissue sectioning.
Figure 5:
Images demonstrate coregistration of histologic findings and MR images. A, Histologic tissue slice overlaid onto the coregistered rat brain atlas tissue section. B, Overlay of the ROI encompasses the β-galactosidase–stained area of the histologic tissue slice with the rat brain atlas tissue section. C, β-galactosidase ROI overlaid onto the coregistered T2-weighted MR and rat brain atlas images. D, Coregistered β-galactosidase ROI overlaid onto the rat brain atlas section and MTRasym map.
Discussion
We have demonstrated the ability to noninvasively image an oncolytic virus at acute stages of infection by using CEST MR imaging. To date, the only other modality able to noninvasively image oncolytic virus delivery is positron emission tomography (PET), which involves the use of radiotracer analogs of thymidine that are phosphorylated by the viral thymidine kinase, leading to radiotracer retention (21–23). However, the use of exogenous tracers for oncolytic virus imaging has several disadvantages: (a) changes in tumor vascular permeability, which occur during tumor growth or are induced by antiangiogenic therapy, for example, can lead to changes in tracer uptake that are unrelated to viral infection; (b) radiotracer retention in tumors can occur because of nonspecific retention in the extracellular tumor matrix; (c) cellular uptake of radiotracers is cell line dependent (24); and (d) endogenous kinases can cause nonspecific radiotracer retention in uninfected cells (24). The use of a virally incorporated CEST reporter gene that does not require the use of tracers for imaging circumvents all the complications encountered with PET. CEST MR imaging is also noninvasive, involves no ionizing radiation, can be gated on or off by using radiofrequency pulses, provides higher-resolution images than PET, and is inherently coregistered to the anatomic MR images.
With this study, we demonstrated that LRP has potential for the development of oncolytic virus diagnostic strategies because it (a) does not affect viral replication or therapeutic effectiveness, (b) does not induce inflammatory reactions in the host, and (c) is detectable with CEST MR imaging. In the present form, however, clinical application of LRP CEST MR imaging is challenging. Distiguishing LRP-induced CEST image contrast from the endogenous tumor CEST image contrast requires knowledge of the tumor background image contrast. Our study was performed at an early time after virus infection, when physiopathologic responses to the therapy that could alter the background CEST image contrast have not yet occurred (8). In the real clinical scenario the diagnosis of the therapy is required at later time points after virus injection—that is, when the treatment will have induced tumor necrosis and inflammation. These phenomena may affect the background CEST contrast and confound the analysis of viral spread, suggesting a need to improve the specificity and sensitivity of LRP CEST MR imaging.
Increased specificity is achievable by enhancing the LRP CEST signal while suppressing the endogenous tumor background CEST signal. Suppression of the background tumor CEST image contrast might be accomplished through use of the recently developed frequency-labeled exchange transfer CEST method (25,26) that can selectively image fast exchanging protons of a reporter protein like LRP (exchange rate of approximately 400 Hz) (27), while suppressing the signal from slower exchanging protons of endogenous tumor proteins (exchange rate of 28 Hz) (28).
Increased LRP CEST signal intensity can also be obtained by improving the LRP reporter gene. The large number of lysine repeats of the LRP transgene causes recombination events that lead to expression of a truncated LRP with fewer lysine residues. We estimate that only one-eighth of the viruses express full-length LRP. A LRP protein that breaks up the repetitive pattern of these lysine sequences and expresses only full-length protein could increase the LRP CEST image contrast by a factor of two or more. We note that an increased CEST image contrast of 4.7% was observed in our previous study of a 9L tumor cell line that was engineered to stably express the LRP reporter (3). The fact that we observed a smaller increase in the MTRasym of only 1.1% with our LRP-expressing virus is reasonable given that (a) on average, only 40% of the tumor volume was found to be infected with virus and (b) multiple replication cycles of the virus cause the formation of more frequent recombination events in the gene, and thus a larger fraction of truncated LRP proteins, than is the case for the LRP expressing 9L tumor cells. With a redesigned LRP reporter that is less susceptible to recombination events, we therefore expect to be able to achieve similar CEST image contrast as obtained with the LRP-expressing 9L tumor model. Finally, higher CEST specificity could also be achieved through the use of reporter proteins that produce signal intensity at other resonance frequencies than that of the amide protons at 3.6 ppm (29).
Oncolytic viruses are now in phase III clinical trials and are receiving increasing attention from pharmaceutical companies for development as anticancer agents. However, the delivery and longitudinal spread of oncolytic viruses remains largely inefficient in many cases, and combination therapies are being tested to improve the outcome of oncolytic virus therapies. Given the clear path for achieving further improvements in the CEST specificity and sensitivity, the CEST MR imaging reporter gene represents a promising new diagnostic tool for monitoring the effectiveness of such combination therapies. Such a diagnostic tool would greatly aid the advancement of a promising therapy for patients with cancer.
In summary, this study demonstrates the possibility of engineering an MR imaging reporter gene into oncolytic viruses that is detectable with CEST MR imaging at acute stages of viral infection and does not interfere with viral replication or therapeutic effectiveness. While further improvements in the CEST sensitivity and specificity will be required for clinical translation and imaging of late stages of viral infection, the CEST reporter gene represents a promising approach for the in vivo assessment of the effectiveness of biological therapeutics.
Advances in Knowledge
■ Chemical exchange saturation transfer (CEST) MR imaging can be used with a reporter gene to image the delivery of replicating oncolytic viruses used in cancer therapy.
■ The lysine-rich protein (LRP) CEST MR imaging reporter gene can be engineered into an oncolytic herpes simplex virus (HSV) without disrupting the viral replication capacity in vitro.
■ The LRP does not induce tumor inflammation and does not disrupt the therapeutic effectiveness of the virus in vivo.
■ CEST MR imaging of phantoms that contain tumor cell lysates showed significantly greater magnetization transfer ratio asymmetry (MTRasym) for tumors infected with LRP-expressing oncolytic HSV (1.52% ± 0.06) than for tumors infected with control empty virus (1.00% ± 0.02, P = .01).
■ A statistically significant increase of 1.1% ± 0.3 in the MTRasym was observed in vivo in rat brain tumors for LRP-expressing virus infected tumors (n = 7), while no increase (0.0% ± 0.2, P = .02) was observed for control virus–infected tumors (n = 6).
SUPPLEMENTAL FIGURES
Received February 23, 2014; revision requested April 25; revision received May 29; accepted July 9; final version accepted December 10.
Supported by Massachusetts General Hospital (MGH) ECOR-ISF and MGH Cancer Center Thematic Priority Award.
Funding: This research was supported by the National Institutes of Health (grant R21 CA135526).
See also Science to Practice in this issue.
Abbreviations:
- CEST
- chemical exchange saturation transfer
- HSV
- herpes simplex virus
- LRP
- lysine-rich protein
- MTRasym
- magnetization transfer ratio asymmetry
- RARE
- rapid acquisition with relaxation enhancement
- ROI
- region of interest
- WASSR
- water saturation for shift referencing
Disclosures of Conflicts of Interest: C.T.F. disclosed no relevant relationships. J.S.B. disclosed no relevant relationships. G.L. disclosed no relevant relationships. A.K. disclosed no relevant relationships. M.L.M.L. disclosed no relevant relationships. M.T.M. Activities related to the present article: disclosed no relevant relationships. Activities not related to the present article: disclosed no relevant relationships. Other relationships: author has a patent for a new class of reporter genes for MR imaging based on CEST, and author is one of the four founders of senCEST. A.A.G. Activities related to the present article: disclosed no relevant relationships. Activities not related to the present article: disclosed no relevant relationships. Other relationships: author has a patent broadly relevant to the work. G.F. disclosed no relevant relationships.
References
- 1.Sherry AD, Woods M. Chemical exchange saturation transfer contrast agents for magnetic resonance imaging. Annu Rev Biomed Eng 2008;10:391–411. [DOI] [PMC free article] [PubMed] [Google Scholar]
- 2.van Zijl PC, Yadav NN. Chemical exchange saturation transfer (CEST): what is in a name and what isn’t? Magn Reson Med 2011;65(4):927–948. [DOI] [PMC free article] [PubMed] [Google Scholar]
- 3.Gilad AA, McMahon MT, Walczak P, et al. Artificial reporter gene providing MRI contrast based on proton exchange. Nat Biotechnol 2007;25(2):217–219. [DOI] [PubMed] [Google Scholar]
- 4.Fulci G, Chiocca EA. The status of gene therapy for brain tumors. Expert Opin Biol Ther 2007;7(2):197–208. [DOI] [PMC free article] [PubMed] [Google Scholar]
- 5.Russell SJ, Peng KW, Bell JC. Oncolytic virotherapy. Nat Biotechnol 2012;30(7):658–670. [DOI] [PMC free article] [PubMed] [Google Scholar]
- 6.Heo J, Reid T, Ruo L, et al. Randomized dose-finding clinical trial of oncolytic immunotherapeutic vaccinia JX-594 in liver cancer. Nat Med 2013;19(3):329–336. [DOI] [PMC free article] [PubMed] [Google Scholar]
- 7.Kirn DH. Redemption for the field of oncolytic virotherapy. Mol Ther 2011;19(4):627–628. [DOI] [PMC free article] [PubMed] [Google Scholar]
- 8.Fulci G, Breymann L, Gianni D, et al. Cyclophosphamide enhances glioma virotherapy by inhibiting innate immune responses. Proc Natl Acad Sci U S A 2006;103(34):12873–12878. [DOI] [PMC free article] [PubMed] [Google Scholar]
- 9.Dispenzieri A. Vaccine therapy with or without cyclophosphamide in treating patients with recurrent or refractory multiple myeloma. ClinicalTrials.gov: NCT00450814. Rochester, Minn: Mayo Clinic, 2007–2014. [Google Scholar]
- 10.Todo T, Martuza RL, Rabkin SD, Johnson PA. Oncolytic herpes simplex virus vector with enhanced MHC class I presentation and tumor cell killing. Proc Natl Acad Sci U S A 2001;98(11):6396–6401. [DOI] [PMC free article] [PubMed] [Google Scholar]
- 11.Todo T. A clinical study of a replication-competent, recombinant herpes simplex virus type 1 (G47delta) in patients with progressive glioblastoma. Japan: Japan Primary Registries Network (Internet), Wako-shi (Saitama), National Institute of Public Health; 2009. http://appswhoint/trialsearch/trialaspx?trialid=JPRN-UMIN000002661. 2008 Oct 16. Identifier JPRN-UMIN000002661. [Google Scholar]
- 12.Wakimoto H, Fulci G, Tyminski E, Chiocca EA. Altered expression of antiviral cytokine mRNAs associated with cyclophosphamide’s enhancement of viral oncolysis. Gene Ther 2004;11(2):214–223. [DOI] [PMC free article] [PubMed] [Google Scholar]
- 13.Kuroda T, Martuza RL, Todo T, Rabkin SD. Flip-Flop HSV-BAC: bacterial artificial chromosome based system for rapid generation of recombinant herpes simplex virus vectors using two independent site-specific recombinases. BMC Biotechnol 2006;6:40. [DOI] [PMC free article] [PubMed] [Google Scholar]
- 14.Ma Y, Wang N, Li M, et al. Human CMV transcripts: an overview. Future Microbiol 2012;7(5):577–593. [DOI] [PubMed] [Google Scholar]
- 15.Kim M, Gillen J, Landman BA, Zhou J, van Zijl PC. Water saturation shift referencing (WASSR) for chemical exchange saturation transfer (CEST) experiments. Magn Reson Med 2009;61(6):1441–1450. [DOI] [PMC free article] [PubMed] [Google Scholar]
- 16.de Graaf RA, Brown PB, McIntyre S, Nixon TW, Behar KL, Rothman DL. High magnetic field water and metabolite proton T1 and T2 relaxation in rat brain in vivo. Magn Reson Med 2006;56(2):386–394. [DOI] [PubMed] [Google Scholar]
- 17.Paxinos G, Watson CR, Emson PC. AChE-stained horizontal sections of the rat brain in stereotaxic coordinates. J Neurosci Methods 1980;3(2):129–149. [DOI] [PubMed] [Google Scholar]
- 18.Liu G, Gilad AA, Bulte JW, van Zijl PC, McMahon MT. High-throughput screening of chemical exchange saturation transfer MR contrast agents. Contrast Media Mol Imaging 2010;5(3):162–170. [DOI] [PMC free article] [PubMed] [Google Scholar]
- 19.Zhou J, Lal B, Wilson DA, Laterra J, van Zijl PC. Amide proton transfer (APT) contrast for imaging of brain tumors. Magn Reson Med 2003;50(6):1120–1126. [DOI] [PubMed] [Google Scholar]
- 20.Augustinack JC, Helmer K, Huber KE, Kakunoori S, Zöllei L, Fischl B. Direct visualization of the perforant pathway in the human brain with ex vivo diffusion tensor imaging. Front Hum Neurosci 2010;4:42. [DOI] [PMC free article] [PubMed] [Google Scholar]
- 21.Alauddin MM, Conti PS. Synthesis and preliminary evaluation of 9-(4-[18F]-fluoro-3-hydroxymethylbutyl)guanine ([18F]FHBG): a new potential imaging agent for viral infection and gene therapy using PET. Nucl Med Biol 1998;25(3):175–180. [DOI] [PubMed] [Google Scholar]
- 22.Yaghoubi S, Barrio JR, Dahlbom M, et al. Human pharmacokinetic and dosimetry studies of [(18)F]FHBG: a reporter probe for imaging herpes simplex virus type-1 thymidine kinase reporter gene expression. J Nucl Med 2001;42(8):1225–1234. [PubMed] [Google Scholar]
- 23.Buursma AR, Rutgers V, Hospers GA, Mulder NH, Vaalburg W, de Vries EF. 18F-FEAU as a radiotracer for herpes simplex virus thymidine kinase gene expression: in-vitro comparison with other PET tracers. Nucl Med Commun 2006;27(1):25–30. [DOI] [PubMed] [Google Scholar]
- 24.de Vries EF, van Waarde A, Harmsen MC, Mulder NH, Vaalburg W, Hospers GA. [(11)C]FMAU and [(18)F]FHPG as PET tracers for herpes simplex virus thymidine kinase enzyme activity and human cytomegalovirus infections. Nucl Med Biol 2000;27(2):113–119. [DOI] [PubMed] [Google Scholar]
- 25.Yadav NN, Jones CK, Xu J, et al. Detection of rapidly exchanging compounds using on-resonance frequency-labeled exchange (FLEX) transfer. Magn Reson Med 2012;68(4):1048–1055. [DOI] [PMC free article] [PubMed] [Google Scholar]
- 26.Yadav NN, Jones CK, Hua J, Xu J, van Zijl PC. Imaging of endogenous exchangeable proton signals in the human brain using frequency labeled exchange transfer imaging. Magn Reson Med 2013;69(4):966–973. [DOI] [PMC free article] [PubMed] [Google Scholar]
- 27.McMahon MT, Gilad AA, Zhou J, Sun PZ, Bulte JW, van Zijl PC. Quantifying exchange rates in chemical exchange saturation transfer agents using the saturation time and saturation power dependencies of the magnetization transfer effect on the magnetic resonance imaging signal (QUEST and QUESP): Ph calibration for poly-L-lysine and a starburst dendrimer. Magn Reson Med 2006;55(4):836–847. [DOI] [PMC free article] [PubMed] [Google Scholar]
- 28.Zhou J, Tryggestad E, Wen Z, et al. Differentiation between glioma and radiation necrosis using molecular magnetic resonance imaging of endogenous proteins and peptides. Nat Med 2011;17(1):130–134. [DOI] [PMC free article] [PubMed] [Google Scholar]
- 29.McMahon MT, Gilad AA, DeLiso MA, Berman SM, Bulte JW, van Zijl PC. New “multicolor” polypeptide diamagnetic chemical exchange saturation transfer (DIACEST) contrast agents for MRI. Magn Reson Med 2008;60(4):803–812. [DOI] [PMC free article] [PubMed] [Google Scholar]
Associated Data
This section collects any data citations, data availability statements, or supplementary materials included in this article.


