

Abstract
Objective
To determine whether, given a limited budget, a state's low-income uninsured population would have greater benefit from a colorectal cancer (CRC) screening program using colonoscopy or fecal immunochemical testing (FIT).
Data Sources/Study Setting
South Carolina's low-income, uninsured population.
Study Design
Comparative effectiveness analysis using microsimulation modeling to estimate the number of individuals screened, CRC cases prevented, CRC deaths prevented, and life-years gained from a screening program using colonoscopy versus a program using annual FIT in South Carolina's low-income, uninsured population. This analysis assumed an annual budget of $1 million and a budget availability of 2 years as a base case.
Principal Findings
The annual FIT screening program resulted in nearly eight times more individuals being screened, and more important, approximately four times as many CRC deaths prevented and life-years gained than the colonoscopy screening program. Our results were robust for assumptions concerning economic perspective and the target population, and they may therefore be generalized to other states and populations.
Conclusions
A FIT screening program will prevent more CRC deaths than a colonoscopy-based program when a state's budget for CRC screening supports screening of only a fraction of the target population.
Keywords: CRC screening, low-income, uninsured population, budget restriction
Colorectal cancer (CRC) is the second leading cause of cancer death in the United States. Each year almost 150,000 new CRC cases are diagnosed and more than 50,000 people die from the disease (Siegel, Naishadham, and Jemal 2013). Several randomized controlled trials and observational studies have shown that screening is an effective and cost-effective tool for reducing CRC mortality (Mandel et al. 1993; Hardcastle et al. 1996; Kronborg et al. 1996; Atkin et al. 2010; Lansdorp-Vogelaar, Knudsen, and Brenner 2011; Segnan et al. 2011; Schoen et al. 2012). Despite recommendations by the US Preventive Services Task Force and the US Multi-Society Task Force to screen regularly for CRC, 40 percent of Americans aged 50–75 years are not up-to-date with screening (Shapiro et al. 2012). This number is nearly 80 percent in those without health insurance (Shapiro et al. 2012).
Several states throughout the United States are currently implementing initiatives to provide access to CRC screening for their low-income, uninsured populations (Joseph et al. 2011). In South Carolina, as in other state programs, there is growing momentum to use colonoscopy as the screening test (Grubbs et al. 2013). For example, in both 2008 and 2009, the South Carolina State Legislature provided nonrecurring funds of $1 million to implement a pilot colonoscopy-based CRC screening program called Screening Colonoscopies for People Everywhere, South Carolina (SCOPE SC). Although colonoscopy has higher per-test sensitivity than fecal occult blood tests (FOBTs) such as the guaiac FOBT and the Fecal Immunochemical Test (FIT), it is much more expensive.
The state-wide CRC screening initiatives tend to have limited, fixed budgets. Given a limited budget, a colonoscopy-based program may not necessarily be the most effective approach. An FOBT-based screening program could enable a considerable portion of the resources required for colonoscopy screening to be used to screen a larger fraction of the target population. Screening more people, albeit with a slightly less effective test, an FOBT-based screening program may prevent more CRC deaths and save more years of life among the target population than a colonoscopy-based program (Subramanian, Bobashev, and Morris 2010).
In this study, we used the MISCAN-Colon and SimCRC microsimulation models to estimate the comparative effectiveness of FIT versus colonoscopy-based screening programs to determine which strategy for CRC screening should be adopted by U.S. states for their low-income, uninsured population to save the most lives given a budget constraint. Calculations were performed for the state of South Carolina. We performed sensitivity analyses to assess whether the results are generalizable to other states to inform policy makers on the best approach for screening their low-income, uninsured population.
Methods
Model
MISCAN-Colon and SimCRC are two well-established microsimulation models for colorectal cancer (extensive descriptions and quantifications of the models are available in Appendices SA2 and SA3, and online: http://cisnet.cancer.gov/profiles/). The models simulate the life histories of a large population of individuals from birth to death, and they include a natural history component that tracks the progression of underlying colorectal disease in the absence of screening. There is a probability (depending on age, sex, race, and individual risk) that one or more adenomas may develop. Adenomas can progress in size from small (≤5 mm) to medium (6–9 mm) to large (≥10 mm), and some adenomas can develop into preclinical cancer (i.e., undiagnosed cancer). A preclinical cancer has a chance of progressing through stages I to IV and may be detected by symptoms at any stage. The stage at diagnosis, the localization of the cancer, and a patient's age determine survival after clinical diagnosis.
Screening may detect adenomas and preclinical cancers depending on the sensitivity of the test for that lesion and, for endoscopic tests, whether the lesion is within reach of the endoscope. As a result, some of the simulated life histories will be altered. Some cancers may be detected in an earlier stage with a better survival, and others may be prevented by the removal of detected adenomas. However, screening might also result in serious complications and overdiagnosis and overtreatment of cancer in the models. False-negative test results are modeled through a lack of sensitivity of the screening tests. Missed cancers can still develop into clinical cancer with relatively poor prognosis. Individuals with missed cancers will therefore not gain any benefit from the screening. False-positive test results are modeled through a lack of specificity of the screening tests. For FIT, the implication is that some individuals needlessly undergo colonoscopy screening after a positive FIT test. This leads to unnecessary costs for this colonoscopy, and the potential associated complications, and mortality.
The models were calibrated separately for four groups: white males, white females, black males, and black females. The natural history model outcomes were calibrated to adenoma prevalence data from autopsy studies (Blatt 1961; Chapman 1963; Arminski and McLean 1964; Rickert et al. 1979; Vatn and Stalsberg 1982; Williams, Balasooriya, and Day 1982; Clark et al. 1985; Bombi 1988; Johannsen, Momsen, and Jacobsen 1989; Jass, Young, and Robinson 1992) and 1990–1994 clinical incidence data from the Surveillance, Epidemiology, and End-Results (SEER-9) Program (2003). The 1990–1994 period was chosen so that incidence was not greatly influenced by endoscopic screening yet, while the increased risk of blacks versus whites was already apparent (American Cancer Society 2005). The models used age-, gender-, and race-specific all-cause mortality estimates from recent US life tables (National Center for Health Statistics2011), and age-, gender-, race-, localization-, and stage-specific CRC survival based on data from SEER (2003). Both MISCAN-Colon and SimCRC showed good concordance with the long-term reductions in CRC incidence and mortality of the randomized controlled gFOBT and sigmoidoscopy studies (Lansdorp-Vogelaar et al. 2009; Atkin et al. 2010; Segnan et al. 2011).
Adjustment to the South Carolina Low-Income, Uninsured Population
We adjusted the models for the average-risk US population and its background risk for CRC to reflect the gender- and race-specific distribution of the 50–64-year-old (i.e., pre-Medicare eligible), low-income (i.e., less than 200 percent of poverty-level), uninsured population in South Carolina. In this South Carolina target population of 92,314 individuals, 22.7 and 39.3 percent were white men and women, respectively, and 22.2 and 15.8 percent were black men and women (US Census Bureau 2012). We assumed that this low-income, uninsured population had no prior CRC screening. The CRC risk in this population is higher than in the average US population, because of a higher proportion of blacks and no prior screening. We assumed no other differences in CRC risk but explored the robustness of our results for this assumption in a sensitivity analysis.
Screening Programs
Two screening programs were considered for the target population (50–64-year-old, low-income, uninsured individuals) with an annual budget of $1 million:
Colonoscopy every 10 years
Annual FIT
In the models, a random sample of the target population was offered CRC screening until screening costs in the program were equivalent to $1 million. The annual budget of $1 million was chosen in accordance with the budget available for the SCOPE SC pilot project. As a base case, we considered a 2-year program horizon (i.e., budget availability) with a 2013 start date, in concordance with the total duration of the SCOPE SC program. Given this 2-year program horizon, the colonoscopy strategy de facto consisted of a single colonoscopy.
Both screening programs were compared with a scenario without a screening program. This scenario assumed no screening prior to age 65 and that all individuals would be screened with colonoscopy at age 65 and 75 once they entered Medicare, which reimburses colorectal cancer screening (Figure1). In the strategies with a screening program, we assumed that all individuals resumed colonoscopy screening and surveillance after the program horizon once they reached age 65 (or 10 years after their latest colonoscopy, whichever came last). An alternative scenario without screening after age 65 was explored in a sensitivity analysis.
Figure 1.
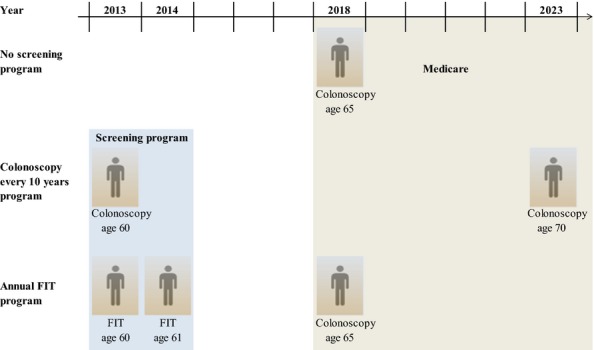
Example Figure of the Screening History of a Sixty-Year-Old Individual in 2013 in a Situation without a Screening Program and in the Situation of a Two-Year Screening Program with Either Colonoscopy Every Ten Years or Annual FIT (and Negative Test Results)
Alternative Program Horizons and Screening Strategies
Besides the program horizon (i.e., budget availability) of 2 years, we considered horizons of 1, 3, and 5 years, with the start of the program in 2013. When the screening interval was longer than the program horizon, the screening strategy de facto consisted of a single screening intervention.
In addition to the currently recommended screening scenarios of colonoscopy every 10 years and annual FIT screening, we considered the scenarios of colonoscopy only for those aged 60 in the program (instead of 50–64-year-old individuals) and biennial FIT screening.
Follow-Up and Surveillance Assumptions
We assumed that an individual with a positive FIT was referred for follow-up colonoscopy and, if negative, would not be recommended to return to the screening program until 10 years after the negative colonoscopy. Individuals with adenomas detected and removed by colonoscopy (screening or after a positive FIT) were recommended to undergo colonoscopy surveillance per guidelines (Lieberman et al. 2012). However, in this low-income, uninsured population, we assumed that surveillance would only take place through Medicare. We therefore assumed that recommended surveillance examinations would start only once an individual became Medicare eligible at age 65. From that point forward, we assumed that surveillance continued until the diagnosis of CRC or death.
Adherence
Because of the nature of the program, the only way to enter the screening program is to perform the screen test. Consequently, all people in the program have adhered to the first screening (i.e., adherence of 100 percent). We assumed 100 percent adherence with repeat screening, diagnostic follow-up, and surveillance but explored incomplete adherence in a sensitivity analysis.
Test Characteristics
Test characteristics of FIT were calibrated to observed detection rates with FIT with a cut-off for positivity of 100 ng/ml in the Dutch CRC pilot studies (Table A2 in Appendix SA2) (Wilschut et al. 2011). Test characteristics for colonoscopy were based on a systematic review of back-to-back colonoscopy studies (van Rijn et al. 2006). The models accounted for the risks and associated costs of serious complications from colonoscopy (perforations, bleeds, and burns) (Zauber et al. 2007). We assumed that 1 out of every 30,000 colonoscopies involving a polypectomy resulted in death (Gatto et al. 2003; Warren et al. 2009). The specificity of the FIT test was equal to 97.7 percent, and for colonoscopy 90 percent (Table A2 in Appendix SA2).
Costs
Costs for FIT and colonoscopy were not available from the SCOPE SC program. Costs for FIT ($22) and colonoscopy (without polypectomy $653; with polypectomy $830, Table A3 in Appendix SA2) in the program were therefore based on 2014 Medicare reimbursement rates (in the Ambulatory Surgical Centers; Zauber et al. 2007). Costs for colonoscopy outside of the program were based on 2014 Medicare reimbursement rates for all points of service.
The costs of complications were based on the relevant diagnosis-related group codes (Zauber et al. 2007). CRC treatment costs were derived from a comparison of medical costs for CRC patients relative to Medicare Beneficiaries without a CRC diagnosis matched by sex, age, and SEER registry area in the 1998–2003 SEER-Medicare data (Yabroff et al. 2005, 2007). To incorporate patient time costs associated with CRC screening, we assumed that the value of patient time was equal to the mean US wage rate in 2013 from the Bureau of Labor Statistics, $22.33 per hour (Bureau of Labor Statistics 2013). For patient time costs, we assumed that the time associated with a colonoscopy procedure was 16 hours and with FIT 1 hour. For treatment of complications with colonoscopy, we assumed that patient time requirements would be on average 112 hours. We assumed no costs of organization of or patient navigation in the program, but we explored lower budget availability in the sensitivity analysis to account for these costs.
All costs were converted to 2013 dollars using the overall Consumer Price Index (Consumer Pricing Index2014).
Analysis
We first performed a comparative effectiveness analysis (given a limited budget) from the perspective of the South Carolina screening program. Consequently, we used MISCAN-Colon and SimCRC to estimate number of individuals screened by the program (i.e., people screened more than once are only counted once), colonoscopies performed, lifetime CRC cases prevented, lifetime CRC deaths prevented, and lifetime life-years gained for both screening programs compared to no program. Life-years gained were discounted using the conventional annual 3 percent rate. For the depletion of the available budget, only costs of screening for the population aged 50–64 years were taken into account; in the South Carolina program (as in the SCOPE SC pilot), the costs of treating persons diagnosed with CRC through screening were covered by other funds.
Subsequently, we performed a cost-effectiveness analysis from the societal perspective. From a societal point of view, the choice of screening strategy might differ from the more narrow perspective of the South Carolina screening program. In this perspective, lifetime screening, surveillance, and treatment costs were included (Table A3 in Appendix SA2). Each category was split into costs for the first 2 years (program horizon) and costs for the remainder of the years. All these costs were discounted using the conventional annual 3 percent rate.
Sensitivity Analyses
We performed two types of sensitivity analyses: one on the target population and one on assumptions with respect to the screening program. In the comparative effectiveness analysis for a 2-year program, we assumed that the low-income, uninsured population only differed from the average population with respect to the gender and race-distribution and their screening history. In the sensitivity analysis, we explored the following assumptions, to assess their impact on the results:
Makeup of the target population: all black population
Makeup of the target population: all white population
CRC risk other than gender and race related: 50 percent higher CRC risk
Life expectancy: 20 percent higher age-specific all-cause mortality rates
No screening after age 65
With respect to the screening program, we explored the following alternative assumptions:
Yearly budget of $0.5, $2, and $5 million (instead of $1 million)
60 percent adherence to diagnostic colonoscopy after positive FIT
60 percent adherence to diagnostic colonoscopy after positive FIT and 60 percent adherence to repeat screening
Including costs for obtaining higher uptake with FIT than with colonoscopy screening (including costs of $100,000 for obtaining higher uptake)
Results
South Carolina Screening Program Perspective
With an annual screening program budget of $1 million for 2 years, 2,747–2,785 people (range reflects differences between models) in the South Carolinian low-income, uninsured population could be offered a colonoscopy (Table1). With the same budget, almost eight times as many individuals (a total of 21,153–21,419 individuals) could be screened with FIT. The number of colonoscopies performed in the colonoscopy program were nearly double that in a FIT screening program. With a FIT screening program, over two times more CRC cases were prevented and approximately four times as many CRC deaths were prevented and life-years were gained.
Table 1.
Total Number of Individuals Screened, Colonoscopies Performed, CRC Cases Prevented, CRC Deaths Prevented, and Life-Years Gained for Colonoscopy Every Ten Years and Annual FIT Screening with a Yearly Budget of One Million Dollars, and a Program Horizon of Two Years
| Outcome | Model | Colonoscopy Program | Annual FIT Program | Relative Difference* |
|---|---|---|---|---|
| Individuals screened through the program† | MISCAN | 2,747 | 21,153 | 7.7 |
| SimCRC | 2,785 | 21,419 | 7.7 | |
| Colonoscopies performed in the program‡ | MISCAN | 2,747 | 1,540 | 0.6 |
| SimCRC | 2,785 | 1,539 | 0.6 | |
| CRC cases prevented‡ | MISCAN | 13 | 30 | 2.4 |
| SimCRC | 23 | 68 | 2.9 | |
| CRC deaths prevented‡ | MISCAN | 6 | 26 | 4.1 |
| SimCRC | 9 | 37 | 4.1 | |
| Life-years gained‡,§ | MISCAN | 68 | 258 | 3.8 |
| SimCRC | 86 | 367 | 4.3 |
Relative difference is calculated as FIT/colonoscopy.
Individuals screened more than once, are only counted once.
Compared to no screening program.
3% discounted.
Societal Perspective
FIT screening was associated with an increase in treatment costs because of early detection of CRC in the first 2 years (screening program) of $2.3–$2.5 million (range reflects differences between models), amounting to a total budget required for the program of $5.9–$6.1 million in the first 2 years (Table2). For colonoscopy screening, the increase in treatment costs was less pronounced ($0.3–$0.4 million). The increase in treatment costs during the program was more than compensated by savings in treatment costs in the years following the program ($4.0–$7.0 million for FIT and $1.4–$2.1 million for colonoscopy), and part of the screening costs were also recouped. Consequently, the total costs for screening (compared to the scenario without a screening program that assumed that all individuals would be screened once they entered Medicare at the age of 65) were $0.5–$1.3 million for the colonoscopy program and cost saving to $1.7 million for the annual FIT program (Table2). In the MISCAN-Colon model, although the FIT screening program overall was more costly than the colonoscopy program, it was also more effective (258 vs. 68 life-years gained, Table1). Therefore, an annual FIT program costs less per life-year gained than a colonoscopy program ($6,415 vs. $18,377 per life-year gained). In the SimCRC model, the FIT screening program was both cost saving and more effective (367 vs. 86 life-years gained, Table1) compared to the colonoscopy program.
Table 2.
Total Screening, Surveillance, and Treatment Costs (in US$) for Colonoscopy Every Ten Years and Annual FIT Screening with a Yearly Budget of One Million Dollars, and a Program Horizon of Two Years
| Horizon | Model | Costs for Colonoscopy Program* (×$1 million) | Costs for Annual FIT Program* (×$1 million) | ||||||
|---|---|---|---|---|---|---|---|---|---|
| Screening | Surveillance | Treatment | Total | Screening | Surveillance | Treatment | Total | ||
| First 2 years | MISCAN | 3.4 | 0 | 0.4 | 3.8 | 3.6 | 0 | 2.5 | 6.1 |
| SimCRC | 3.4 | 0 | 0.3 | 3.8 | 3.6 | 0 | 2.3 | 5.9 | |
| All except first 2 years† | MISCAN | −1.5 | 0.3 | −1.4 | −2.6 | −1.4 | 1.0 | −4.0 | −4.5 |
| SimCRC | −1.5 | 0.4 | −2.1 | −3.2 | −1.1 | 0.7 | −7.0 | −7.4 | |
| Total‡ | MISCAN | 1.9 | 0.3 | −1.0 | 1.3 | 2.2 | 1.0 | −1.5 | 1.7 |
| SimCRC | 1.9 | 0.4 | −1.7 | 0.5 | 2.5 | 0.7 | −4.7 | −1.5 | |
Compared to no screening program, 3% discounted.
Lifetime costs for all years accept the first 2 years.
Lifetime costs.
Alternative Program Horizons and Screening Scenarios
With longer program horizons (up to 5 years), the number of individuals screened with colonoscopy increased proportionally to the program horizon: twice the number of people screened with colonoscopy if twice the number of years of budget availability. With FIT screening, a large part of the budget in subsequent years needed to be used for rescreening of individuals screened in earlier years. Therefore, the relative increase in the number of individuals screened by the program was considerably smaller for FIT (Table3). Still, with a program horizon of 5 years, the number of individuals screened in a FIT program was over four times as high as those screened in a colonoscopy program (28,726–29,163 vs. 6,867–6,963 individuals; range reflects differences between models).
Table 3.
Total Number of Individuals Screened and CRC Deaths Prevented for Four Screening Programs with a Yearly Budget of One Million Dollars, by Program Horizon
| Program Horizon | Model | Individuals Screened through the Program* | CRC Deaths Prevented† | ||||||
|---|---|---|---|---|---|---|---|---|---|
| Colonoscopy Program | FIT Program | Colonoscopy Program | FIT Program | ||||||
| Every 10 Years | At Age 60 | Annual | Biennial | Every 10 Years | At Age 60 | Annual | Biennial | ||
| 1 year | MISCAN | 1,374 | 1,364 | 17,934 | 17,934 | 3 | 3 | 15 | 15 |
| SimCRC | 1,393 | 1,384 | 18,390 | 18,390 | 5 | 3 | 21 | 21 | |
| 2 years | MISCAN | 2,747 | 2,729 | 21,153 | 35,852 | 6 | 6 | 26 | 30 |
| SimCRC | 2,785 | 2,769 | 21,419 | 36,794 | 9 | 7 | 37 | 42 | |
| 3 years | MISCAN | 4,121 | 4,093 | 23,885 | 40,152 | 9 | 8 | 35 | 41 |
| SimCRC | 4,178 | 4,153 | 24,123 | 40,752 | 14 | 10 | 51 | 59 | |
| 5 years | MISCAN | 6,867 | 6,822 | 28,726 | 48,794 | 16 | 14 | 52 | 66 |
| SimCRC | 6,963 | 6,921 | 29,163 | 48,477 | 23 | 16 | 73 | 90 | |
Individuals screened more than once are only counted once.
Compared to no screening program.
The $1 million budget for 1 year resulted in 4- to 5-fold more CRC deaths prevented in the FIT program than in the colonoscopy program over the lifetimes of those affected by the program (Table3). The number of deaths prevented increased proportionally for colonoscopy with longer time horizons. However, a colonoscopy program required a 5-year horizon to exceed the number of deaths prevented with a 1-year horizon FIT program (16 vs. 15 deaths in the MISCAN-Colon model, 23 vs. 21 deaths in the SimCRC model).
Access to colonoscopy in the program only for those aged 60 resulted in slightly fewer people screened (2,729–2,769 vs. 2,747–2,785 with budget for 2 years) and similar to slightly fewer deaths prevented (6 vs. 6 in the MISCAN-Colon model, 7 vs. 9 in the SimCRC model) compared to access to colonoscopy for people aged 50–64 (Table3). Implementing a biennial FIT program resulted in even more individuals screened (35,852–36,794 vs. 21,153–21,419 with budget for 2 years) and deaths prevented (30 vs. 26 in the MISCAN-Colon model, 42 vs. 37 in the SimCRC model) than implementing an annual FIT program.
Sensitivity Analyses
The results were robust to alternative assumptions concerning the low-income, uninsured population, or the screening program (Table4). In all sensitivity analyses, a FIT screening program screened more individuals and prevented more CRC deaths within a limited budget than a program using colonoscopy. Results were most sensitive to assumptions concerning screening after age 65 and adherence. Without screening after age 65, the difference in CRC deaths prevented between the FIT program and colonoscopy program decreased to 2.4- to 2.8-fold more deaths prevented by the FIT program (vs. 4.1-fold in the base case). The difference in CRC deaths prevented between the FIT program and colonoscopy program decreased to approximately 3.5-fold when 60 percent adherence to diagnostic colonoscopy after positive FIT was assumed. Changes in the available budget resulted in proportional changes in CRC deaths prevented for both the FIT and colonoscopy screening program.
Table 4.
Sensitivity Analyses: Total Number of Individuals Screened and CRC Deaths Prevented for a Colonoscopy Every Ten Years and Annual FIT Screening Program with a Yearly Budget of One Million Dollars for Two Years, for Alternative Model Assumptions
| Model Assumption | Model | Individuals Screened through the Program† | Relative Difference* | CRC Deaths Prevented‡ | Relative Difference* | ||
|---|---|---|---|---|---|---|---|
| Colonoscopy | FIT | Colonoscopy | FIT | ||||
| Base case | MISCAN | 2,747 | 21,153 | 7.7 | 6 | 26 | 4.1 |
| SimCRC | 2,785 | 21,419 | 7.7 | 9 | 37 | 4.1 | |
| All black population | MISCAN | 2,728 | 19,999 | 7.3 | 8 | 31 | 3.8 |
| SimCRC | 2,771 | 20,440 | 7.4 | 11 | 42 | 3.7 | |
| All white population | MISCAN | 2,762 | 22,058 | 8.0 | 5 | 22 | 4.6 |
| SimCRC | 2,794 | 22,000 | 7.9 | 8 | 34 | 4.4 | |
| CRC risk (50% higher) | MISCAN | 2,668 | 18,545 | 7.0 | 9 | 34 | 3.7 |
| SimCRC | 2,730 | 18,805 | 6.9 | 14 | 51 | 3.6 | |
| Life expectancy (20% higher age-specific all-cause mortality rates) | MISCAN | 2,747 | 21,181 | 7.7 | 6 | 25 | 4.0 |
| SimCRC | 2,785 | 21,418 | 7.7 | 9 | 37 | 4.1 | |
| No screening after age 65 | MISCAN | 2,747 | 21,153 | 7.7 | 20 | 49 | 2.4 |
| SimCRC | 2,785 | 21,419 | 7.7 | 33 | 92 | 2.8 | |
| Budget | |||||||
| $0.5 million | MISCAN | 1,374 | 10,576 | 7.7 | 3 | 13 | 4.1 |
| SimCRC | 1,393 | 10,709 | 7.7 | 5 | 19 | 4.1 | |
| $2 million | MISCAN | 5,495 | 42,305 | 7.7 | 13 | 51 | 4.1 |
| SimCRC | 5,571 | 42,838 | 7.7 | 18 | 74 | 4.1 | |
| $5 million | MISCAN | 13,736 | 105,763§ | 7.7 | 31 | 129 | 4.1 |
| SimCRC | 13,927 | 107,094§ | 7.7 | 46 | 186 | 4.1 | |
| 60% adherence to diagnostic follow-up | MISCAN | 2,747 | 26,660 | 9.7 | 6 | 22 | 3.5 |
| SimCRC | 2,785 | 27,284 | 9.8 | 9 | 31 | 3.4 | |
| 60% adherence to diagnostic follow-up and repeat screening | MISCAN | 2,747 | 34,974 | 12.7 | 6 | 22 | 3.6 |
| SimCRC | 2,785 | 35,733 | 12.8 | 9 | 32 | 3.5 | |
| Including costs for higher FIT uptake (costs equal to $100,000) | MISCAN | 2,747 | 19,037 | 6.9 | 6 | 23 | 3.7 |
| SimCRC | 2,785 | 19,277 | 6.9 | 9 | 33 | 3.7 | |
Relative difference is calculated as FIT/colonoscopy.
Individuals screened more than once are only counted once.
Compared to no screening program.
105,763/107,094 (MISCAN/SimCRC) individuals is more than the low-income, uninsured population of South Carolina (93,342). The CRC deaths prevented in case of screening 93,342 individuals would be 121/173, and the budget needed would equal $4.7/$4.6 million.
Discussion
Our study demonstrates that with a limited 2-year budget for screening, a screening program using annual FIT results in almost eight times more individuals being screened by the program, and more important, approximately four times as many CRC deaths prevented and life-years gained than a program using colonoscopy every 10 years. From a societal point of view, an annual FIT program is also more cost-effective than a colonoscopy program. Our findings are very robust for different assumptions concerning the target population and screening program as well as for different program horizons. Offering FIT biennially instead of annually would increase the preventive effect of the screening program even further.
The two-step mechanism of FIT screening explains the larger number of CRC deaths prevented in a FIT program versus a colonoscopy program. The effectiveness of FIT comes from the colonoscopy being performed in persons with a positive FIT. A relatively inexpensive test identifies those at higher risk for CRC (i.e., those with a positive FIT) who need an expensive follow-up diagnostic test (colonoscopy). The reduction in colonoscopies performed because resources are being spent on FIT is more than compensated by the additional benefit obtained from colonoscopies being targeted to higher risk individuals (i.e., those with a positive FIT).
The difference in budget allocation explains that biennial FIT screening is more effective in a situation of budget constraints than annual FIT. With annual FIT screening, the majority of the second-year budget is used for repeat screens, while these are all first screens in case of biennial screening. It is well known that detection rates and positive predictive value of repeat screens are considerably lower than those of first screens (van Roon et al. 2013). Therefore, the long-term impact of repeat screens will be lower than that of first screens.
The impact of screening (CRC cases prevented, CRC deaths prevented, and life-years gained) estimated by MISCAN-Colon are smaller than those estimated by SimCRC. The reason for this is that the duration of the adenoma–carcinoma sequence in the MISCAN-Colon model is, on average, shorter than in SimCRC (Kuntz et al. 2011). However, the conclusion that a FIT-based program is both more effective and more cost-effective than a colonoscopy-based program is the same in both models. Therefore, this only shows robustness of our results to model uncertainty, in particular to the natural history part of the models.
Our findings corroborate the conclusion of Subramanian, Bobashev, and Morris (2010) that FOBT provides more life-years gained for programs on a limited budget than colonoscopy. Our study estimates an even larger difference between FOBT (FIT in our case) and colonoscopy. How the $1 million budget is allocated in our analysis is the principal reason of this difference. We simulated a real-life budget allocation from the perspective of a state body organizing the screening program: such a state body has a certain budget available for a limited period of time. Subramanian, Bobashev, and Morris (2010) simulated lifetime budget allocation, meaning that the budget available was used for screening a cohort of individuals over their lifetimes. As a result, the budget in Subramanian's FOBT program is mostly used for rescreening individuals and the benefit of repeat screens is considerably lower.
The finding that the difference in CRC deaths prevented between FIT-based programs and colonoscopy-based programs is even larger with short program horizons is an important insight of this study. The program horizons presented in our study (1, 2, 3, and 5 years) are based upon annual appropriation of funds, which is the current situation for many of the state-based screening initiatives. However, our study also shows that the benefit of the programs increases with longer time horizons. Further, the most effective strategy would be one in which CRC screening programs were established with recurring funding over prolonged periods of time. Sustained programs reduce start-up and infrastructure of development cost. Our study shows that even with 5 years of $1 million funding for annual FIT screening, only 30 percent of the target population of low-income, uninsured people in South Carolina can be provided access to screening. The funds would need at least to be quadrupled to be able to serve the complete target population.
Three limitations are noteworthy. First, we lack information on the screening behavior of the target population in the absence of a screening program. In the comparative effectiveness analysis with 100 percent colonoscopy screening after age 65 and in the sensitivity analyses without any screening, we have tackled the extremes of possible compliance and found our results robust for adherence assumptions. In reality, the benefit of a FIT program over a colonoscopy program will be somewhere between the two extreme assumptions. Secondly, we only included Medicare reimbursement rates for FIT and colonoscopy as screening costs in the program. Other costs, such as costs for patient navigation and screening infrastructure, were not factored in. Adding these costs results in a smaller budget available for screening, reducing the number of people that can be offered screening. However, our results were robust to the assumption of a lower budget availability for FIT compared to colonoscopy screening in the sensitivity analysis. Finally, information on health and CRC risk of the low-income, uninsured population in South Carolina is limited. In the base case analysis, we assumed that this population only differs from the general U.S. population with respect to gender and race distribution and screening history (i.e., no prior screening). We validated this assumption by simulating the age, gender, and race distribution of the pilot screening program SCOPE SC and comparing simulated detection rates for that population with observed. The simulated and observed data matched very well (Table C1 in Appendix SA4). Moreover, we explored alternative assumptions concerning CRC risk and life expectancy in the sensitivity analysis and found our results robust to these assumptions.
Although this study was performed based on the South Carolinian low-income, uninsured population, our findings may easily be generalized to other states and populations. States differ with respect to the makeup of their population, CRC risk, and potentially life expectancy (Naishadham et al. 2011; U.S. Census Bureau 2012). However, the conclusion that FIT is the preferred modality of screening in case of limited budget was insensitive to differences in these aspects. Nevertheless, currently most state initiatives for CRC screening are based on colonoscopy screening (Joseph et al. 2011), potentially because colonoscopy is the preferred method of screening according to the American College of Gastroenterology (Rex et al. 2009). Colonoscopy is considered preferable because of its potential of preventing CRC incidence. States might be hesitant in offering what may be viewed as a “lessor” method of screening to an already underserved population. Previous studies have already indicated that, if adhered to, annual FIT screening is just as effective as colonoscopy every 10 years (Zauber et al. 2008). This message has already been adopted by the U.S. Preventive Services Task Force (2008). This study shows that in a situation of budget constraints, FIT actually prevents both more CRC incidence as well as mortality because of the larger number of individuals that can be screened.
As the Affordable Care Act is implemented in states across the country, it is likely that access to cancer screening services will improve for low-income, uninsured persons. The findings from the current study, which focus on strategies to optimize CRC screening, inform policy makers on the best approach for targeting this population: when a state's budget for CRC screening supports screening of only a fraction of the target population, a program using FIT screening is the preferred screening strategy. In this situation, a FIT screening program results in more individuals screened, more CRC deaths prevented, and more life-years gained than a colonoscopy-based program.
Acknowledgments
Joint Acknowledgment/Disclosure Statement: This work was supported by the National Cancer Institute at the National Institutes of Health and the Centers for Disease Control and Prevention (U01CA152959). The funding sources had no role in design and conduct of the study; collection, management, analysis, and interpretation of the data; and preparation, review, or approval of the manuscript. The content is solely the responsibility of the authors and does not represent the official views of the National Institutes of Health, the National Cancer Institute, or the Centers for Disease Control and Prevention.
Disclosures: None.
Disclaimers: None.
Supporting Information
Additional supporting information may be found in the online version of this article:
Appendix SA1: Author Matrix.
Appendix SA2: MISCAN-Colon.
Appendix SA3: SimCRC.
Appendix SA4: Model Validation against South Carolina Pilot CRC Screening Program.
References
- American Cancer Society. Colorectal Cancer Facts & Figures: Special Edition, 2005. 2005. [accessed October 6, 2014]. Available at http://www.cancer.org/acs/groups/content/@nho/documents/document/caff2005cr4pwsecuredpdf.pdf. [Google Scholar]
- Arminski TC. McLean DW. Incidence and Distribution of Adenomatous Polyps of the Colon and Rectum Based on 1,000 Autopsy Examinations. Diseases of the Colon and Rectum. 1964;7:249–61. doi: 10.1007/BF02630528. [DOI] [PubMed] [Google Scholar]
- Atkin WS, Edwards R, Kralj-Hans I, Wooldrage K, Hart AR, Northover JM, Parkin DM, Wardle J, Duffy SW, Cuzick J. Investigators UKFST. Once-Only Flexible Sigmoidoscopy Screening in Prevention of Colorectal Cancer: A Multicentre Randomised Controlled Trial. Lancet. 2010;375(9726):1624–33. doi: 10.1016/S0140-6736(10)60551-X. [DOI] [PubMed] [Google Scholar]
- Blatt L. Polyps of the Colon and Rectum: Incidence and Distribution. Diseases of the Colon and Rectum. 1961;4:277–82. [Google Scholar]
- Bombi JA. Polyps of the Colon in Barcelona, Spain. An Autopsy Study. Cancer. 1988;61(7):1472–6. doi: 10.1002/1097-0142(19880401)61:7<1472::aid-cncr2820610734>3.0.co;2-e. [DOI] [PubMed] [Google Scholar]
- Bureau of Labor Statistics. 2013. “ Bureau of Labor Statistics ” [accessed on May 16, 2014]. Available at http://www.bls.gov/oes/current/oes_nat.htm.
- Chapman I. Adenomatous Polypi of Large Intestine: Incidence and Distribution. Annals of Surgery. 1963;157:223–6. doi: 10.1097/00000658-196302000-00007. [DOI] [PMC free article] [PubMed] [Google Scholar]
- Clark JC, Collan Y, Eide TJ, Esteve J, Ewen S, Gibbs NM, Jensen OM, Koskela E, MacLennan R, Simpson JG, Stalsberg H. Zaridze DG. Prevalence of Polyps in an Autopsy Series from Areas with Varying Incidence of Large-Bowel Cancer. International Journal of Cancer. 1985;36(2):179–86. doi: 10.1002/ijc.2910360209. [DOI] [PubMed] [Google Scholar]
- Consumer Pricing Index. 2014. [accessed on March 19, 2014]. Available at http://www.bls.gov/cpi/#tables.
- Gatto NM, Frucht H, Sundararajan V, Jacobson JS, Grann VR. Neugut AI. Risk of Perforation after Colonoscopy and Sigmoidoscopy: A Population-Based Study. Journal of the National Cancer Institute. 2003;95(3):230–6. doi: 10.1093/jnci/95.3.230. [DOI] [PubMed] [Google Scholar]
- Grubbs SS, Polite BN, Carney J, Jr, Bowser W, Rogers J, Katurakes N, Hess P. Paskett ED. Eliminating Racial Disparities in Colorectal Cancer in the Real World: It Took a Village. Journal of Clinical Oncology. 2013;31(16):1928–30. doi: 10.1200/JCO.2012.47.8412. [DOI] [PMC free article] [PubMed] [Google Scholar]
- Hardcastle JD, Chamberlain JO, Robinson MH, Moss SM, Amar SS, Balfour TW, James PD. Mangham CM. Randomised Controlled Trial of Faecal-Occult-Blood Screening for Colorectal Cancer. Lancet. 1996;348(9040):1472–7. doi: 10.1016/S0140-6736(96)03386-7. [DOI] [PubMed] [Google Scholar]
- Jass JR, Young PJ. Robinson EM. Predictors of Presence, Multiplicity, Size and Dysplasia of Colorectal Adenomas. A Necropsy Study in New Zealand. Gut. 1992;33(11):1508–14. doi: 10.1136/gut.33.11.1508. [DOI] [PMC free article] [PubMed] [Google Scholar]
- Johannsen LG, Momsen O. Jacobsen NO. Polyps of the Large Intestine in Aarhus, Denmark. An Autopsy Study. Scandinavian Journal of Gastroenterology. 1989;24(7):799–806. doi: 10.3109/00365528909089217. [DOI] [PubMed] [Google Scholar]
- Joseph DA, DeGroff AS, Hayes NS, Wong FL. Plescia M. The Colorectal Cancer Control Program: Partnering to Increase Population Level Screening. Gastrointestinal Endoscopy. 2011;73(3):429–34. doi: 10.1016/j.gie.2010.12.027. [DOI] [PubMed] [Google Scholar]
- Kronborg O, Fenger C, Olsen J, Jorgensen OD. Sondergaard O. Randomised Study of Screening for Colorectal Cancer with Faecal-Occult-Blood Test. Lancet. 1996;348(9040):1467–71. doi: 10.1016/S0140-6736(96)03430-7. [DOI] [PubMed] [Google Scholar]
- Kuntz KM, Lansdorp-Vogelaar I, Rutter CM, Knudsen AB, van Ballegooijen M, Savarino JE, Feuer EJ. Zauber AG. A Systematic Comparison of Microsimulation Models of Colorectal Cancer: The Role of Assumptions about Adenoma Progression. Medical Decision Making. 2011;31(4):530–9. doi: 10.1177/0272989X11408730. [DOI] [PMC free article] [PubMed] [Google Scholar]
- Lansdorp-Vogelaar I, Knudsen AB. Brenner H. Cost-Effectiveness of Colorectal Cancer Screening. Epidemiologic Reviews. 2011;33(1):88–100. doi: 10.1093/epirev/mxr004. [DOI] [PMC free article] [PubMed] [Google Scholar]
- Lansdorp-Vogelaar I, van Ballegooijen M, Boer R, Zauber A. Habbema JD. A Novel Hypothesis on the Sensitivity of the Fecal Occult Blood Test: Results of a Joint Analysis of Three Randomized Controlled Trials. Cancer. 2009;115(11):2410–9. doi: 10.1002/cncr.24256. [DOI] [PMC free article] [PubMed] [Google Scholar]
- Lieberman DA, Rex DK, Winawer SJ, Giardiello FM, Johnson DA. Levin TR C. United States Multi-Society Task Force on Colorectal. Guidelines for Colonoscopy Surveillance after Screening and Polypectomy: A Consensus Update by the US Multi-Society Task Force on Colorectal Cancer. Gastroenterology. 2012;143(3):844–57. doi: 10.1053/j.gastro.2012.06.001. [DOI] [PubMed] [Google Scholar]
- Mandel JS, Bond JH, Church TR, Snover DC, Bradley GM, Schuman LM. Ederer F. Reducing Mortality from Colorectal Cancer by Screening for Fecal Occult Blood. Minnesota Colon Cancer Control Study. New England Journal of Medicine. 1993;328(19):1365–71. doi: 10.1056/NEJM199305133281901. [DOI] [PubMed] [Google Scholar]
- Naishadham D, Lansdorp-Vogelaar I, Siegel R, Cokkinides V. Jemal A. State Disparities in Colorectal Cancer Mortality Patterns in the United States. Cancer Epidemiology, Biomarkers and Prevention. 2011;20(7):1296–302. doi: 10.1158/1055-9965.EPI-11-0250. [DOI] [PubMed] [Google Scholar]
- National Center for Health Statistics. 2011. [accessed on April 18, 2013]. Available at http://www.cdc.gov/nchs/products/pubs/pubd/lftbls/
- Rex DK, Johnson DA, Anderson JC, Schoenfeld PS, Burke CA, Inadomi JM G. American College of. American College of Gastroenterology Guidelines for Colorectal Cancer Screening 2009 [Corrected] American Journal of Gastroenterology. 2009;104(3):739–50. doi: 10.1038/ajg.2009.104. [DOI] [PubMed] [Google Scholar]
- Rickert RR, Auerbach O, Garfinkel L, Hammond EC. Frasca JM. Adenomatous Lesions of the Large Bowel: An Autopsy Survey. Cancer. 1979;43(5):1847–57. doi: 10.1002/1097-0142(197905)43:5<1847::aid-cncr2820430538>3.0.co;2-l. [DOI] [PubMed] [Google Scholar]
- van Rijn JC, Reitsma JB, Stoker J, Bossuyt PM, van Deventer SJ. Dekker E. Polyp Miss Rate Determined by Tandem Colonoscopy: A Systematic Review. American Journal of Gastroenterology. 2006;101(2):343–50. doi: 10.1111/j.1572-0241.2006.00390.x. [DOI] [PubMed] [Google Scholar]
- van Roon AH, Goede SL, van Ballegooijen M, van Vuuren AJ, Looman CW, Biermann K, Reijerink JC, Mannetje H, van der Togt AC, Habbema JD, van Leerdam ME. Kuipers EJ. Random Comparison of Repeated Faecal Immunochemical Testing at Different Intervals for Population-Based Colorectal Cancer Screening. Gut. 2013;62(3):409–15. doi: 10.1136/gutjnl-2011-301583. [DOI] [PubMed] [Google Scholar]
- Schoen RE, Pinsky PF, Weissfeld JL, Yokochi LA, Church T, Laiyemo AO, Bresalier R, Hickey T, Riley T. Prorok PC. Colorectal Cancers Not Detected by Screening Flexible Sigmoidoscopy in the Prostate, Lung, Colorectal, and Ovarian Cancer Screening Trial. Gastrointestinal Endoscopy. 2012;75(3):612–20. doi: 10.1016/j.gie.2011.10.024. [DOI] [PubMed] [Google Scholar]
- Segnan N, Armaroli P, Bonelli L, Risio M, Sciallero S, Zappa M, Andreoni B, Arrigoni A, Bisanti L, Casella C, Crosta C, Falcini F, Ferrero F, Giacomin A, Giuliani O, Santarelli A, Visioli CB, Zanetti R, Atkin WS. Senore C S. W. Group. Once-Only Sigmoidoscopy in Colorectal Cancer Screening: Follow-Up Findings of the Italian Randomized Controlled Trial–SCORE. Journal of the National Cancer Institute. 2011;103(17):1310–22. doi: 10.1093/jnci/djr284. [DOI] [PubMed] [Google Scholar]
- Shapiro JA, Klabunde CN, Thompson TD, Nadel MR, Seeff LC. White A. Patterns of Colorectal Cancer Test Use, Including CT Colonography, in the 2010 National Health Interview Survey. Cancer Epidemiology, Biomarkers and Prevention. 2012;21(6):895–904. doi: 10.1158/1055-9965.EPI-12-0192. [DOI] [PMC free article] [PubMed] [Google Scholar]
- Siegel R, Naishadham D. Jemal A. Cancer Statistics, 2013. CA: A Cancer Journal for Clinicians. 2013;63(1):11–30. doi: 10.3322/caac.21166. [DOI] [PubMed] [Google Scholar]
- Subramanian S, Bobashev G. Morris RJ. When Budgets Are Tight, There Are Better Options Than Colonoscopies for Colorectal Cancer Screening. Health Affairs (Millwood) 2010;29(9):1734–40. doi: 10.1377/hlthaff.2008.0898. [DOI] [PubMed] [Google Scholar]
- Surveillance Epidemiology and End Results (SEER) Program. 2003. “ SEER*Stat Database: Incidence – SEER 9 Regs Public Use. Nov 2003 Sub (1973-2001), DCCPS, Surveillance Research Program, Cancer Statistics Branch. Based on the November 2003 submission. Bethesda, MD: National Cancer Institute; April 2004 ” [accessed on March 5, 2010, 2003]. Available at http://www.seer.cancer.gov.
- U.S. Census Bureau. Current Population Survey, Annual Social and Economic Supplement. 2012. [accessed October 6, 2014]. Available at http://www.census.gov/2010census/ [Google Scholar]
- U.S. Preventive Services Task Force. Screening for Colorectal Cancer: U.S. Preventive Services Task Force Recommendation Statement. Annals of Internal Medicine. 2008;149(9):627–37. doi: 10.7326/0003-4819-149-9-200811040-00243. [DOI] [PubMed] [Google Scholar]
- Vatn MH. Stalsberg H. The Prevalence of Polyps of the Large Intestine in Oslo: An Autopsy Study. Cancer. 1982;49(4):819–25. doi: 10.1002/1097-0142(19820215)49:4<819::aid-cncr2820490435>3.0.co;2-d. [DOI] [PubMed] [Google Scholar]
- Warren JL, Klabunde CN, Mariotto AB, Meekins A, Topor M, Brown ML. Ransohoff DF. Adverse Events after Outpatient Colonoscopy in the Medicare Population. Annals of Internal Medicine. 2009;150(12):849–57. doi: 10.7326/0003-4819-150-12-200906160-00008. W152. [DOI] [PubMed] [Google Scholar]
- Williams AR, Balasooriya BA. Day DW. Polyps and Cancer of the Large Bowel: A Necropsy Study in Liverpool. Gut. 1982;23(10):835–42. doi: 10.1136/gut.23.10.835. [DOI] [PMC free article] [PubMed] [Google Scholar]
- Wilschut JA, Hol L, Dekker E, Jansen JB, Van Leerdam ME, Lansdorp-Vogelaar I, Kuipers EJ, Habbema JD. Van Ballegooijen M. Cost-Effectiveness Analysis of a Quantitative Immunochemical Test for Colorectal Cancer Screening. Gastroenterology. 2011;141(5):1648–55. doi: 10.1053/j.gastro.2011.07.020. e1. [DOI] [PubMed] [Google Scholar]
- Yabroff KR, Warren JL, Knopf K, Davis WW. Brown ML. Estimating Patient Time Costs Associated with Colorectal Cancer Care. Medical Care. 2005;43(7):640–8. doi: 10.1097/01.mlr.0000167177.45020.4a. [DOI] [PubMed] [Google Scholar]
- Yabroff KR, Davis WW, Lamont EB, Fahey A, Topor M, Brown ML. Warren JL. Patient Time Costs Associated with Cancer Care. Journal of the National Cancer Institute. 2007;99(1):14–23. doi: 10.1093/jnci/djk001. [DOI] [PubMed] [Google Scholar]
- Zauber A, Lansdorp-Vogelaar I, Wilschut J, Knudsen AB, van Ballegooijen M. Kuntz KM. Cost-Effectiveness of DNA Stool Testing to Screen for Colorectal Cancer: Report to AHRQ and CMS from the Cancer Intervention and Surveillance Modeling Network (CISNET) for MISCAN and SimCRC Models. 2007. [available at October 6, 2014]. Available at http://www.cms.gov/Medicare/Coverage/DeterminationProcess/downloads/id52TA.pdf. [PubMed] [Google Scholar]
- Zauber AG, Lansdorp-Vogelaar I, Knudsen AB, Wilschut J, van Ballegooijen M. Kuntz KM. Evaluating Test Strategies for Colorectal Cancer Screening: A Decision Analysis for the U.S. Preventive Services Task Force. Annals of Internal Medicine. 2008;149(9):659–69. doi: 10.7326/0003-4819-149-9-200811040-00244. [DOI] [PMC free article] [PubMed] [Google Scholar]
Associated Data
This section collects any data citations, data availability statements, or supplementary materials included in this article.
Supplementary Materials
Appendix SA1: Author Matrix.
Appendix SA2: MISCAN-Colon.
Appendix SA3: SimCRC.
Appendix SA4: Model Validation against South Carolina Pilot CRC Screening Program.