Abstract
The phylogenetic position of Proterosuchus fergusi (Lower Triassic of South Africa) as one of the most basal archosauriforms means that it is critically important for understanding the successful evolutionary radiation of archosaurs during the Mesozoic. The excellent sample of the species provides a unique opportunity to understand early archosauriform ontogeny. Qualitative and quantitative analyses of cranial ontogenetic variation were conducted on an ontogenetic sequence, in which the smallest individual is 37% of the size of the largest one and osteohistological evidence suggests that four of 11 collected specimens had not reached sexual maturity. Through ontogeny the skull of Proterosuchus became proportionally taller, the infratemporal fenestra larger, and the teeth more isodont and numerous but with smaller crowns. The sequence of somatic maturity supports relatively high growth rates during early ontogeny. The skull of juvenile specimens of Proterosuchus closely resembles adults of the basal archosauromorph Prolacerta, whereas adult specimens resemble adults of more derived archosauriforms. As a result, a plausible hypothesis is that ontogenetic modification events (e.g. heterochrony) may have been key drivers of the evolution of the general shape of the skull at the base of Archosauriformes. These changes may have contributed to the occupation of a new morphospace by the clade around the Permo-Triassic boundary.
Keywords: allometry, Karoo Supergroup, ontogram, Proterosuchidae, South Africa, standardised major axis regression
Introduction
Archosauromorpha is a major group of reptiles that includes all fossil and extant species that are more closely related to living birds and crocodilians than to lepidosaurs (Dilkes, 1998) (Fig.1). The diversification of archosauromorphs following the Permo-Triassic mass extinction (251 Mya) is an excellent example of adaptive radiation in deep time, and has been the focus of extensive recent research (e.g. Brusatte et al. 2008; Butler et al. 2011; Nesbitt, 2011; Sookias et al. 2012; Ezcurra et al. 2014). This evolutionary radiation led to the origin of the crown-group, Archosauria, which includes the dinosaurs and crocodyliforms that dominated terrestrial ecosystems during most of the Mesozoic and that ultimately gave rise to modern birds and crocodilians.
Fig 1.
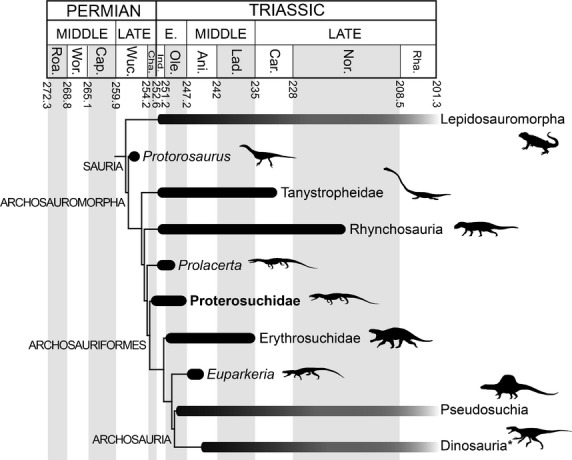
Simplified time calibrated tree showing the phylogenetic relationships among basal archosauromorphs. Phylogenetic relationships based on Gottmann-Quesada & Sander (2009) for Protorosaurus and Ezcurra et al. (2014) for the other taxa. The asterisk next to Dinosauria indicates that also included within this branch are pterosaurs and non-dinosaur dinosauromorphs. Geological timescale after Gradstein et al. (2012). Ani., Anisian; Cap., Capitanian; Car., Carnian; Cha., Changhsingian; Ind., Induan; Lad., Ladinian; Nor., Norian; Ole., Olenekian; Rha., Rhaetian; Roa., Roadian; Wor., Wordian; Wuc., Wuchiapingian.
The fossil reptile Proterosuchus fergusi is known from South African rock sequences that were deposited immediately after the Permo-Triassic mass extinction, and is one of the most basal known members of the key archosauromorph clade Archosauriformes (Fig.1). This clade includes Archosauria and a number of closely related species that share several classic anatomical characteristics of archosaurs, such as the antorbital and external mandibular fenestrae (Gauthier et al. 1988). Proterosuchus fergusi is unique among early archosauromorphs and archosauriforms because it is known from an extensive, highly ontogenetically variable sample of well preserved three-dimensional skulls (Ezcurra & Butler, 2015). Moreover, the cranial morphology of P. fergusi is plesiomorphically similar in its general construction to basal members of other Permo-Triassic archosauromorph lineages (e.g. Protorosaurus speneri, Macrocnemus bessani, Prolacerta broomi, Garjainia prima, Euparkeria capensis) (Gottmann-Quesada & Sander, 2009; Ezcurra et al. 2013, 2014; Sookias & Butler, 2013; Gower et al. 2014). By contrast, other Triassic basal archosauromorphs known from extensive and ontogenetically variable samples possess highly specialised skulls, and their ontogenetic trajectories are probably not useful models for understanding broader macroevolutionary processes (e.g. rhynchosaurids, Langer et al. 2000, and proterochampsids,2000 Trotteyn et al. 2013). As a result, an understanding of ontogenetic changes during the development of P. fergusi has the potential to shed light on the role of ontogenetic modification events (e.g. heterochrony) in the early evolutionary history of archosauromorphs, and the origin and diversification of archosauriforms.
Welman & Flemming (1993) conducted the first quantitative analysis of the cranial morphometrics of the South African proterosuchids, and demonstrated that all known specimens fitted well within a single ontogenetic series. The South African proterosuchid sample has improved in the last 20 years through the collection of new fossil specimens, and the taxonomy of Proterosuchus has been revisited and substantially revised (Ezcurra & Butler, 2015). Moreover, methodological advances over the same time interval have led to new approaches to analysing ontogeny in fossil species (e.g. ontograms: Brochu, 1992). As a result, a new, detailed study of the ontogeny of P. fergusi is necessary and timely. We conduct here qualitative and quantitative analyses of the ontogeny of this species and discuss the implications for the early evolution of Archosauromorpha, which ultimately resulted in the dominance of dinosaurs during the rest of the Mesozoic.
Institutional abbreviations
BP, Evolutionary Studies Institute (formerly Bernard Price Institute for Palaeontological Research), University of the Witwatersrand, Johannesburg, South Africa; BSPG, Bayerische Staatssammlung für Paläontologie und Geologie, Munich, Germany; GHG, Geological Survey, Pretoria, South Africa; NM, National Museum, Bloemfontein, South Africa; RC, Rubidge Collection, Wellwood, Graaff-Reinet, South Africa; SAM-PK, Iziko South African Museum, Cape Town, South Africa; TM, Ditsong National Museum of Natural History (formerly Transvaal Museum), Pretoria, South Africa.
Materials and methods
Studied specimens and available ontogenetic series
The total number of fossil specimens of P. fergusi available for study has increased since Welman & Flemming (1993), and three additional, recently collected, fairly complete skulls are available (BP/1/4224, SAM-PK-11208, K10603). The improved sampling means that seven skulls (BP/1/3993, BSPG 1934 VIII 514, GHG 231, RC 59, 846, SAM-PK-11208, K140) are currently available from which the complete length of the skull can be directly measured (i.e. length between the anterior tip of the premaxilla and the posterior tip of the cranio-mandibular joint). Based on these more complete specimens, it is possible to estimate the skull length of four additional partial skulls with good statistical support (R2 > 0.99; see Data S1). As a result, it is possible to use skull length directly as a standard measurement for the allometric regressions conducted here, contrasting with the use of proxies of skull size by Welman & Flemming (1993).
The neotype of P. fergusi proposed by Ezcurra & Butler (2015) (RC 846) and 10 referred specimens (RC 59, BP/1/3993, 4016, 4224, SAM-PK-11208, K140, K10603, BSPG-1934-VIII-514, TM 201 and GHG 231) were examined first hand (see Ezcurra & Butler, 2015). Precise stratigraphic data is lacking for specimens collected more than 50 years ago (R. Smith, personal communication), but there exists consensus that all specimens studied were collected from the Lystrosaurus Assemblage Zone (earliest Triassic: Induan–early Olenekian) of South Africa (Welman, 1998). The smallest specimen available in the sample (RC 59: total skull length of 177.6 mm) has a skull length that is 37.2% of that of the largest specimen (GHG 231: total skull length of 477.0 mm) (Fig.2). Similarly, the total body length and snout–vent length ratios between the smallest and largest sampled specimens of P. fergusi are estimated at between 35 and 37% [using equations described by Platt et al. 2009 (dorsal cranial length vs. total and snout–vent lengths) for the extant crocodile Crocodylus moreletii to estimate total and snout–vent lengths in the fossil species the ratios are 36.7 and 36.3%, respectively; and using an equation described by Webb & Messel 1978 (total head length vs. snout–vent length for the 13–60 cm size class) for the extant crocodile Crocodylus porosus the ratio is 35.6%]. The broad size range present in the available sample suggests that it can be interpreted as a growth series and approximates the snout–vent length difference between hatchling and maximum adult size of some extant reptiles (e.g. the lepidosaur Gambelia sila; Germano & Williams, 2005: hatchlings are 36.4% of the adult length). However, the size range in the P. fergusi sample is considerably lower than the skull length and snout–vent length ranges observed between hatchling and large adult individuals of some extant crocodiles (e.g. C. moreletii; Pérez-Higareda et al. 1991; Barrios-Quiroz & Casas-Andreu, 2010: hatchlings are 5.6–6.1% of the adult cranial length and 4.6–5.0% of the adult snout–vent length). The substantial differences in size range between P. fergusi and some extant crocodiles are probably because the upper and lower limits of the size range of P. fergusi have not yet been sampled, but it is also possible that this difference at least partially results from differing growth strategies.
Fig 2.
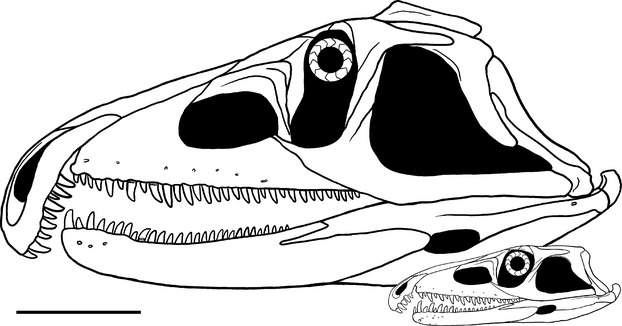
Cranial reconstructions of juvenile and late adult individuals of the proterosuchid archosauriform Proterosuchus fergusi. The difference in size between the two skulls represents the size range of the ontogenetic sequence available in the present study. Scale bar: 10 cm.
Most specimens of P. fergusi consist solely of cranial remains. By contrast, osteohistological assessment of ontogenetic stage in fossil species generally requires postcranial remains (usually limb bones: Hutton, 1986; Games, 1990; Woodward & Moore, 1992; Chinsamy, 1993; Tucker, 1997; Erickson & Brochu, 1999; Erickson et al. 2003; Erickson, 2005). As a result, osteohistological information useful to determine ontogenetic stages is very limited for P. fergusi and is currently limited to two specimens (Botha-Brink & Smith, 2011). The osteohistology of hindlimb bones indicates that the specimen SAM-PK-K140 (total skull length of 287.0 mm: 60.2% of the maximum recorded skull length for the species) was a non-sexually mature individual that was growing relatively fast at the time of its death, with fibro-lamellar bone tissue and no lines of arrested growth (LAGs) (Botha-Brink & Smith, 2011). By contrast, SAM-PK-11208 (total skull length of 350.0 mm: 73.4% of the maximum recorded skull length for the species) possesses lamellar-zonal and parallel-fibered bone tissue with secondary remodelling and multiple LAGs, suggesting that it was a late sub-adult or adult individual at the time of its death (Botha-Brink & Smith, 2011). Botha-Brink & Smith (2011) suggested that the dramatic change in growth observed between SAM-PK-K140 and SAM-PK-11208 was because the latter specimen had reached sexual maturity. Accordingly, it can be hypothesised that the largest known individuals of P. fergusi (e.g. BSPG-1934-VIII-514, TM 201, GHG 231) had reached or were close to the maximum size of the species because they are considerably larger than the probably already sexually mature SAM-PK-11208. By contrast, SAM-PK-K140 and smaller specimens (e.g. RC 59, BP/1/4016, 4224) are considered to be juvenile individuals. In agreement with this idea, the neurocentral sutures are still visible in the postaxial cervical vertebrae of SAM-PK-K140, but these sutures cannot be discerned in the cervical vertebrae of SAM-PK-11208 and BSPG 1934 VIII 514. These sutures progressively close (a closed neurocentral suture has no trace on the surface of the bone sensu Brochu, 1996) in a posterior-anterior pattern along the axial series during the ontogeny of crocodiles and, as a result, it is a useful criterion to determine ontogenetic stages (Brochu, 1996) that has been widely applied to fossil archosaurs (see Irmis, 2007). Accordingly, the available sample seems to be adequate to examine ontogenetic changes during the post-hatchling development of P. fergusi.
The skull reconstruction of the juvenile ontogenetic stage of P. fergusi is based on RC 59 and BP/1/4016 and the reconstruction for the adult ontogenetic stage is based on BSPG 1934 VIII 514, GHG 231 and RC 846 (Ezcurra & Butler, 2015) (Fig.2).
Qualitative analysis
Examination of the growth series of Proterosuchus fergusi revealed variable characters within the sample that can be best explained as ontogenetic variation. Some of these characters cannot be measured or currently show discrete states (e.g. pattern of the sutures on the skull roof, appearance of a pineal fossa). As a result, these characters are discussed qualitatively.
Quantitative analysis: allometric regressions
Raw data for the allometric regressions consisted of 158 linear cranial measurements (plus skull length), the angle between the proximal and distal ends of the quadrate, and tooth counts of the tooth rows of the premaxilla, maxilla and dentary. Measurements were taken first hand with a digital calliper with a maximum deviation of 0.02 mm, but measurements were rounded to the nearest 0.1 mm. Ninety-four of the original measurements were not considered for the allometric regressions because they could only be measured for three or fewer individuals (due to incomplete preservation). As a result, 68 variables were retained and log10-transformed to fit the linear power function before conducting the regression analyses (Gould, 1966).
One regression was calculated for each of the 68 variables using the standardised major axis (SMA) regression method implemented in the package smatr version 3.2.6 for r (Warton et al. 2012; R Development Core Team, 2013). SMA regression was employed instead of ordinary least-squared regression because it has been suggested to be the most appropriate method to study allometry in bivariate data (Warton et al. 2006; Smith, 2009). Some authors have employed the first axis of a principal component analysis (PCA) as proxy for body size in allometric regression analyses (e.g. Fernández Blanco et al. 2015). However, PCA is not a reliable method for the present dataset because of the low number of variables that could be measured for all or most of the specimens (PCA does not allow missing data). As a result, total skull length was used as the independent variable for all SMA regressions.
R2 and P-values were obtained from each SMA regression. Variables were excluded from further consideration if their regression against skull length was statistically non-significant. For variables with a statistically significant fit, the allometric coefficient (K) (i.e. the slope of the regression) with its respective 90% confidence intervals (CIs) was calculated and a statistical test (Pitman, 1939; Warton et al. 2006) was conducted to determine whether the slope was significantly different from 1 (H0 = slope not different from 1). Growth was considered isometric if the allometric coefficient was not significantly different from 1. Conversely, the growth was considered allometric if the allometric coefficient was significantly (P < 0.05) or marginally significantly (0.05 < P < 0.10) different from 1 (i.e. K > 1 represents a positive allometry and K < 1 a negative allometry).
After conducting the SMA regressions, the distribution of the slopes (and their lower and upper limits) was studied, first using all the variables, and then separating the variables into four different groups in order to determine differential patterns in different regions of the skull. These four groups consisted of length, height and width measurements, and variables concerning tooth morphology.
Quantitative analysis: ontogram
The vast majority of specimens of P. fergusi are represented only by cranial remains. As a result, information that could be used to determine the relative ontogenetic stage of specimens, such as the sequence of closure of neurocentral sutures or fusion between other postcranial bones, as well as osteohistological data, is very limited. The aim of an ontogram is to show the sequence of maturity expressed by individuals relative to one another within an ontogenetic series (Brochu, 1992; Carr & Williamson, 2004; Tykoski, 2005; Carr, 2010; Frederickson & Tumarkin-Deratzian, 2014). The basic idea behind an ontogram is the same as a phylogenetic analysis, but species or supraspecific taxa are replaced with individuals and phylogenetically informative characters are replaced with ontogenetically variable characters.
An ontogram was constructed here to reconstruct the sequence of maturity of the P. fergusi sample. The character list is composed of 20 characters, including 12 continuous and eight discrete and discretised characters, scored across the 11 available specimens (see Data S2, S3). Maximum parsimony was chosen as the optimality criterion and the data matrix was analysed using tnt version 1.1 (Goloboff et al. 2008) with the implicit enumeration algorithm. Continuous characters (e.g. ratio between length of the premaxillary body and total length of the skull) were analysed as such, and as a result implied weights (with a concavity constant of 10) were used to mitigate the effects of disproportionate character-state transformations among these characters and reduce homoplasy (Goloboff et al. 2006). Zero length branches were collapsed following the search.
The analysis was conducted rooting the trees with the smallest available specimen (RC 59). A second, a posteriori analysis was conducted using a hypothetical root (= artificial embryo of Carr & Williamson, 2004) scored with supposed hatchling character-states to test the polarity reconstructed in the first analysis, resembling the protocol followed by Carr (2010). Hatchling character-states in the artificial embryo were inferred based upon the morphological trends observed among small specimens. In the case of the continuous characters, the scored ratios for the actual specimens seem to tend to 0 or 1 through ontogeny, respectively. As a result, the extreme values 0 and 1 were used as scorings for the artificial embryo depending on the tendency observed through ontogeny in the actual specimens (see Data S4). An artificial adult (sensu Carr & Williamson, 2004) was not used in this second analysis in order to decrease the number of a priori assumptions and leave the optimality criterion to choose character polarities (cf. a traditional phylogenetic analysis). As an additional test of the reconstructed sequence of maturity, total skull length was optimised on the recovered most parsimonious trees (MPTs). Subsequently, a set of resampled trees was generated using 10 000 pseudoreplications of Monte Carlo randomisations. A statistical test, based on the number of values obtained from the simulated trees that presented a higher consistency index than the original value, was conducted to test whether skull length fitted the MPTs significantly better than random, as is expected for an ontogram. The significance coefficient (α) for this statistical analysis was at the 0.05 level.
Bivariate plots, thin plate spline analysis and general statistics
The thin plate spline (= deformation grid) analysis showing changes in skull morphology through ontogeny of P. fergusi was conducted following a basic geometric morphometric analysis using 21 landmarks on the reconstructed juvenile and adult stages, respectively (see Discussion). The geometric morphometric and thin plate spline analyses, bivariate plots, statistical parameters of slope distributions, and Shapiro–Wilk tests of normality distribution (α = 0.05) were conducted and/or calculated in r (packages shapes version 1.1-9 and stats version 2.16.0).
Results
Qualitative analysis
The hypodigm of P. fergusi possesses a high degree of anatomical variation. Some of these variations cannot be explained as ontogenetic changes, such as the closure of the infratemporal fenestra by a complete lower temporal bar in some specimens and a narrower supratemporal fossa in others (Ezcurra & Butler, 2015). However, at least three anatomical variations within the hypodigm of P. fergusi can be explained as ontogenetic changes.
Isodont maxillary dentition
Anterior maxillary tooth crowns are distinctly distally curved and the posterior crowns are only very weakly distally curved in the smaller individuals of P. fergusi (RC 59, BP/1/4016) (Fig.3A,B). By contrast, the posterior maxillary tooth crowns are also strongly curved distally in medium- to large-sized individuals (SAM-PK-K10603, RC 96, GHG 231). As such, the maxillary tooth series of larger individuals is more isodont (Charig & Reig, 1970) (Fig.3C,D).
Fig 3.
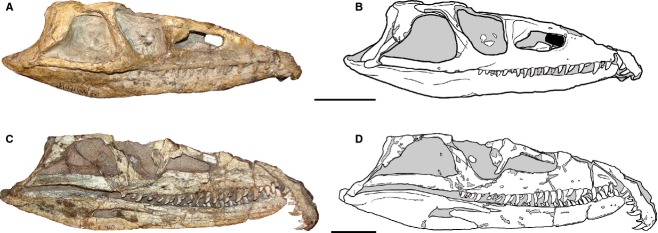
Juvenile (A, B: BP/1/4016, reversed) and adult (C, D: SAM-PK-11208, reversed) skulls of Proterosuchus fergusi in lateral view, showing the changes in number, shape and size of maxillary tooth crowns during ontogeny. Scale bars: 5 cm.
Skull roof sutures
The fronto-nasal, fronto-parietal and parietal-interparietal sutures are strongly interdigitated in small specimens, with the fronto-nasal and fronto-parietal sutures showing anteroposteriorly well developed projections (RC 59, BP/1/4016, 4224). For example, the interdigitated fronto-parietal suture reaches posteriorly almost as far as the anteromedial margin of the supratemporal fossae in RC 59 (Fig.4A). By contrast, in larger individuals these sutures still possess an interdigitated pattern, but have projections that are considerably less well developed anteroposteriorly (SAM-PK-K10603, RC 96, BSPG 1934 VIII 514, TM 201, GHG 231) (Fig.4B).
Fig 4.
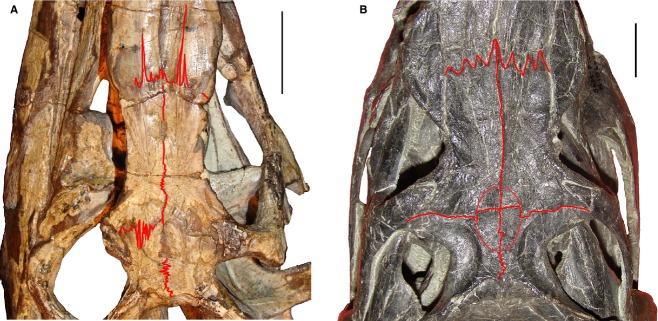
Orbital and temporal regions of skulls of a juvenile (A: RC 59) and a medium-sized (B: SAM-PK-K10603) specimen in dorsal views. Fronto-nasal, fronto-parietal, frontal-frontal and parietal-parietal sutures, and the pineal fossa are highlighted with lines. Scale bars: 2 cm.
Pineal fossa
A pineal fossa on the dorsal surface of the frontals and parietals is only observed in large individuals of P. fergusi (BP/1/3993, SAM-PK-K9957, SAM-PK-K10603, RC 96, TM 201, GHG 231) (Fig.4B). In BPSG-1934-VIII-514 the dorsal surface of the parietals is damaged and, as a result, the condition of this feature cannot be determined. By contrast, in the smallest individuals of the ontogenetic series the skull roof lacks a pineal fossa (RC 59, BP/1/4016, 4224) (Fig.4A).
Other changes
The main axis of the postnarial process of the premaxilla is subparallel to the alveolar margin of the bone in the smallest preserved specimen of P. fergusi (RC 59) (Fig.5A,B). By contrast, in all other specimens of the species the postnarial process is downturned with respect to the main axis of the alveolar margin (e.g. BP/1/3993, BSPG 1934 VIII 514, RC 846, SAM-PK-11208, TM 201) (Fig.5C,D). This variation can be interpreted as either non-ontogenetically related or ontogenetically related because RC 59 is the only specimen with this morphotype. Nevertheless, the presence of this feature in the smallest known specimen of the growth series might indicate that the change in orientation of the postnarial process occurred very early in ontogeny. This hypothesis could be tested with a future improved sample of early juvenile specimens of P. fergusi.
Fig 5.
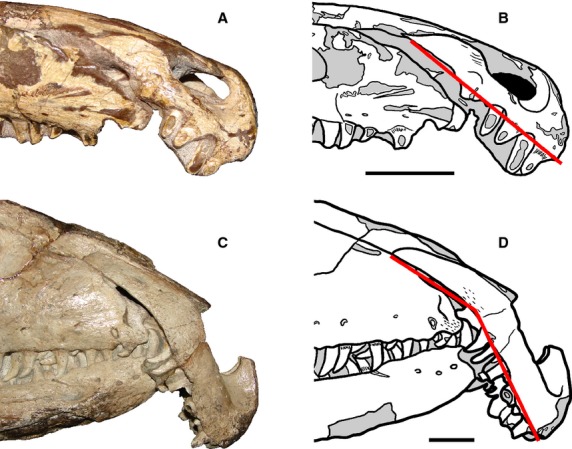
Anterior half of the snout of a juvenile (A, B: RC 59) and an adult (C, D: RC 846, neotype, reversed) of Proterosuchus fergusi. Lines show the changes in orientation of the postnarial process of the premaxilla with respect to the alveolar margin of the bone during ontogeny. Scale bars: 2 cm.
Previous authors suggested that the pattern of tooth replacement of P. fergusi changed during ontogeny (Broom, 1946). However, in agreement with Welman (1998), we were unable to recognise any clear change in this feature in the ontogenetic sequence. Similarly, no conclusive evidence was identified supporting the hypothesis of a migration of the internal choanae to a more posterior position during ontogeny (contra Welman & Flemming, 1993).
Quantitative analysis
Allometric regressions
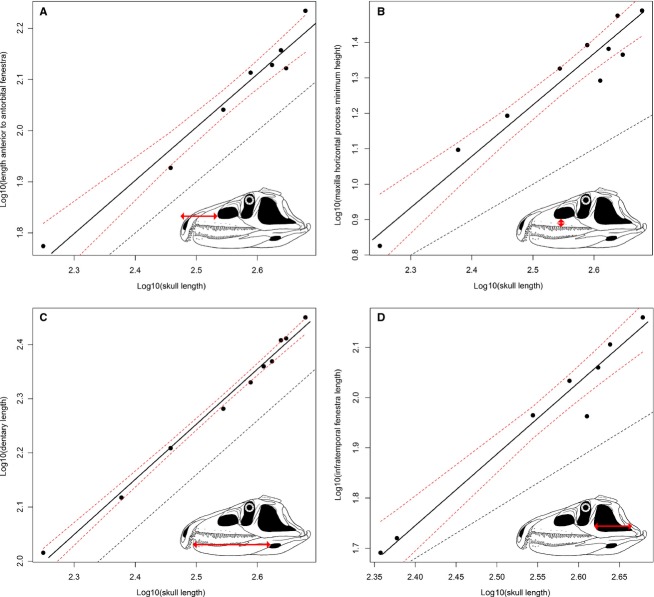
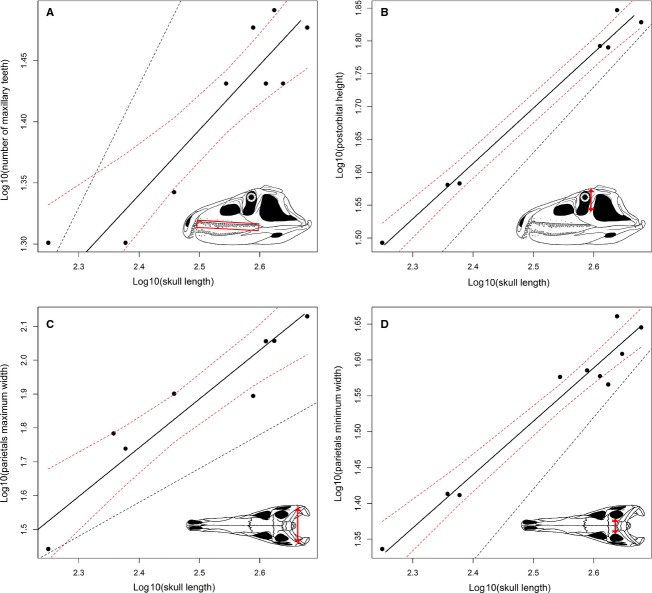
Nineteen of the original 68 variables failed the regression test (P > 0.05) and these measurements were excluded because they do not show a significant relation with size (as measured by skull length) (e.g. width of the supratemporal fenestra, angle between the proximal and distal ends of the quadrate, length and height of the external mandibular fenestra, and width and height of the supraoccipital; see Data S5). Thirty-six variables (73.5% of the variables with a significant regression) show a slope that does not significantly depart from K = 1 (Figs6A,C and 7A; Table1). Seven measurements show a positive allometric trend (14.3% of the variables with a significant regression), of which four are height measurements (Figs6B,D, 7B and 8C; Table1). Six variables show a negative allometric trend (12.2% of the variables with a significant regression), of which four are variables describing tooth morphology (Fig.8A,B,D; Table1). The mean of all of the 49 recovered slopes is very close to K = 1 because most of the variables are length and width measurements, and the means of the slopes of the length and width measurements are very close to K = 1 (Table2). The slopes of the variables related to height measurements have a mean of around K = 1.2, and those related to tooth morphology have a slope of around K = 0.7.
Fig 6.
Bivariate plots showing isometric (A, C) and positive allometric (B, D) trends. Dotted lines show the limits of the 90% confidence intervals and a line with a slope equal to 1, respectively.
Fig 7.
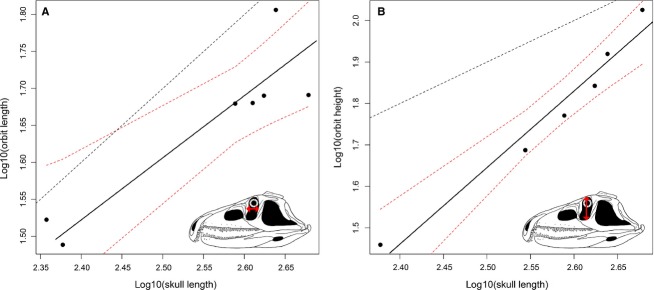
Bivariate plots showing the possible negative allometric trend of (A) the length of the orbit and (B) the positive allometric trend of the height of the orbit. Dotted lines show the limits of the 90% confidence intervals and a line with a slope equal to 1, respectively.
Table 1.
Results of the SMA regressions using total skull length as the independent variable
| Measurement | n | R 2 | P-value (regression test) | Slope | Lower limit (90% CI) | Upper limit (90% CI) | P-value (isometry test) | Trend |
|---|---|---|---|---|---|---|---|---|
| Skull maximum height | 5 | 0.9013 | 0.0136 | 1.5614 | 1.0312 | 2.3642 | 0.0848 | (+) |
| Length anterior to antorbital fenestra | 8 | 0.9627 | < 0.0001 | 1.0390 | 0.8920 | 1.2102 | 0.6445 | = |
| Postorbital region maximum width | 6 | 0.7119 | 0.0371 | 1.2538 | 0.7272 | 2.1619 | 0.4430 | = |
| Premaxillary body length | 7 | 0.9094 | 0.0008 | 1.2279 | 0.9392 | 1.6053 | 0.1850 | = |
| Premaxillary body height | 9 | 0.8714 | 0.0002 | 1.2245 | 0.9498 | 1.5786 | 0.1761 | = |
| Number of premaxillary teeth | 8 | 0.6498 | 0.0156 | 0.6983 | 0.4436 | 1.0994 | 0.1798 | = |
| Largest premaxillary tooth length at base | 7 | 0.7902 | 0.0074 | 1.1434 | 0.7650 | 1.7088 | 0.5408 | = |
| Snout minimum width | 9 | 0.9256 | < 0.0001 | 0.8868 | 0.7303 | 1.0766 | 0.2806 | = |
| Maxilla length | 8 | 0.9610 | < 0.0001 | 1.1000 | 0.9411 | 1.2856 | 0.2811 | = |
| Maxilla horizontal process minimum height | 10 | 0.9339 | < 0.0001 | 1.4498 | 1.2254 | 1.7154 | 0.0031 | + |
| Maxilla length anterior to antorbtial fenestra | 9 | 0.9560 | < 0.0001 | 1.0918 | 0.9401 | 1.2581 | 0.3036 | = |
| Number of maxillary teeth | 9 | 0.8386 | 0.0005 | 0.5323 | 0.4008 | 0.7070 | 0.0030 | − |
| Largest maxillary tooth height | 9 | 0.6910 | 0.0054 | 0.6598 | 0.4475 | 0.9727 | 0.0810 | (−) |
| Largest maxillary tooth length at base | 10 | 0.6201 | 0.0068 | 0.6045 | 0.4073 | 0.8972 | 0.0426 | − |
| Antorbital fenestra length | 6 | 0.9679 | 0.0004 | 0.9721 | 0.8041 | 1.1753 | 0.7682 | = |
| Lacrimal length | 4 | 0.9275 | 0.0369 | 0.9799 | 0.5764 | 1.6659 | 0.9249 | = |
| Lacrimal height | 6 | 0.7111 | 0.0349 | 1.3518 | 0.7834 | 2.3323 | 0.3184 | = |
| Jugal anterior process height | 10 | 0.7504 | 0.0012 | 1.3242 | 0.9589 | 1.8288 | 0.1458 | = |
| Orbit length | 7 | 0.8210 | 0.0049 | 0.8406 | 0.5790 | 1.2200 | 0.3986 | = |
| Orbit height | 6 | 0.9567 | 0.0007 | 1.8453 | 1.4808 | 2.2995 | 0.0033 | + |
| Frontal length | 8 | 0.9512 | < 0.0001 | 0.9001 | 0.7562 | 1.0714 | 0.2864 | = |
| Frontals minimum width | 9 | 0.7344 | 0.0032 | 0.9030 | 0.6293 | 1.2958 | 0.6162 | = |
| Postfrontal oblique length | 5 | 0.8219 | 0.0338 | 0.7680 | 0.4450 | 1.3256 | 0.3532 | = |
| Postorbital length | 7 | 0.8586 | 0.0026 | 1.4765 | 1.0586 | 2.0593 | 0.0634 | (+) |
| Postorbital height | 7 | 0.9860 | < 0.0001 | 0.8436 | 0.7586 | 0.9382 | 0.0231 | − |
| Squamosal length | 6 | 0.7033 | 0.0370 | 0.9523 | 0.5482 | 1.6541 | 0.8662 | = |
| Squamosal height | 8 | 0.9206 | 0.0002 | 1.2089 | 0.9686 | 1.5088 | 0.1480 | = |
| Squamosal ventral process height | 8 | 0.8810 | 0.0005 | 1.2891 | 0.9838 | 1.6891 | 0.1180 | = |
| Squamosal ventral process base length | 8 | 0.8310 | 0.0016 | 0.8916 | 0.6470 | 1.2287 | 0.5191 | = |
| Infratemporal fenestra length | 8 | 0.9611 | < 0.0001 | 1.4242 | 1.2187 | 1.6642 | 0.0042 | + |
| Infratemporal fenestra height | 6 | 0.9092 | 0.0032 | 1.3923 | 1.0152 | 1.9094 | 0.0888 | (+) |
| Supratemporal fenestra length | 10 | 0.8230 | 0.0002 | 1.1224 | 0.8541 | 1.4750 | 0.4588 | = |
| Supratemporal fossa width | 11 | 0.7965 | 0.0012 | 1.2118 | 0.8820 | 1.6649 | 0.2942 | = |
| Quadrate height | 5 | 0.8144 | 0.0360 | 1.2864 | 0.7376 | 2.2434 | 0.3814 | = |
| Parietal length | 10 | 0.8314 | 0.0002 | 1.0100 | 0.7736 | 1.3188 | 0.9468 | = |
| Parietals maximum width | 8 | 0.8912 | 0.0004 | 1.4396 | 1.1113 | 1.8648 | 0.0326 | + |
| Parietals minimum width | 10 | 0.9528 | < 0.0001 | 0.7445 | 0.6458 | 0.8584 | 0.0046 | − |
| Width between paroccipital processes | 6 | 0.7940 | 0.0171 | 1.3823 | 0.8668 | 2.2043 | 0.2202 | = |
| Ectopterygoid width | 5 | 0.8044 | 0.0391 | 1.1266 | 0.6374 | 1.9912 | 0.6717 | = |
| Lower jaw length | 7 | 0.9743 | < 0.0001 | 0.9830 | 0.8512 | 1.1352 | 0.8212 | = |
| Dentary length | 10 | 0.9915 | < 0.0001 | 1.0180 | 0.9582 | 1.0814 | 0.5981 | = |
| Dentary anterior height | 10 | 0.8966 | < 0.0001 | 0.8986 | 0.7285 | 1.1083 | 0.3734 | = |
| Number of dentary teeth | 6 | 0.7152 | 0.0338 | 0.4524 | 0.2631 | 0.7778 | 0.0300 | − |
| Surangular height | 9 | 0.6858 | 0.0058 | 0.9917 | 0.6706 | 1.4666 | 0.9697 | = |
| Angular length | 5 | 0.9576 | 0.0037 | 0.9604 | 0.7287 | 1.2660 | 0.7566 | = |
| Angular height | 8 | 0.7804 | 0.0036 | 0.9398 | 0.6533 | 1.3520 | 0.7566 | = |
| Retroarticular process length | 6 | 0.8086 | 0.0147 | 1.0272 | 0.6544 | 1.6125 | 0.9081 | = |
| Retroarticular process width | 5 | 0.9641 | 0.0029 | 1.0218 | 0.7922 | 1.3180 | 0.8560 | = |
| Retroarticular process height | 6 | 0.7650 | 0.0226 | 0.8948 | 0.5448 | 1.4697 | 0.6699 | = |
(+), marginally significant positive allometry; (−), marginally significant negative allometry; +, positive allometry; −, negative allometry; =, isometry; CI, confidence interval; n, size of the variable.
Fig 8.
Bivariate plots showing negative (A, B, D) and positive (C) allometric trends. Dotted lines show the limits of the 90% confidence intervals and a line with a slope equal to 1, respectively.
Table 2.
Statistical parameters of the distribution of slopes and their upper and lower limits
| Group | N | Mean | Upper limit mean | Lower limit mean | Median | Upper limit median | Lower limit median |
|---|---|---|---|---|---|---|---|
| All variables | 49 | 1.0683 (SD = 0.2796) | 1.4840 (SD = 0.4317) | 0.7838 (SD = 0.2367) | 1.0218 | 1.4670 | 0.7650 |
| Length | 19 | 1.0413 (SD = 0.17778) | 1.3850 (SD = 0.2603) | 0.7982 (SD = 0.1945) | 1.0100 | 1.2860 | 0.8041 |
| Height | 15 | 1.2335 (SD = 0.2811) | 1.7203 (SD = 0.4441) | 0.8994 (SD = 0.2421) | 1.2864 | 1.6891 | 0.9498 |
| Width | 9 | 1.1078 (SD = 0.2367) | 1.6040 (SD = 0.4879) | 0.7803 (SD = 0.1558) | 1.1266 | 1.6649 | 0.7303 |
| Teeth | 6 | 0.6818 (SD = 0.2428) | 1.0272 (SD = 0.3618) | 0.4546 (SD = 0.1663) | 0.6318 | 0.9349 | 0.4254 |
N, size of the variable; SD, standard deviation.
As a result, the length and width of the skull of P. fergusi show a general pattern of isometric growth during ontogeny. For example, the length of the premaxilla, maxilla, frontal, orbit and dentary all show isometric growth (Table1), implying that the elongated snout and enlarged premaxilla that are characteristic of proterosuchids did not significantly change its proportions during ontogeny. By contrast, the skull becomes proportionally taller through ontogeny, as demonstrated by the positive allometric growth of the maximum height of the skull, minimum height of the horizontal process of the maxilla, and heights of the orbit and infratemporal fenestra. Although the absolute number of tooth positions increases considerably through ontogeny for all the tooth-bearing bones (Ezcurra et al. 2013; see Ontogram), the ratio between tooth counts and the lengths of the bones is significantly negative (Fig.8A; Table3). In addition, at least maxillary tooth crowns become proportionally apicobasally shorter and mesiodistally narrower during ontogeny.
Table 3.
Results of the SMA regressions using the respective tooth-bearing bone lengths as independent variables
| Measurement | N | R 2 | P-value (regression-test) | Slope | Lower limit (90% CI) | Upper limit (90% CI) | P-value (isometry-test) | Trend |
|---|---|---|---|---|---|---|---|---|
| Premaxillary tooth count | 7 | 0.7015 | 0.0186 | 0.5390 | 0.3354 | 0.8662 | 0.0186 | − |
| Maxillary tooth count | 8 | 0.9022 | 0.0003 | 0.4923 | 0.3620 | 0.6696 | 0.0009 | − |
| Dentary tooth count | 6 | 0.6808 | 0.0432 | 0.4505 | 0.2546 | 0.7972 | 0.0351 | − |
−, negative allometry; CI, confidence interval; N, size of the variable.
Ontogram
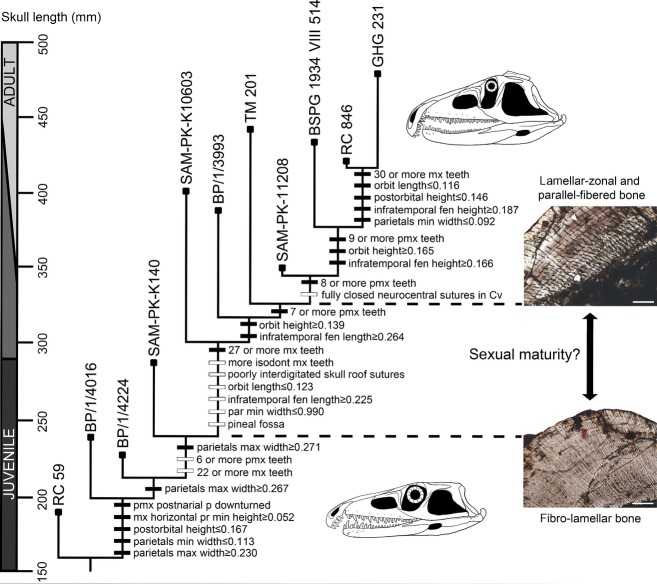
The parsimony analysis yielded a single most parsimonious tree (MPT) with a fit score of 0.22015, a consistency index (CI) of 0.8598, and a retention index (RI) of 0.8724. The tree is fully resolved and its overall topology shows a general tendency of increase in body size towards its apex (Fig.9). The smallest non-rooted specimens are found as successive sister-individuals of larger specimens at the base of the tree (BP/1/4016, 4224), and three of the four largest specimens are placed at the apex (BSPG 1934 VIII 514, RC 846, GHG 231). The resampling statistical test found that the total length of the skull fits significantly to the topology of the recovered MPT (P = 0.0013). This result is in agreement with the a priori assumption that the ontogram shows a sequence of maturity (Brochu, 1992). The topology and optimisation of the characters on the tree were not affected when the tree was rooted with an artificial embryo (i.e. RC 59 was still found as the least mature specimen). Several ambiguous ontomorphies (sensu Frederickson & Tumarkin-Deratzian, 2014) are optimized under accelerated transformations (ACCTRAN) for the nodes that include SAM-PK-K140 and SAM-PK-K10603, and more mature individuals, respectively. These ambiguous optimizations are a result of the multiple missing scorings present in BP/1/4224 and SAM-PK-K140.
Fig 9.
Single recovered most parsimonious ontogram showing the sequence of somatic maturity of the available ontogenetic sequence of Proterosuchus fergusi. Ontogenetic changes indicated with a black box are unambiguously optimised characters (synontomorphies) and changes indicated with a white box are characters optimised under an ACCTRAN optimisation (possible ontomorphies). Upper thin-section shows the bone microstructure of the probable sexually mature SAM-PK-11208 and the lower thin-section shows the bone microstructure of the probably sexually immature SAM-PK-K140. (Taken from Botha-Brink & Smith, 2011).
The sequence of optimisation of the continuous characters on the tree is in general agreement with the results of the allometric regressions. Measurements with significant negative allometries show a decrease in their ratios with respect to the total length of the skull through the ontogram (e.g. parietal minimum width, postorbital height). Conversely, measurements with significant positive allometries show an increase of their ratios through ontogeny (e.g. maxillary horizontal process height, orbit height, infratemporal fenestra height, parietal maximum width, infratemporal fenestra length, infratemporal fenestra height).
Orbit length was recovered as having an isometric growth by the allometric regression analysis, but in the ontogram it optimises with a tendency to decrease in its proportional size towards more mature individuals. This result suggests negative allometric growth for this measurement, which is in agreement with the low slope found in its SMA regression (K = 0.8406). However, the relatively low regression coefficient (R2 = 0.8210) and the low number of specimens that could be measured for this variable might have resulted in a negative allometric pattern being overlooked by the statistical test of isometry. The presence of a positive allometry in orbit height and a negative allometry in orbit length seems a likely explanation for the drastic modifications that occur in the shape and relative size of the orbit through the ontogeny of P. fergusi (Fig.2).
The numbers of tooth positions in the premaxilla and maxilla, which are correlated with the number of tooth positions in the dentary (R2 = 0.9888), increase through ontogeny, from five to nine premaxillary teeth, 20 to 30–31 maxillary teeth, and 18–28 dentary teeth. Other ontogenetic changes recovered by the ontogram include a downturned postnarial process of the premaxilla with respect to the alveolar margin of the bone, the appearance of a pineal fossa, more isodont maxillary tooth crowns (all strongly distally curved), less interdigitated sutures on the skull roof, and completely closed neurocentral sutures in cervical vertebrae.
Discussion
Comparisons with previous studies
The increased number of specimens of P. fergusi available when compared with the analysis of Welman & Flemming (1993) allowed the direct use of skull length as the independent variable, constituting a clear step forward in the analysis of allometric regressions. For example, the standard measurement (i.e. the proxy for overall size) most widely used by Welman & Flemming (1993) was the minimum width between both parietals. However, our analysis has demonstrated that this variable has a negative allometric trend with respect to skull length (K = 0.7445, P = 0.0046). Use of a variable with a negative allometric trend as the independent variable will tend to produce a systematic bias towards higher slope values.
The histogram showing the frequency of slopes recovered in this analysis shows that the highest frequencies are situated around K = 1 (mean = 1.0683, SD = 0.2796, median = 1.0218). As a result, the general tendency of the cranial allometric regressions in the skull of P. fergusi is isometric (Fig.10A; Table2). The distribution of the slopes is slightly skewed towards values higher than 1, but a Shapiro–Wilk test failed to reject the null hypothesis of a normal distribution (P = 0.8795). The mean of the distribution of slopes recovered by Welman & Flemming (1993) is 0.9093 (SD = 0.4178) and the median is 0.8100. The histogram of slope frequencies of Welman & Flemming (1993) is strongly skewed towards values higher than 1 (Fig.10B) and the Shapiro–Wilk test rejected the normality of the distribution of these slopes (P < 0.0001), in contrast to our results.
Fig 10.
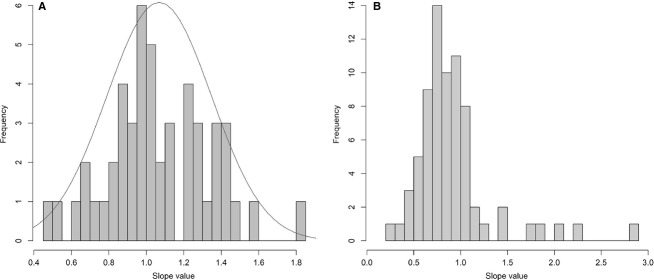
Histograms showing the distribution of slopes recovered in the present SMA regressions (A) and the analysis of Welman & Flemming (1993) (B). The line in (A) represents a normal distribution adjusted to the dataset.
A second allometric analysis was conducted using the minimum width of the parietals as the independent variable in order to test the possible influence of this variable in the study of Welman & Flemming (1993). We employed the same variables as in our initial analysis, but replaced skull length with the minimum width of the parietals as the standard measurement. In this new analysis, 26 of the 49 regressions show a positive allometric trend, the mean of the slope values is 1.4111 (SD = 0.3545) and the median is 1.3566. These results indicate a general positive allometric trend (which is probably the result of a systematic bias), contrasting with the general isometric trend recovered by our original analysis. For example, the length of the dentary was found to have a significant positive allometry in this alternative analysis (K = 1.3566, P = 0.0095), but a statistically well supported isometric trend in our original analysis. The Shapiro–Wilk test failed to reject the null hypothesis of a normal distribution (P = 0.8011), resembling the result of our original analysis but contrasting with the distribution of slope values recovered by Welman & Flemming (1993). A t-test found a significant difference between the slopes recovered using skull length vs. minimum width of the parietals as alternative independent variables (P < 0.0001). As a result, use of a different independent variable in the present study partially, but not completely (e.g. it does not explain the change in the shape of the distribution of the slope values), explains the differences between the results of our original analysis and the results recovered by Welman & Flemming (1993). Differences in specimen sampling, because of the addition of recently collected specimens and the effects of the recently revised taxonomy, and measurements may also contribute to the differences observed with the results of Welman & Flemming (1993).
Sequence of somatic maturity in P. fergusi
The result of the ontogram is in agreement with osteohistological data that indicates that SAM-PK-11208 is a more mature individual than SAM-PK-K140 (Botha-Brink & Smith, 2011) (Fig.9). In addition, Botha-Brink & Smith (2011) proposed that SAM-PK-11208 may have reached sexual maturity, whereas SAM-PK-K140 had not. Following these lines of evidence, the ontogram suggests that P. fergusi reached sexual maturity in individuals with skull lengths that were at least 60.2–73.4% of the skull length of the largest individual currently known. Botha-Brink & Smith (2011) proposed that P. fergusi possessed relatively rapid continuous growth, without LAGs, prior to reaching sexual maturity, and until reaching at least 67% of the maximum recorded skull length of the species. However, these authors slightly underestimated the maximum recorded skull length of P. fergusi, and rapid continuous growth continued until reaching at least 60.2% of the maximum skull length (Fig.9) and an estimated total body length of at least 60% of the maximum estimated total length of the species (based on the equation of Platt et al. 2009). If the absence of LAGs in SAM-PK-K140 indicates that the specimen is younger than a year old, as has been widely interpreted for other archosauriforms (Botha-Brink & Smith, 2011), this would mean that the onset of sexual maturity was reached after the first year of life.
Similar growth timings are present in disparate diapsid reptiles, such as the ornithischian dinosaur Maiasaura peeblesorum (an individual younger than a year old was up to 50% of the maximum adult total body length; Horner et al. 2000) and the varanoid lizard Varanus niloticus (a year old individual is around 40% of the maximum snout–vent adult length; de Buffrénil & Castanet, 2000).
Botha-Brink & Smith (2011) also suggested the possibility of extremely fast growth in the basal archosauromorph P. broomi, also known from the earliest Triassic of South Africa. They suggested that P. broomi may have reached maximum size within its first year of life (assuming that growth did not temporarily slow down or cease during the unfavourable growing season). However, although some archosauromorphs also grew rapidly in their first year of life (see above), first-year growth rates are considerably lower in many other archosauromorph species (e.g. 15.7% of maximum total body length in extant crocodiles: Huchzermeyer, 2003; 15.3% of maximum femoral length in Psittacosaurus lujiatunensis: Erickson et al. 2009). As a result, rapid first-year growth rates do not appear to be a general character of archosauromorphs – instead, this feature appears to be rather homoplastic within the group. Changes in growth strategies among archosauromorphs may have been influenced by non-phylogenetic, external factors (e.g. climate, interspecific competition) and it is striking that both archosauromorph species known from the Lystrosaurus AZ of South Africa for which information is available on growth rates (P. broomi, P. fergusi) appear to have attained more than 60% of their maximum recorded size during the first year of life.
The result of the ontogram in combination with osteohistological evidence allows the interpretation that RC 59, BP/1/4016, 4224 and SAM-PK-K140 represent sexually immature (juvenile) individuals (skull length < 300 mm) and SAM-PK-11208, BSPG 1934 VIII 514, RC 846 and GHG 231 represent sexually mature (adult) individuals (skull length ≥ 350–444 mm) (Fig.9). The ontogenetic stages of SAM-PK-K10603, BP/1/3993 and TM 201 are ambiguous because they are bracketed by the oldest immature and the youngest mature individuals. The earliest somatic changes recognised within the sampled ontogenetic sequence of P. fergusi include a downturned postnarial process of the premaxilla with respect to the alveolar margin of the bone, increases in the minimum height of the maxillary horizontal process, maximum height of the postorbital and maximum width of the parietals, and a decrease in the minimum width of the parietals. During the somatic maturity of juvenile specimens the maximum width of the parietals continued to increase and the oldest recognised juvenile has six tooth positions in the premaxilla and 22 in the maxilla. Several changes are recognised in the ontogenetic sequence of specimens with an ambiguous ontogenetic stage, including the appearance of a more isodont maxillary dentition, seven tooth positions in the premaxilla and 27 in the maxilla, poorly interdigitated skull roof sutures, pineal fossa, increases in the height of the orbit and length of the infratemporal fenestra, and decreases in the length of the orbit and minimum width of the parietals. Some of these changes may be correlated with the onset of sexual maturity. Somatic changes in the unambiguously recognised youngest sexually mature individual include the presence of eight tooth positions in the premaxilla and fully closed neurocentral sutures in the cervical vertebrae. The latest changes recognised here during the ontogeny of P. fergusi are the presence of nine tooth positions in the premaxilla and 30 or more teeth in the maxilla, increase in the height of the orbit and infratemporal fenestra, and decreases in the length of the orbit, height of the postorbital, and minimum width of the parietals.
Allometric growth patterns in P. fergusi and possible palaeoecological implications
The results of the allometric regressions suggest three main patterns during the ontogeny of P. fergusi: isometric growth in the anteroposterior and transverse directions; positive allometric growth in a dorsoventral direction; and a negative allometric growth of the dentition. The result of the thin plate spline analysis showing changes between the skull reconstruction of a juvenile and an adult individual is in agreement with the results of the allometric regressions and the ontogram (Fig. 11). The areas that suffered stronger shape changes are located in the orbital and temporal regions. The adult thin plate spline shows relative anteroposterior and dorsoventral elongations in the area occupied by the infratemporal fenestra and a relative dorsoventral elongation in the area occupied by the orbit. Conversely, the area occupied by the orbit shows a relative anteroposterior shortening. No landmarks were placed on the tooth crowns, but a reduction in the size of the premaxillary and maxillary teeth is evident in a comparison of the reconstructions of the juvenile and adult skulls.
Fig 11.
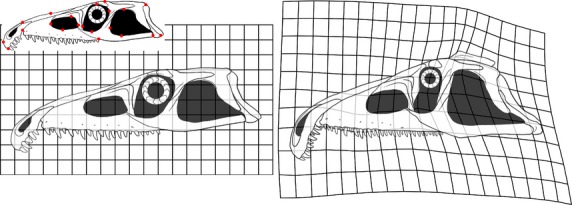
Position of the 21 landmarks (red dots) used for the basic geometric morphometric analysis (juvenile smaller skull on the upper left corner of the figure) and results of the thin-plate spline analysis for the juvenile (left) and adult (right).
The changes in morphology observed between juvenile and adult individuals of P. fergusi may have had implications for the palaeoecology of the species. The presence in juveniles of a dorsoventrally lower and more gracile skull, with less numerous and proportionally larger teeth than in the adult forms, may have resulted in different prey selections between juveniles and adults. This behavioural differentiation would have reduced the degree of intraspecific competition between the two ontogenetic stages. This hypothesis could be tested in the future with morphofunctional analyses that go beyond the scope of this paper.
Implications for early archosauromorph evolution
The role of ontogenetic modifications between ancestor-descendant species in the early evolution of archosauromorphs and archosauriforms is mostly unknown because of the scarce knowledge of the ontogenetic development of basal members of these clades. The new information presented here for P. fergusi provides the most detailed insight yet available into the ontogenetic development of an early archosauromorph species. However, the ontogenetic development of other early archosauromorph and archosauriform species remains poorly understood, greatly hampering detailed analyses of ontogenetically related evolutionary processes. The ontogenetic changes demonstrated here for P. fergusi allow us to propose some novel hypotheses about the role of ontogenetic modification in the early archosauromorph radiation. These hypotheses can be tested by future, more complete sampling of the ontogenetic trajectories of other basal archosauromorphs.
Juvenile specimens of P. fergusi possess a dorsoventrally low skull, with a sub-circular orbit. This morphology closely resembles the generalised morphology present in adult specimens of protorosaurs (one of the most basal archosauromorph radiations) and P. broomi (Modesto & Sues, 2004; Gottmann-Quesada & Sander, 2009) (Fig.12). By contrast, adult specimens of P. fergusi possess a dorsoventrally deeper and more massive skull, with an anteroposteriorly compressed, suboval orbit. This morphology closely resembles the generalised skull morphology of adult individuals of the more crownward archosauriforms Erythrosuchidae (e.g. Ga. prima, Erythrosuchus africanus: Gower, 2003; Ezcurra et al. 2013) and Euparkeria capensis (Ewer, 1965).
Fig 12.
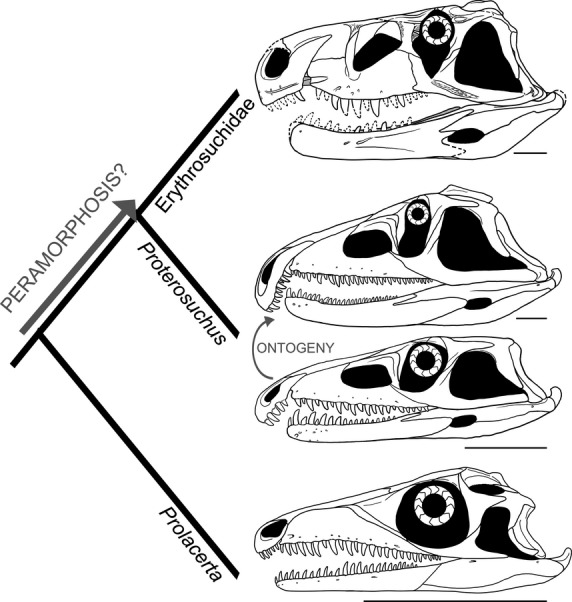
Simplified phylogenetic relationships in the non-archosauriform archosauromorph to archosauriform transition showing the possible direction of heterochronic changes that contributed to the evolution of overall skull shape. Note the similarities between the juvenile skull of Proterosuchus fergusi and the adult of Prolacerta broomi, and the adult of P. fergusi and an adult erythrosuchid (based on Garjainia prima). Scale bars: 5 cm.
In a phylogenetic context, this means that juveniles of P. fergusi resemble the adults of early archosauromorphs, including a species repeatedly recovered as the sister-taxon of Archosauriformes in recent phylogenetic analyses (P. broomi; Modesto & Sues, 2004; Gottmann-Quesada & Sander, 2009; Ezcurra et al. 2014). By contrast, the adults of diverse groups of basal archosauriforms are generally similar to one another in overall skull construction (Fig.12). As a result, we hypothesise that ontogenetic modification events (probably peramorphosis) may have been the main drivers in the evolution of the general shape of the skull (dorsoventral height, shape of the orbit) at the base of Archosauriformes. This hypothesis implies that the probable major heterochronic processes are the opposite of those operating in the evolution of early birds, in which the paedomorphic skull morphology of adult birds resembles that of juvenile non-avian theropods (Bhullar et al. 2012). Accordingly, ontogenetic modification events between different species may have contributed to the occupation of a new region of morphospace by early archosauriforms around the Permo-Triassic boundary. The cranial morphospace of non-archosauriform archosauromorphs was limited to gracile and low skulls, possibly adapted to preying upon smaller animals (e.g. insects and small reptiles and synapsids). Massive and dorsoventrally deep skulls are documented for the first time in the archosauromorph evolution in basal archosauriforms (e.g. adult proterosuchids, erythrosuchids and Euparkeria) and this cranial morphology seems to have appeared independently several times in the lineage (e.g. ‘rauisuchians’, ornithosuchids, herrerasaurids; Sereno & Novas, 1993; von Baczko & Ezcurra, 2013; Nesbitt et al. 2013). These massive skulls probably allowed the occupation of new niches, including the role of top predators in their respective ecosystems.
Acknowledgments
We thank the following curators, researchers and collection managers who provided access to specimens under their care for the purpose of this research: Bernhard Zipfel, Bruce Rubidge, Jonah Choiniere and Fernando Abdala (BP); Markus Moser and Oliver Rauhut (BSPG); Ellen de Kock (GHG); Elize Butler and Jennifer Botha-Brink (NM); Sheena Kaal and Roger Smith (SAM); and Heidi Fourie (TM). We especially thank Fernando Abdala for unpublished pictures of RC 846 and Bhart-Anjan Bhullar for allowing us access to unpublished CT data of the same specimen. We thank Steve Brusatte and Mark Webster for useful and insightful comments on a previous version of this manuscript. The comments of two anonymous reviewers helped to improve the overall quality of the manuscript. This work was supported by a grant from the DFG Emmy Noether Programme (BU 2587/3-1 to RJB) and a Marie Curie Career Integration Grant (PCIG14-GA-2013-630123 ARCHOSAUR RISE to RJB). Access to the free version of TNT 1.1 was possible due to the Willi Henning Society.
Supporting Information
Additional Supporting Information may be found in the online version of this article:
Data S1. Total skull length estimations.
Data S2. Character list for the data matrix of the ontogram.
Data S3. TNT file of the data matrix analyzed in this paper.
Data S4. Scorings for the hypothetical root.
Data S5. excel file that includes the raw measurements used for the quantitative analyses (sheet 1), results of the SMA regressions excluding measurements with a n ≤ 3 and non-significant regressions (sheet 2), and results of the SMA regressions using the minimum width of the parietals as independent variable (sheet 3).
References
- von Baczko MB, Ezcurra MD. Ornithosuchidae. In: Nesbitt SJ, Desojo JB, Irmis RB, editors. Anatomy, Phylogeny and Palaeobiology of Early Archosaurs and their Kin. London: Geol. Soc., Spec. Publ; 2013. pp. 187–202. In: 379. [Google Scholar]
- Barrios-Quiroz G, Casas-Andreu G. Crecimiento con diferentes dietas en crías de Crocodylus moreletii Dumeril Bibron and Dumeril 1851 (Crocodylia: Crocodylidae) en cautiverio, Tabasco, México. Rev Latinoam Cons. 2010;1:104–111. [Google Scholar]
- Bhullar B-AS, Marugán-Lobón J, Racimo F, et al. Birds have paedomorphic dinosaur skulls. Nature. 2012;487:223–226. doi: 10.1038/nature11146. [DOI] [PubMed] [Google Scholar]
- Botha-Brink J, Smith RMH. Osteohistology of the Triassic archosauromorphs Prolacerta Proterosuchus Euparkeria, and Erythrosuchus from the Karoo Basin of South Africa. J Vertebr Paleontol. 2011;31:1238–1254. [Google Scholar]
- Brochu CA. 1992. Austin The University of Texas at Austin Ontogeny of the Postcranium in Crocodylomorph Archosaurs. Unpublished M.A. thesis.
- Brochu CA. Closure of neurocentral sutures during crocodilian ontogeny: implications for maturity assessment in fossil archosaurs. J Vertebr Paleontol. 1996;16:49–62. [Google Scholar]
- Broom R. A new primitive proterosuchid reptile. Ann Transvaal Mus. 1946;20:343–346. [Google Scholar]
- Brusatte SP, Benton MJ, Ruta M, et al. Superiority, competition, and opportunism in the evolutionary radiation of dinosaurs. Science. 2008;321:1485–1488. doi: 10.1126/science.1161833. [DOI] [PubMed] [Google Scholar]
- de Buffrénil V, Castanet J. Age estimation by skeletochronology in the Nile monitor (Varanus niloticus), a highly exploited species. J Herpetol. 2000;34:414–424. [Google Scholar]
- Butler RJ, Brusatte SL, Reich M, et al. The sail-backed reptile Ctenosauriscus from the latest early Triassic of Germany and the timing and biogeography of the early archosaur radiation. PLoS ONE. 2011;6:e25693. doi: 10.1371/journal.pone.0025693. [DOI] [PMC free article] [PubMed] [Google Scholar]
- Carr TD. A taxonomic assessment of the type series of Albertosaurus sarcophagus and the identity of Tyrannosauridae in the Albertosaurus bonebed from the Horseshoe Canyon Formation (Campanian-Maastrichtian, Late Cretaceous) Can J Earth Sci. 2010;47:1213–1226. [Google Scholar]
- Carr TD, Williamson TE. Diversity of late Maastrichtian Tyrannosauridae (Dinosauria: Theropoda) from western North America. Zool J Linn Soc. 2004;142:479–523. [Google Scholar]
- Charig AJ, Reig OA. The classification of the Proterosuchia. Biol J Linn Soc. 1970;2:125–171. [Google Scholar]
- Chinsamy A. Bone histology and growth trajectory of the prosauropod dinosaur Massospondylus carinatus Owen. Mod Geol. 1993;18:319–321. [Google Scholar]
- Dilkes DW. The Early Triassic rhynchosaur Mesosuchus browni and the interrelationships of basal archosauromorph reptiles. Philos Trans R Soc Lond B Biol Sci. 1998;353:501–541. [Google Scholar]
- Erickson GM. Assessing dinosaur growth patterns: a microscopic revolution. Trends Ecol Evol. 2005;20:677–684. doi: 10.1016/j.tree.2005.08.012. [DOI] [PubMed] [Google Scholar]
- Erickson GM, Brochu CM. How the ‘terror crocodile’ grew so big. Nature. 1999;398:205–206. [Google Scholar]
- Erickson GM, de Ricqlès A, de Buffrénil V, et al. Vermiform bones and the evolution of gigantism in Megalania – how a reptilian fox became a lion. J Vertebr Paleontol. 2003;23:966–970. [Google Scholar]
- Erickson GM, Makovicky PJ, Inouye BD, et al. A life table for Psittacosaurus lujiatunensis: initial insights into ornithischian dinosaur population biology. Anat Rec. 2009;292:1514–1521. doi: 10.1002/ar.20992. [DOI] [PubMed] [Google Scholar]
- Ewer RF. The anatomy of the thecodont reptile Euparkeria capensis Broom. Philos Trans R Soc Lond B Biol Sci. 1965;751:379–435. [Google Scholar]
- Ezcurra MD, Butler RJ. Taxonomy of the proterosuchid archosauriforms (Diapsida: Archosauromorpha) from the earliest Triassic of South Africa, and implications for the early archosauriform radiation. Palaeontology. 2015;58:141–170. [Google Scholar]
- Ezcurra MD, Butler RJ, Gower DJ. ‘Proterosuchia’: the origin and early history of Archosauriformes. In: Nesbitt SJ, Desojo JB, Irmis RB, editors. Anatomy, Phylogeny and Palaeobiology of Early Archosaurs and their Kin. London: Geol. Soc., Spec. Publ; 2013. pp. 9–33. 379. [Google Scholar]
- Ezcurra MD, Scheyer TM, Butler RJ. The origin and early evolution of Sauria: reassessing the Permian saurian fossil record and the timing of the crocodile-lizard divergence. PLoS ONE. 2014;9:e89165. doi: 10.1371/journal.pone.0089165. [DOI] [PMC free article] [PubMed] [Google Scholar]
- Fernández Blanco MV, Bona P, Olivares AI, et al. Ontogenetic variation in the skulls of Caiman: the case of Caiman latirostris and Caiman yacare (Alligatoridae, Caimaninae) Herpetol J. 25:65–73. (In press) [Google Scholar]
- Frederickson JA, Tumarkin-Deratzian AR. Craniofacial ontogeny in Centrosaurus apertus. Peer J. 2014;2:e252. doi: 10.7717/peerj.252. [DOI] [PMC free article] [PubMed] [Google Scholar]
- Games I. Growth curves for the Nile crocodile as estimated by skeletochronology. Proceedings of the 10th Working Meeting of the Crocodile Specialist Group, IUCN, Volume 1 Gland, Switzerland The World Conservation Union. 1990. pp. 111–121. Crocodiles.
- Gauthier JA, Kluge AG, Rowe T. Amniote phylogeny and the importance of fossils. Cladistics. 1988;4:105–209. doi: 10.1111/j.1096-0031.1988.tb00514.x. [DOI] [PubMed] [Google Scholar]
- Germano D, Williams DF. Population ecology of blunt-nosed leopard lizards in high elevation foothill habitat. J Herpetol. 2005;39:1–18. [Google Scholar]
- Goloboff PA, Mattoni C, Quinteros YS. Continuous characters analyzed as such. Cladistics. 2006;22:589–601. doi: 10.1111/j.1096-0031.2006.00122.x. [DOI] [PubMed] [Google Scholar]
- Goloboff PA, Farris JS, Nixon KC. TNT, a free program for phylogenetic analysis. Cladistics. 2008;24:774–786. [Google Scholar]
- Gottmann-Quesada A, Sander PM. A redescription of the early archosauromorph Protorosaurus spenseri Meyer, 1832 and its phylogenetic relationships. Palaeontogr Abt A. 2009;287:123–220. [Google Scholar]
- Gould SJ. Allometry and size in ontogeny and phylogeny. Biol Rev. 1966;41:587–640. doi: 10.1111/j.1469-185x.1966.tb01624.x. [DOI] [PubMed] [Google Scholar]
- Gower DJ. Osteology of the early archosaurian reptile Erythrosuchus africanus Broom. Ann S Afr Mus. 2003;110:1–84. [Google Scholar]
- Gower DJ, Hancox PJ, Botha-Brink J, et al. A new species of Garjainia Ochev, 1958 (Diapsida: Archosauriformes: Erythrosuchidae) from the Early Triassic of South Africa. PLoS ONE. 2014;9:e111154. doi: 10.1371/journal.pone.0111154. [DOI] [PMC free article] [PubMed] [Google Scholar]
- Gradstein FM, Ogg JG, Schmitz MD. The Geologic Time Scale 2012. Boston: Elsevier; 2012. p. 144. [Google Scholar]
- Horner JR, de Ricqlés A, Padian K, et al. Long bone histology of the hadrosaurid dinosaur Maiasaurua pebblesorum: growth dynamics and physiology based on an ontogenetic series of skeletal elements. J Vertebr Paleontol. 2000;20:115–129. [Google Scholar]
- Huchzermeyer FW. Crocodiles: Biology, Husbandry and Diseases. London: CABI Publishing; 2003. p. 352. [Google Scholar]
- Hutton JM. Age determination of living Nile crocodiles from the cortical stratification of bone. Copeia. 1986;1986:332–341. [Google Scholar]
- Irmis RB. Axial skeleton ontogeny in the Parasuchia (Archosauria: Pseudosuchia) and its implications for ontogenetic determination in archosaurs. J Vertebr Paleontol. 2007;27:350–361. [Google Scholar]
- Langer MC, Ferigolo J, Schultz CL. Heterochrony and tooth evolution in hyperodapedontine rhynchosaurs (Reptilia, Diapsida) Lethaia. 2000;33:119–128. [Google Scholar]
- Modesto SP, Sues H-D. The skull of the Early Triassic archosauromorph reptile Prolacerta broomi and its phylogenetic significance. Zool J Linn Soc. 2004;140:335–351. [Google Scholar]
- Nesbitt SJ. The early evolution of archosaurs: relationships and the origin of major clades. Bull Am Mus Nat Hist. 2011;352:1–292. [Google Scholar]
- Nesbitt SJ, Brusatte SL, Desojo JB. Rauisuchia. In: Nesbitt SJ, Desojo JB, Irmis RB, et al., editors. Anatomy, Phylogeny and Palaeobiology of Early Archosaurs and their Kin. London: Geol. Soc., Spec. Publ; 2013. pp. 241–274. In: 379. [Google Scholar]
- Pérez-Higareda G, Rangel-Rangel A, Smith HA. Maximum sizes of Morelet's and American crocodiles. Bull Md Herpetol Soc. 1991;27:34–37. [Google Scholar]
- Pitman ETG. A note on normal correlation. Biometrika. 1939;31:9–12. [Google Scholar]
- Platt SG, Rainwater TR, Thorbjarnarson JB, et al. Size estimation, morphometrics, sex ratio, sexual size dimorphism, and biomass of Morelet's crocodile in northern Belize. Carib J Sci. 2009;45:80–93. [Google Scholar]
- R Development Core Team. R: A Language and Environment for Statistical Computing. Vienna: R Foundation for Statistical Computing; 2013. . ISBN 3–900051–07–0, available at http://www.R-project.org/ [Google Scholar]
- Sereno PC, Novas FE. The skull and neck of the basal theropod Herrerasaurus ischigualastensis. J Vertebr Paleontol. 1993;13:451–476. [Google Scholar]
- Smith RJ. Use and misuse of the reduced major axis for line-fitting. Am J Phys Anthropol. 2009;140:476–486. doi: 10.1002/ajpa.21090. [DOI] [PubMed] [Google Scholar]
- Sookias RB, Butler RJ. Euparkeriidae. In: Nesbitt SJ, Desojo JB, Irmis RB, editors. Anatomy, Phylogeny and Palaeobiology of Early Archosaurs and their Kin. London: Geol. Soc., Spec. Publ; 2013. pp. 35–48. In: 379. [Google Scholar]
- Sookias RB, Butler RJ, Benson RBJ. Rise of dinosaurs reveals major body size transitions are driven by passive processes of trait evolution. Proc Trans R Soc Lond B Biol Sci. 2012;279:2180–2187. doi: 10.1098/rspb.2011.2441. [DOI] [PMC free article] [PubMed] [Google Scholar]
- Trotteyn MJ, Arcucci AB, Raugust T. Proterochampsia: an endemic archosauriform clade from South America. In: Nesbitt SJ, Desojo JB, Irmis RB, editors. Anatomy, Phylogeny and Palaeobiology of Early Archosaurs and their Kin. London: Geol. Soc., Spec. Publ; 2013. pp. 59–90. In: 379. [Google Scholar]
- Tucker AD. Validation of skeletochronology to determine age of freshwater crocodiles (Crocodylus johnstoni. Mar Freshw Res. 1997;48:343–351. [Google Scholar]
- Tykoski RS. 2005. Austin University of Texas at Austin Osteology, Ontogeny, and Relationships of the Coelophysoid Theropods. PhD Thesis.
- Warton DI, Wright IJ, Falster DS, et al. Bivariate linefitting methods for allometry. Biol Rev. 2006;81:259–291. doi: 10.1017/S1464793106007007. [DOI] [PubMed] [Google Scholar]
- Warton DI, Wright IJ, Falster DS, et al. SMATR 3 – an R package for estimation and inference about allometric lines. Methods Ecol Evol. 2012;2012:257–259. [Google Scholar]
- Webb GJW, Messel H. Morphometric analysis of Crocodylus porosus from the North Coast of Arnhem Land, Northern Australia. Aust J Zool. 1978;26:1–27. [Google Scholar]
- Welman J. The taxonomy of the South African proterosuchids (Reptilia, Archosauromorpha) J Vertebr Paleontol. 1998;18:340–347. [Google Scholar]
- Welman J, Flemming AF. Statistical analysis of the skulls of Triassic proterosuchids (Reptilia, Archosauromorpha) from South Africa. Palaeontol Afr. 1993;30:113–123. [Google Scholar]
- Woodward AR, Moore CT. 1992. Alligator Age Determination. Florida Game and Fresh Water Fish Commission Bureau of Wildlife Research, Final Report 7563.
Associated Data
This section collects any data citations, data availability statements, or supplementary materials included in this article.
Supplementary Materials
Data S1. Total skull length estimations.
Data S2. Character list for the data matrix of the ontogram.
Data S3. TNT file of the data matrix analyzed in this paper.
Data S4. Scorings for the hypothetical root.
Data S5. excel file that includes the raw measurements used for the quantitative analyses (sheet 1), results of the SMA regressions excluding measurements with a n ≤ 3 and non-significant regressions (sheet 2), and results of the SMA regressions using the minimum width of the parietals as independent variable (sheet 3).


