Article first published online 7 April 2015.
Supplemental Digital Content is Available in the Text.
Key Words: GPCR, pH-sensing receptors, OGR1, IBD, microarrays, animal model
Abstract
Background:
A novel family of proton-sensing G protein-coupled receptors, including OGR1, GPR4, and TDAG8, was identified to be important for physiological pH homeostasis and inflammation. Thus, we determined the function of proton-sensing OGR1 in the intestinal mucosa.
Mtehods:
OGR1 expression in colonic tissues was investigated in controls and patients with IBD. Expression of OGR1 upon cell activation was studied in the Mono Mac 6 (MM6) cell line and primary human and murine monocytes by real-time PCR. Ogr1 knockout mice were crossbred with Il-10 deficient mice and studied for more than 200 days. Microarray profiling was performed using Ogr1−/− and Ogr1+/+ (WT) residential peritoneal macrophages.
Results:
Patients with IBD expressed higher levels of OGR1 in the mucosa than non-IBD controls. Treatment of MM6 cells with TNF, led to significant upregulation of OGR1 expression, which could be reversed by the presence of NF-κB inhibitors. Kaplan–Meier survival analysis showed a significantly delayed onset and progression of rectal prolapse in female Ogr1−/−/Il-10−/− mice. These mice displayed significantly less rectal prolapses. Upregulation of gene expression, mediated by OGR1, in response to extracellular acidification in mouse macrophages was enriched for inflammation and immune response, actin cytoskeleton, and cell-adhesion gene pathways.
Conclusions:
OGR1 expression is induced in cells of human macrophage lineage and primary human monocytes by TNF. NF-κB inhibition reverses the induction of OGR1 expression by TNF. OGR1 deficiency protects from spontaneous inflammation in the Il-10 knockout model. Our data indicate a pathophysiological role for pH-sensing receptor OGR1 during the pathogenesis of mucosal inflammation.
The mechanisms involved in the maintenance of mucosal homeostasis are important in our understanding of the pathophysiology of inflammatory bowel disease (IBD). Both forms of the disease, Crohn's disease (CD) and ulcerative colitis (UC), give rise to inflammation that is associated with extracellular acidification of mucosal tissue. Mucosal inflammation is interpreted as a local response to tissue damage and microbial invasion.
A number of studies suggest that an acidic environment affects the progression and resolution of inflammation.1–3 Inflammation has been attributed to an increase in local proton concentration and lactate production4 and subsequent proinflammatory cytokine production, such as tumur necrosis factor (TNF), interleukin-6 (IL-6), interferon gamma (IFN-γ), and interleukin-1-beta (IL-1β). TNF is one of the characterizing cytokines in IBD,5,6 and anti-TNF targeted therapies are successful in both CD and UC.7–10 Activated macrophages, which are key cellular mediators of acute and chronic inflammation, are primary producers of TNF.11 TNF activates the nuclear transcription factor kappa B (NF-κB), one of the key regulators in chronic mucosal inflammation.12,13
G protein-coupled receptors (GPCRs), cell-surface molecules involved in signal transduction, are targeted by key inflammatory cytokines.14 The ovarian cancer G protein-coupled receptor 1 (OGR1) family of receptors, which include OGR1, G protein-coupled receptor 4 (GPR4), and T-cell death associated gene (TDAG8), sense extracellular protons through histidine residues located on the extracellular region of the receptors, resulting in the modification of a variety of cell functions.15,16 Early signaling pathways of pH-sensing receptors triggered by acidification include phospholipase C activation, inositol trisphosphate formation, and subsequent Ca2+ release15 or cyclic adenosine monophosphate production.17,18 The increase of intracellular calcium influx and accumulation of cyclic adenosine monophosphate has been shown to regulate a vast range of cellular responses. Moreover, OGR1 and TDAG8 are alleged to act in opposition in a regulatory manner, either enhancing or inhibiting the production of proinflammatory cytokines respectively.19
TDAG8-mediated extracellular acidification inhibited lipopolysaccharide (LPS)-induced production of TNF and IL-6 in mouse peritoneal inflammatory macrophages.2 Patients with CD demonstrate a defect in macrophage function resulting in an inadequate bacterial clearance from inflammatory sites.20 In addition, macrophages from patients with CD showed impaired TNF-α secretion in response to bacterial challenge.21 Furthermore, association results and in silico analysis have recently identified a locus within the TDAG8 gene as one of the susceptibility loci associated with CD.22 Onozawa et al23 suggest that TDAG8 is a negative regulator of inflammation, which is mediated through a Gs-coupled mechanism.2 In contrast, OGR1 is reported to act predominately through a Gq-coupled mechanism to stimulate proinflammatory cytokines production upon extracellular acidification.19
To date, few data on the role of OGR1 in inflammation in IBD have been published. OGR1 may play an important role in the regulation of the inflammatory pathways in IBD, and it may represent an interesting target for innovative therapies. Therefore, we investigated the role and function of OGR1 in gut inflammation with a focus on myeloid cells. We used an immune-mediated inflammatory disease mouse model, namely interleukin-10 (Il-10) knockout (KO) mice, which spontaneously develop chronic colitis24–26 and a human monocyte model. We show that OGR1 expression is induced in monocytes by TNF and OGR1 deficiency protects from spontaneous inflammation in the Il-10 KO model.
MATERIALS AND METHODS
Details of reagents used and methods for gene expression are provided in the Supplementary Materials and Methods section (see Supplemental Digital Content 1, http://links.lww.com/IBD/A799).
pH Experiments
pH shift experiments were carried out in serum-free RPMI medium (1-41F24-I, Amimed), supplemented with 2 mM Glutamax (35050-038, Gibco), and 20 mM HEPES. The pH of all solutions was adjusted using a calibrated pH meter (Metrohm, Herisau, Switzerland) with NaOH or HCl, and the medium was equilibrated in a 5% CO2 incubator for 36 hours. All data presented are referenced to pH measured at room temperature.
Culture of Cell Lines
The monocytic cell line MonoMac 6 (MM6, obtained from DMSZ) was cultured in RPMI (Sigma-Aldrich, Munich, Germany) supplemented with 10% fetal calf serum, 1% nonessential amino acids, and 1% oxalacetic acid–pyruvate–insulin medium supplement (Sigma-Aldrich), and maintained according to the American Type Culture Collection.
Patient Tissue Samples
Primary intact colonic epithelial cell crypts were isolated from normal human colonic tissue of patients undergoing bowel surgery as previously described.27 Biopsies of human terminal ileum, colon, or rectum were taken from patients with CD or UC, or from control subjects undergoing colonoscopy for colon cancer screening. Biopsies from patients with colitis were taken endoscopically from inflamed areas. Written consent was obtained before specimen collection, and studies were approved by the local ethics committee.
Isolation of Human Peripheral Blood Monocytes
Normal human peripheral blood monocytes, obtained from the Swiss Red Cross Blood Service, were isolated from buffy coat samples, by density gradient centrifugation using Lymphoprep (Axis-Shield, Oslo, Norway). Purification was performed using EasySep Human Monocyte Enrichment Kit without CD16 Depletion and EasySep magnet (both from Stemcell, Vancouver, Canada) according to manufacturer's instructions. The purity of the monocytes was >85% as assessed by fluoroscein isothiocyanate–labeled anti-CD14 (557742, BD Biosciences, Allschwil, Switzerland) by flow cytometry (data not shown).
Animal Models
All animal experiments were performed according to Swiss animal welfare laws and were approved by the Veterinary Authority of Basel-Stadt and the Veterinary Office of the Canton Zürich, Switzerland. Ogr1−/− (C57BL/6) mice, initially obtained from Deltagen, Inc., San Mateo, CA, were generated as described.28 Il-10 −/− mice (C57BL/6) mice and Ogr1−/− mice were crossed to generate Ogr1 −/−/Il-10 −/− colitis susceptible mice. Mice were observed until reaching either 200 days of age or suffering a prolapse. All mice were housed together in 1 room in a vivarium.
Genomic DNA Extraction and Genotyping
Genotyping was confirmed by PCR of tail genomic DNA. DNA extraction was performed according to standard NaOH methods. The PCR reactions used for Ogr1 genotyping were performed as previously described,28 oligonucleotides used are listed in the supplementary Material and Methods (see Supplemental Digital Content 1, http://links.lww.com/IBD/A799).
Murine Macrophage Isolation and Culture
Mature quiescent macrophages were isolated from the mouse peritoneal cavity without the aid of eliciting agents, as described by Zhang et al.29 Animals were killed by cervical dislocation to reduce influence on pH. Additional details are described in the supplementary Methods (see Supplemental Digital Content 1, http://links.lww.com/IBD/A799).
Evaluation of Inflammation in Murine Colitis
Typical inflammatory parameters were evaluated as previously described.30,31
Expression Profiling by Microarrays
Global whole-transcript analysis was performed using a GeneAtlas microarray system (Affymetrix) to compare response differences between Ogr1+/+ and Ogr1−/− murine macrophages after 24 hours acidic pH shift. Mature murine quiescent peritoneal macrophages were isolated as described above, from age-matched female Ogr1−/− and Ogr1+/+ mice (C57BL/6). Five replicates or mice per condition were used, and approximately 1 × 10⁶ macrophages per mouse obtained. Cells were not pooled. Cells were treated with pH 6.7 equilibrated medium to activate Ogr1, and pH 7.7 to serve as negative controls. Cells were collected, and RNA and cDNA samples were prepared. Biotin-labeled cDNA samples were hybridized to GeneChip Mouse Gene 1.1ST Array Strip (Affymetrix, P/N 901628) after protocols provided by Affymetrix. Data were summarized on gene-level using RMA (Robust Multiarray Average). Data quality was assessed using the bioconductor/R package “arrayQualityMetrics,”32 and reproducibility was assessed using Pearson's correlation for all the filtered expression values and hierarchical clustering. For all pairwise comparisons, differentially expressed genes were selected using ≥2.0-fold change, P < 0.05 significance, as determined using analysis of variance (as implemented by the R package, Linear Models for Microarray Data, “limma”) and F-test for the complete experimental design. The results were analyzed by global ranked fold change and using Metacore software for pathway enrichment.
Statistical Analysis
For murine prolapse ratio comparison studies, statistical differences between genotypes were calculated by chi-square test with Fisher's exact test (exact significance, two-sided) and risk estimate test from contingency tables. The prolapse survival analysis was performed using Kaplan–Meier survival analysis (log rank Mantel–Cox test) and estimated median survival time. Groups of data were compared using nonparametric Mann–Whitney U test (mouse data) or Kruskal–Wallis one-way analysis of variance followed by Dunn's multiple comparison test (patient data). Data are presented as mean ± SEM for a series of n experiments. Probabilities (P, two-tailed) of P < 0.05 were considered statistically significant. Monocyte/macrophage expression data were analyzed using a one-way analysis of variance followed by the Tukey's post hoc test. Throughout this article, asterisks denote significant differences at *P < 0.05, **P < 0.01, ***P < 0.001.
RESULTS
OGR1 mRNA Expression Is Increased in Patients with IBD
OGR1 mRNA expression in isolated crypts and terminal ileum, colon, or rectum specimens from patients with IBD and control subjects was confirmed by RT-qPCR. Ct values from the isolated crypts from 4 patients ranged from 27 to 30, indicating moderate expression of OGR1 in colonic epithelium (data not shown). Compared with normal control subjects, OGR1 expression increased 2.3-fold (P < 0.05) in patients with UC (n = 8) and 2.2-fold (P < 0.01) in patients with CD (n = 29) (Fig. 1).
FIGURE 1.
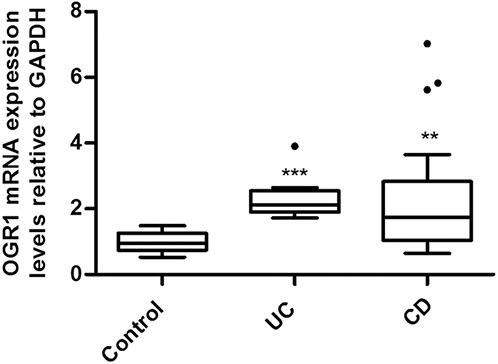
OGR1 expression in human intestinal mucosa; patients with IBD expressed higher levels of OGR1 mRNA in the mucosa as compared with controls. Expression levels normalized to GAPDH. Biopsy specimens were taken from 29 patients with CD, 8 patients with UC, and 17 non-IBD control patients. Asterisks denote significant differences from the respective control (**P < 0.01, ***P < 0.001).
OGR1 Expression Is Regulated by TNF in Myeloid Cells
A local decrease in pH usually occurs at inflammatory sites, and monocytes are rapidly recruited, followed by an increase in proinflammatory cytokines. MM6 cells were treated with IFN-γ, IL-1β, IL-6, TNF, or TGF-β, which are known to initiate immune and inflammatory responses in the mucosa. Stimulation by TNF resulted in significant upregulation of OGR1 expression (≈4- to 5-fold; P < 0.001, Fig. 2A–B). No induction of OGR1 occurred by IFN-γ, IL-1β, IL-6, or TGF-β at 6 hours (Fig. 2A–B) or at 1 hour, 5 hours, or 24 hours (data not shown). A concentration-dependent (0, 2.5, 10, 25, 50, and 100 ng/mL) induction of OGR1 mRNA expression in MM6 cells by TNF was confirmed at 4 and 8 hours (Fig. 2C). Maximal OGR1 induction, after 8 hours of treatment was reached at TNF concentration 50 ng/mL (Fig. 2C). Induction of OGR1 expression in MM6 cells by TNF returned to basal levels after 48 hours (Fig. 2D).
FIGURE 2.
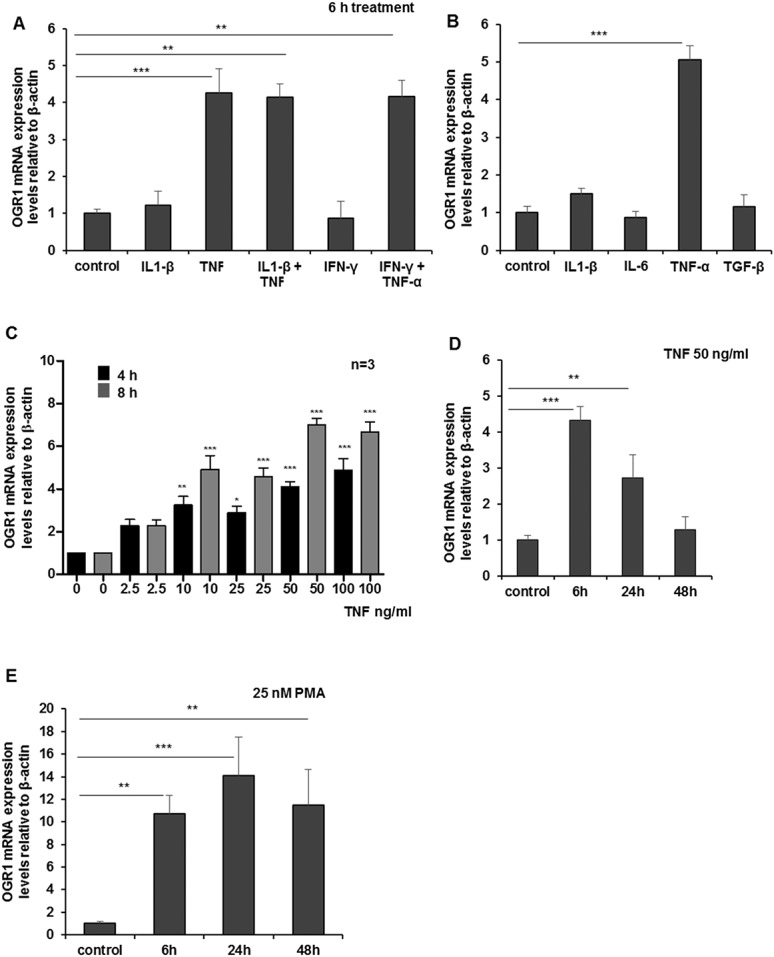
TNF and PMA induce OGR1 expression in human monocytes; (A and B) MM6 cells were treated with cytokines for 6 hours. Treatment of MM6 cells with TNF led to significant upregulation of OGR1. No induction of OGR1 occurred with other cytokines (IFN-γ, IL-1β, IL-6, and TGF-β) (50 ng/mL) tested. C, Concentration-dependent TNF (0, 2.5, 10, 25, 50, 100 ng/mL) induction of OGR1 mRNA expression was confirmed at 4 and 8 hours. Maximal OGR1 induction was reached at TNF concentration 50 ng/mL at 8 hours. D, Induction of OGR1 expression by TNF (50 ng/mL) returned to basal levels after 48 hours. E, Monocytic macrophagic differentiation of MM6 cells with PMA (25 nM), a specific activator of protein kinase C (PKC) and NF-κB, led to a significant increase in OGR1 mRNA expression. Asterisks denote significant differences from the respective control (*P < 0.05, **P < 0.01, ***P < 0.001). Representative data of one of 3 qualitatively similar experiments shown unless indicated.
Treatment of MM6 cells with PMA, a known PKC activator but also commonly used to differentiate monocytes into macrophage-like cells,33 led to increased OGR1 expression (14-fold at 24 h, P < 0.001) (Fig. 2E).
To confirm the relevance of our findings in MM6 cells, we tested OGR1-induction by TNF and PMA in primary human monocytes and mouse peritoneal macrophages. Concentration-dependent TNF and PMA induction of OGR1 mRNA was confirmed in human monocytes (Fig. 3A–B). Similarly TNF-mediated OGR1 induction was observed in mouse macrophages (Fig. 4). The intensity of the response to TNF was comparable in MM6 cells and primary mouse macrophages (Fig. 2C–D [MM6]; Fig. 4). The induction time of primary human monocytes was considerably slower but of similar intensity. Similarly, primary human monocytes exhibited a slower induction and lower response to PMA compared with MM6 cells. No induction of the other pH-sensing GPCRs, GPR4 and TDAG8, by any of the cytokines tested or by PMA was detected (data not shown).
FIGURE 3.
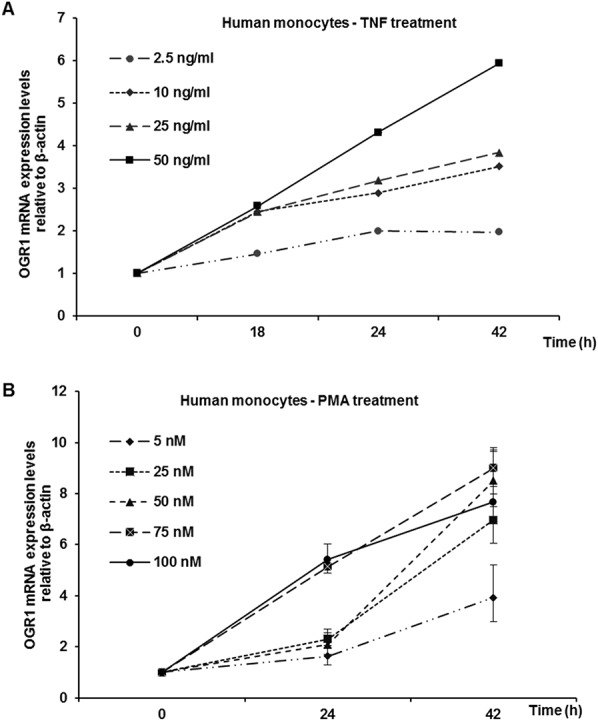
TNF- and PMA-dependent induction of OGR1 mRNA in primary human monocytes. A, Dose-dependence of TNF (0, 2.5, 10, 25, and 50 ng/mL) induction of OGR1 mRNA was confirmed in primary human monocytes. B, PMA (0, 5, 25, 50, 75, and 100 ng/mL) induction of OGR1 mRNA was confirmed in primary human monocytes. Representative data of one of 2 similar experiments shown.
FIGURE 4.
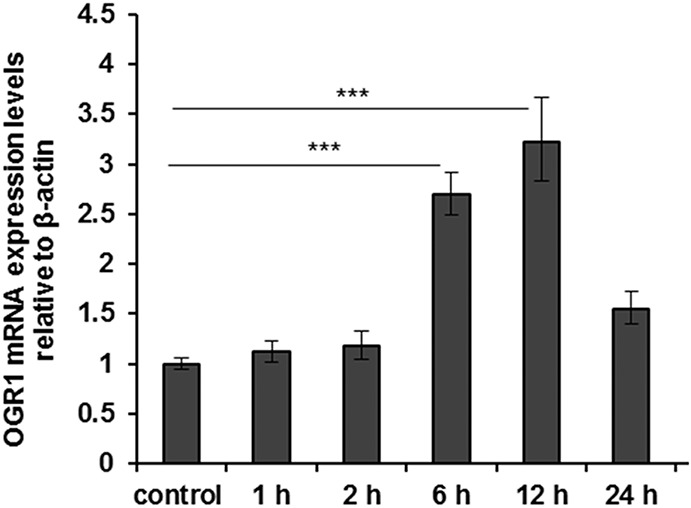
TNF induces OGR1 expression in murine macrophages. OGR1 induction by TNF (25 ng/mL) was also confirmed in primary mouse residential peritoneal macrophages. Asterisks denote significant differences from the respective control (***P < 0.001). Representative data of one of 3 similar experiments shown.
TNF-, LPS-, or PMA-induced OGR1 Expression Is Reversed by Akt, MAP, and PKC Kinase and NF-κB Inhibitors
To understand the pathways involved in TNF-, PMA-, or LPS-mediated induction of OGR1 expression, we investigated the roles of Akt1/2 kinase, c-Jun N-terminal kinase (JNK), and PKC by using their specific inhibitors. Mitogen-activated protein kinases (MAPKs) play an important role in regulating the cellular response to various extracellular stimuli.34 Signaling through PKC is known to activate MAPKs.35 Activation occurs by sequential phosphorylation by JNK, extracellular signal-regulated kinase (ERK) 1/2, p38 MAPK, ERK5, and ERK3/4.36 Activated MAPK kinase pathways may stimulate activator protein 1 (AP-1).37,38 Exposure of monocytes and macrophages to TNF, LPS, and PMA results in activation of the AP-1, NF-κB, caspase, and MAPK pathways.39,40 Akt is a serine–threonine kinase and has been implicated in TNF-mediated activation of NF-κB.41,42
Based on our time course experiments (Fig. 2D), cells were stimulated with PMA, TNF, or LPS, in the presence of the appropriate kinase inhibitor, A6730 (9 μM), SP600125 (20 μM), and curcumin (25 μM), and harvested after 6 hours.
Exposure of MM6 cells to PMA, TNF, and LPS induced OGR1 expression as 13.7-, 8.2-, and 10.3-fold, respectively. The Akt1/2 kinase inhibitor, A6730, significantly decreased TNF- and LPS-induced OGR1 expression, by 5.6 (68%) and 8.2-fold (80%) respectively, but with less effect on PMA activation (4.8-fold decrease, 35% decrease) (n = 2, P < 0.001 or 0.01, Fig. 5A). SP600125, a JNK inhibitor, decreased OGR1 induction by PMA 10.1-fold, (73%) TNF 4.0-fold (48%), and LPS 7.5-fold (80%). These results suggest that the JNK/AP1 pathway may be involved in OGR1 regulation. Curcumin is a potent inhibitor of protein kinase C43 and inhibits NF-κB activation through inhibition of IκB kinase and Akt activation.44 Curcumin abolished the induction of all 3 activating agents (PMA, 12.7-fold [93%]; TNF, 7.2-fold [87%]; and LPS, 9.9-fold [96%] decrease). These preliminary kinase inhibitor studies suggest that Akt1/2, JNK, PKC, and IKK pathways play an important role in the induction of OGR1 expression by PMA, TNF, and LPS.
FIGURE 5.
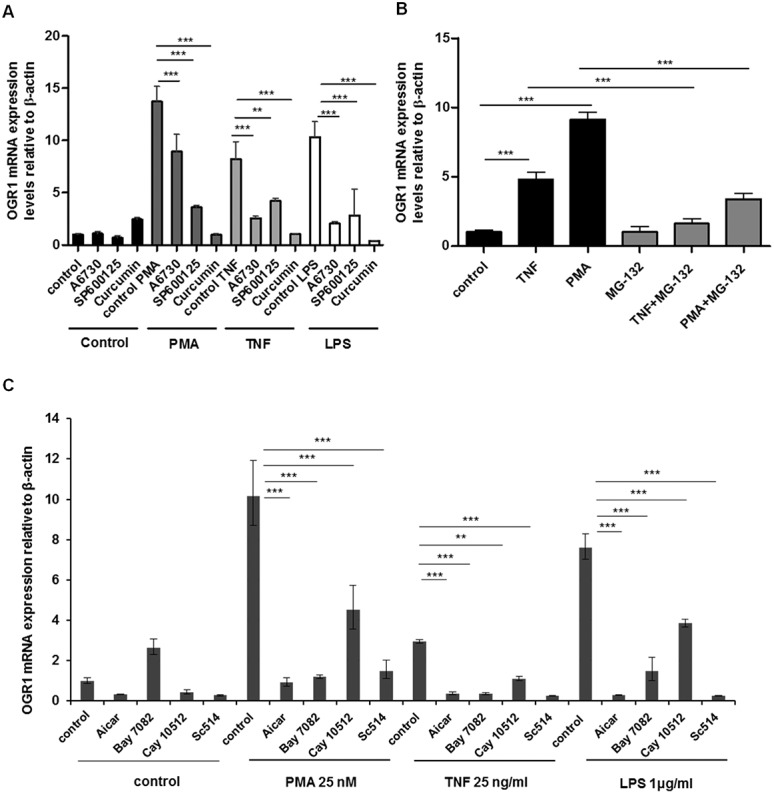
TNF-, PMA-, and LPS-mediated induction of OGR1 in MM6 cells was reversed by simultaneous treatment of cells with kinase and NF-kB inhibitors. A, Kinase inhibitors, A6730 (9 μM), SP600125 (20 μM), and curcumin (25 μM), reduced or abolished TNF- (25 ng/mL), PMA- (25 nM), or LPS-mediated (1 μg/mL) induction of OGR1 in MM6 cells. B, Treatment with NF-kB inhibitor MG-132 (20 μM) significantly reduced TNF-mediated (50 ng/mL) or PMA-mediated (25 nM) induction of OGR1 in MM6 cells. C, AICAR (0.5 nM), BAY-11-7082 (20 μM), CAY10512 (0.3 μM), and SC-514 (25 μM) also reduced TNF- (25 ng/mL), PMA- (25 nM), or LPS (1 μg/mL) mediated induction of OGR1. Asterisks denote significant differences from the respective control (**P < 0.01, ***P < 0.001). Representative data of one of 2 similar experiments shown.
Prompted by the results, we next tested a number of known NF-κB inhibitors. TNF-, PMA-, or LPS-mediated induction of OGR1 was significantly reduced by simultaneous treatment of cells with NF-κB inhibitors: curcumin (25 μM), MG-132 (20 μM), AICAR (0.5 nM), BAY-11-7082 (20 μM), CAY10512 (0.3 μM), and SC-514 (25 μM) (Fig. 5A–C). In the presence of the inhibitor MG132, TNF induced OGR1 expression decreased 3.2- and 5.7-fold, respectively (TNF, 95% decrease and PMA, 89% decrease) (n = 2, P < 0.001, Fig. 5B).
AICAR (5-aminoimidazole-4-carboxyamide) ribonucleoside blocks the expression of proinflammatory cytokines genes by a reduction in NF-κB DNA-binding activity.45 BAY-11-7082 and SC-514 block NF-kB activation by inhibition of IκB kinase.46,47 The resveratrol analog CAY10512 is a specific NF-κB inhibitor. Treatment with PMA, TNF, or LPS resulted in 10.2-, 3.0-, or 7.6-fold increase in OGR1 expression, respectively, but in the presence of the NF-κB inhibitors induction of OGR1 significantly decreased. OGR1 expression decreased with inhibitor; AICAR 9.3-, 2.6-, and 7.3 -fold (91%, 88%, and 96%, respectively); BAY7082, 9.0-, 2.6-, and 6.1-fold (88%, 87%, and 81%, respectively); Cay10512, 5.6-, 1.8-, and 3.8-fold (56%, 62%, and 49%, respectively),; SC-514, 8.7-, 2.7-, and 7.4-fold (85%, 91%, and 97%, respectively) on PMA, TNF, and LPS stimulation, respectively (Fig. 5C). The results collectively suggest that NF-κB plays a key role in the regulation of OGR1.
In Silico Analysis of the OGR1 Promoter
As the inhibitor studies suggested a strong role for AP-148 and NF-κB in the regulation of OGR1 expression, we next performed an in silico promoter analysis of OGR1. Two alternative predicted promoter variants ≈9 kpb apart, exist for the OGR1 gene on chromosome 14. In silico analysis using MatInspector software49 (http://www.genomatix.de/matinspector.html) revealed several putative DNA-binding sites for AP-1, NF-κB, and HIF-1α within the proximal regions of the OGR1 promoter variants. A schematic representation of these sites (TBSs) for OGR1 variants 1 and 2 and binding sites are shown in Figures, Supplemental Digital Content 2 and 3, http://links.lww.com/IBD/A800 and http://links.lww.com/IBD/A801, respectively.
Cellular Responses Upon OGR1 Activation by Extracellular Acidification in Murine Macrophages
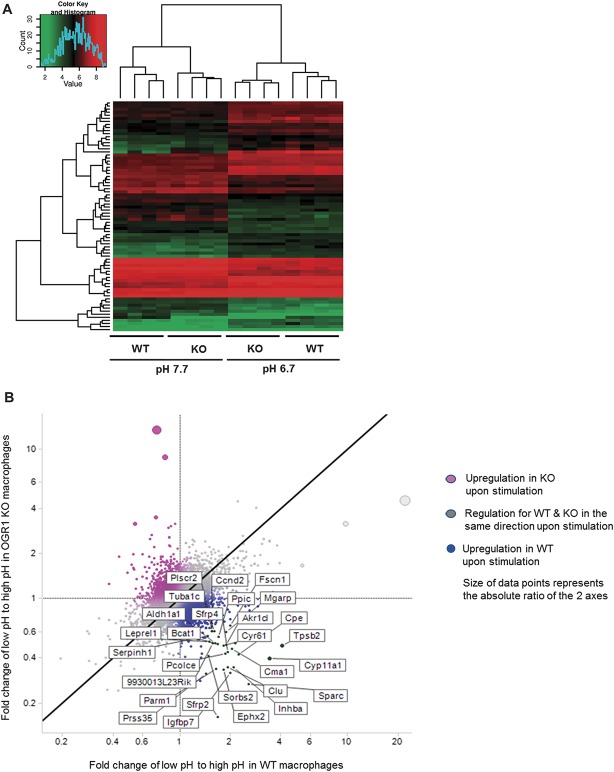
We further investigated the effect of OGR1 deficiency on intestinal inflammation. We conducted a microarray study and compared the global gene expression of wild-type (WT) Ogr1+/+ cells to Ogr1−/− cells in response to extracellular acidification. We selected the top 100 most differentially expressed genes by comparing the ranked fold change upon pH shift in WT compared with KO macrophages. Figure 6A shows a heat map summarizing gene expression across all samples in the 4 experimental conditions for these 100 genes.
FIGURE 6.
Global gene expression of acid response of mouse macrophages. A, Top 100 genes from the whole-transcript microarray analysis of acid response (pH 6.7) of WT and Ogr1 KO murine macrophages. Control condition, pH 7.7 is shown on the left. Changes in gene expression within each comparison are represented as log2-transformed fold changes (≥2.0-absolute fold-change, P < 0.05 significance). B, Differentially expressed genes for acid response in WT and OGR1 KO macrophages. Fold changes in low to high pH shift of OGR1 KO macrophages are depicted on y-axis and fold changes low to high pH WT macrophages are shown on the x-axis. The highest ranking differentially expressed genes in the acid response of WT mouse macrophages are shown in the lower right quadrant of the scatter plot, and the upper left quadrant shows the highest ranking differentially expressed genes in the acid response of OGR1 KO mouse macrophages.
Acid-induced OGR1-mediated differentially upregulated genes in WT macrophages compared with OGR1 KO macrophages include inflammatory response genes (Tnfrsf13c, Ccl24, Cxcl13, C1qa, Nr4a1) and immune response genes (Iglv1, Cd79a, H2-Eb1, Tinagl1, Lst1, C1qa, C1qb Cd83, Ccl17). Furthermore, genes associated with adhesion and ECM (Sparc, Cyr61, Timp1, Aebp1, Ebp1, Siglec1, Cdh2, Mmp11, Serpine2, Tgm2), and actin cytoskeleton (Inhba, Fscn1, Sorbs2, Tuba1c, Map1b, Parva, Cnn3) were upregulated by acidic activation of OGR1 in WT but not in OGR1 KO macrophages. Interestingly, cholesterol homeostasis genes, (Cyp11a1, Ephx2), glucose response and insulin processing genes, (Inhba, Cpe, Cma1, Igfbp7, Htra1, Sfrp4), differentiation and bone development gene Bmp-2 and transcription factor gene Nrbf2 also increased in WT Ogr1+/+ compared with Ogr1−/− KO cells at acidic pH.
The scatter plot represents the ratio fold change low to high pH OGR1 KO/fold change low to high pH WT macrophages (Fig. 6B). The top 100 differentially expressed genes are shown in Table, Supplemental Digital Content 4, http://links.lww.com/IBD/A802. In addition, a list of genes and enrichment pathways, generated in GeneGo by comparison of pairs of WT low pH versus high pH to OGR1 KO low pH versus high pH, is shown in Table, Supplemental Digital Content 5, http://links.lww.com/IBD/A803 and Figure, Supplemental Digital Content 6, http://links.lww.com/IBD/A804, respectively. Results discussed in this article have been deposited in the NCBI Gene Expression Omnibus Accession number GSE60295 (http://www.ncbi.nlm.nih.gov/projects/geo).
OGR1 Deficiency Protects from Development of Spontaneous Colitis in Mice
To investigate whether the OGR1-dependent changes upon acidification have functional consequences during IBD, we applied a mouse model of spontaneous colitis. Analysis of the occurrence of prolapse in the colon over the course of 200 days showed that only 16.7% of female Ogr1−/−/Il-10−/− mice (n = 24) developed rectal prolapse. The incidence was significantly lower than that of female Ogr1+/+/Il-10−/− littermate mice (66.7%, n = 12) maintained in the same vivarium room during the same time period (**P = 0.007; odds ratio for female mice Ogr1−/−/Ogr1+/+ = 0.100 [95% confidence limit, 0.020–0.500], chi-square test with Fisher's exact test with 2 sides). Kaplan–Meier survival analysis showed a significantly delayed onset and progression of rectal prolapse in female Ogr1−/−/Il-10−/− mice (estimated median survival time: >200 days versus 123 days for female Ogr1+/+/Il-10−/− mice, **P = 0.002, log rank [Mantel–Cox] test) (Fig. 7). No prolapses were observed in control Ogr1+/+/Il-10+/+ mice (n > 100 animals).
FIGURE 7.
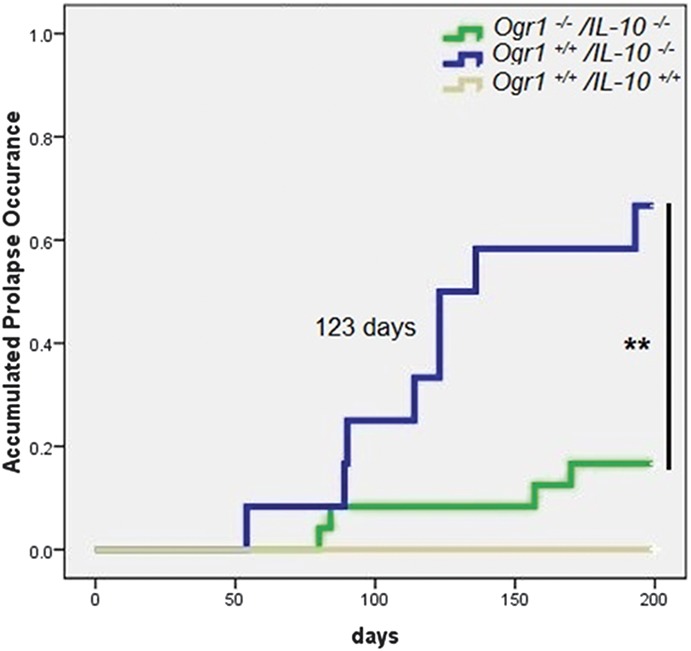
OGR1-deficient mice show delayed onset and severity of prolapse in a spontaneous IL-10 KO mouse model. Kaplan–Meier survival analysis showed a significantly delayed onset and progression of rectal prolapse in female Ogr1−/−/Il-10−/− mice (estimated median survival time: >200 days versus 123 days, **P = 0.002, log rank [Mantel–Cox] test). Green solid lines, Ogr1−/−/Il-10−/− mice (16.7% prolapses, n = 24); blue solid line, Ogr1+/+/Il-10−/− mice (66.7% prolapses, n = 12); gray solid lines, Ogr1+/+/Il-10+/+ mice (0% prolapses, n = 31). No rectal prolapses were detected in any of the Ogr1+/+/Il-10+/+ mice in the breeding colony in the study, 200 days.
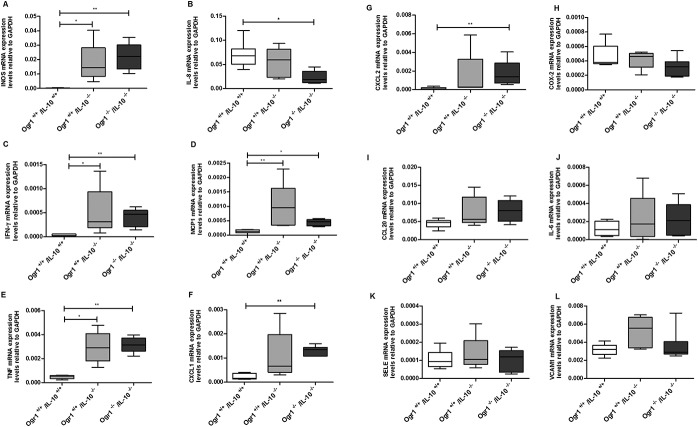
Histologically, consistent with the prolapse ratios, Ogr1−/−/Il-10−/− mice showed less inflammation (score 3.7 ± 1.03) (Fig. 8A); however, this difference did not reach statistical significance from Ogr1+/+/ll-10−/− female mice (6.5 ± 1.12) (P > 0.05, Fig. 8B). The same trend in MPO levels of female Ogr1−/−/Il10−/− mice was observed (0.12 ± 0.034 versus 0.41 ± 0.072, P > 0.05, Fig. 9A). There were no differences in colon length, relative spleen weight (Fig. 9B–C), and in cytokines mRNA expression levels (Fig. 10).
FIGURE 8.
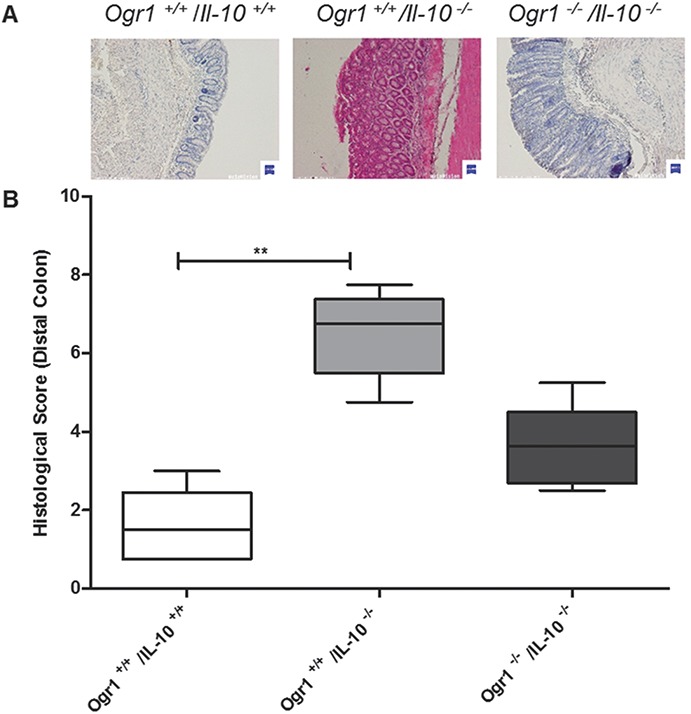
OGR1-deficient mice exhibit a trend to less inflammation in a spontaneous IL-10 KO mouse model. A, Microscopic analysis of terminal colon sections from Ogr1−/−/Il-10−/−, Ogr1+/+/Il-10−/−, and Ogr1+/+/Il-10+/+ 80-day-old mice, staining by Hematoxylin and eosin. Representative images are shown. B, Histological score, based on evaluation of morphological changes of epithelium and immune cell infiltration, of distal colon from Ogr1−/−/Il-10−/−, Ogr1+/+/Il-10−/− and Ogr1+/+/Il-10+/+ 80-day-old mice. Data presented as mean ± SEM; n ≥5 per group; Asterisks denote significant differences from the respective control (**P < 0.01). All mice were female.
FIGURE 9.
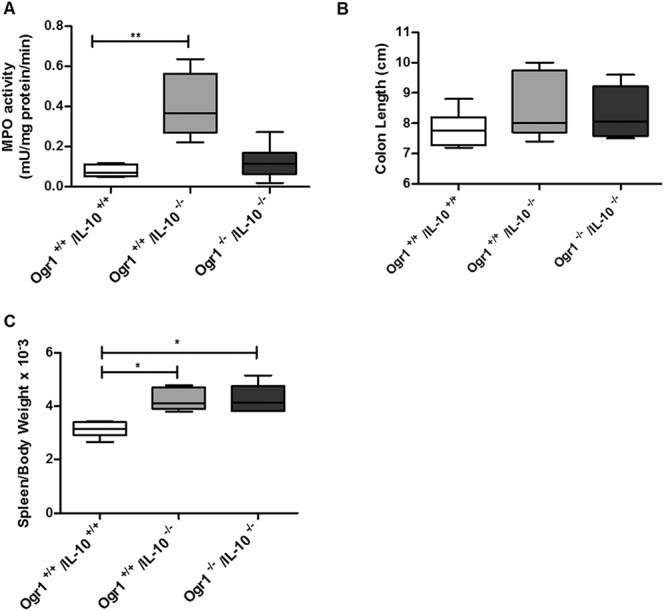
The development of IBD and progression of prolapse between Ogr1−/−/IL-10−/−and Ogr1+/+/Il-10−/− female mice. A, Comparison of MPO activity in colon tissue (B). Assessment of colon length. C, Relative spleen weight. Asterisks denote significant differences from the respective control (*P < 0.05, **P < 0.01).
FIGURE 10.
Expression levels of cytokines in colons of female Ogr1−/−/Il-10−/−, Ogr1+/+/Il-10−/−, and Ogr1+/+/Il-10+/+ (WT control) mice were determined by real-time PCR and normalized to GAPDH. (n = 6–9 mice per group). The homogenate of each mouse colon sample was tested in triplicate. Data presented as mean ± SEM; Asterisks denote significant differences from the respective control (*P < 0.05, **P < 0.01). No statistical difference between colon and mesenteric lymph nodes of female Ogr1−/−/Il-10−/− mice and female Ogr1+/+/Il-10−/− mice was observed (P > 0.05, Kruskal–Wallis one-way analysis of variance followed by Dunn's multiple comparison test).
DISCUSSION
Our article provides evidence for a role of the pH-sensing receptor OGR1, in inflammatory processes such as intestinal inflammation. We show that OGR1 mRNA expression is upregulated ≈2-fold during intestinal inflammation in patients with IBD. To what extent this translates into upregulated protein expression cannot currently be assessed because of a lack of suitable antibodies. We further show that the proinflammatory cytokine TNF, a major mediator in IBD-associated inflammation, induces OGR1 expression in human and murine myeloid cells. TNF upregulates OGR1 expression for short periods (6–12 h); however, the effect is not sustained for longer periods, after 24 to 48 hours OGR1 expression returns to basal levels.
Similar to our findings, Lum et al50 reported that expression of GPR4, a related proton-sensing GPCR, is upregulated several-fold by TNF and H2O2 in human brain microvascular endothelial cells. TNF-mediated induction of GPR4 occurred after 2 hours and was sustained for 24 hours However, in contrast to OGR1, we did not observe induction of GPR4 and TDAG8 expression upon treatment with TNF, PMA, or LPS in MM6 cells. OGR1 expression induced by TNF, PMA, or LPS was prevented by treatment with PI-3 (Akt1/2), MAP, and PKC inhibitors and with NF-κB inhibitors AICAR, BAY-11-7082, CAY10512, and SC-514. LPS stimulates production of TNF in MM6 cells.51,52
We further show that genetic deletion of OGR1 ameliorates inflammation at least in female mice. Acidification and signaling through OGR1 induced a multitude of cellular responses in the microarray analysis. In murine macrophages, acid-induced OGR1-mediated enriched upregulated genes are involved in inflammatory responses, further supporting our finding that OGR1 signaling upon pH changes may play an important role in mucosal inflammation. Notably, upregulation of nuclear receptor subfamily 4 group A member 1 (NR4A1, also known as NUR77) was detected (see Table, Supplemental Digital Content 5, http://links.lww.com/IBD/A803). NR4A1 functions as an immediate early-response gene and plays a key role in mediating inflammatory responses in macrophages.53 Additionally affected pathways are actin cytoskeleton modulation and cell adhesion. This may also be relevant as antiadhesion strategies for the treatment of IBD have been recently successful and vedolizumab as an antibody against α4β7 integrin recently has been approved for therapy of Crohn's disease by the FDA and EMA. In an OGR1-overexpressing Caco2 model, we also observed enrichment of inflammatory response, including NR4A1, actin cytoskeleton, and adhesion and ECM genes upon acidification (de Vallière, Solange Vidal, Ieuan Clay, et al, unpublished data, 2015). In this study, the genes Inhba and Nr4a1, which are linked to the myocardin-related transcription factor pathway,54 were also found to be strongly regulated by pH change.
Another strongly regulated gene was activin. Activin A is released early in the cascade of circulatory cytokines during systemic inflammatory episodes, roughly coincident with TNF and before IL-6 and follistatin are elicited. Activin A protein is also elevated in patients with IBD and in experimental colitis.55 Recently, activin A was identified to regulate macrophage switch between polarization states.56 This skew towards a proinflammatory phenotype occurs by promoting the expression of M1 (GM-CSF) markers, and impairing the acquisition of M2 (M-CSF) markers, while downregulating the production of Il-10.56 Furthermore, SPARC (secreted protein acidic and rich in cysteine) was found to be strongly regulated by OGR1. SPARC is a gene whose methylation has been related to IBD.57,58 SPARC exacerbates colonic inflammatory symptoms in DSS-induced murine colitis. Compared with WT, SPARC KO mice had less inflammation with fewer inflammatory cells and more regulatory T cells.59
Why would pH-sensing be so important during intestinal inflammation? First, pH homeostasis is important for the maintenance of normal cell function. pH is normally tightly controlled within a narrow range. Normal pH of blood and tissue is controlled at ≈pH 7.2 to 7.4. Maintaining homeostasis requires cells to sense their external environment, communicate with each other, and respond rapidly to extracellular signals. This can be achieved by hydrophobic molecules, ion channels, catalytic receptor, and G protein-coupled receptors.60
Under physiological conditions, there are also counterplayers of OGR1 expressed in the mucosal tissue. TDAG8 mediates extracellular proton-induced inhibition of proinflammatory cytokine production in mouse macrophages.2 Onozawa et al23 showed that TDAG8-deficient mice exhibit enhanced arthritic symptoms compared with WT animals; suggesting that TDAG8 attenuates inflammation by negatively regulating the function of the macrophages, T cells, and B cells. In search for genetic components and causal genetic variants of IBD, genome-wide association studies have identified numerous susceptibility regions that are marked by single nucleotide polymorphisms.22,61,62 Association results and in silico analysis identified a locus within the TDAG8 gene as susceptibility locus in CD,22 supporting that TDAG8 acts as a negative regulator of inflammation. Khor et al63 propose that the presence of TDAG8 as IBD-risk loci is necessary to maintain intestinal homeostasis due to its immune modulatory effect.
To summarize, ORG1 expression is induced in human and murine myeloid cells by TNF, PMA, and LPS, whereby simultaneous treatment with NF-κB inhibitors caused a reversal of this effect. Upregulated genes induced by extracellular low pH by proton-sensing OGR1 in murine macrophages were enriched for inflammatory and immune response, actin cytoskeleton, and cell-adhesion gene sets. The deficiency of pH-sensing receptor OGR1 protects from spontaneous inflammation in the Il-10 KO model. Thus, pH sensors may be interesting new targets for pharmacological intervention in intestinal inflammation.
ACKNOWLEDGMENTS
Author contributions: C. de Vallière performed experiments, analyzed the data and wrote the first draft of the manuscript; Y. Wang, S. Vidal, I. Clay, M. R. Spalinger, I. Tcymbarevich, A. Terhalle, M.-G. Ludwig, T. Suply, performed experiments and were involved in data analysis, M. Fried, G. A. Kullak-Ublick, I. Frew-Wagner, M. Scharl, J. J. Eloranta, K. Seuwen, C. A. Wagner, G. Rogler conceived, designed and supervised the study and respective experiments. All authors wrote, corrected and approved the manuscript.
The authors thank Jelena Kühn Georgijevic, Lennart Opitz, Michal Okoniewski, and Hubert Rehrauer from the Functional Genomics Center Zürich, for the microarray service/analysis and Andreas Sailer and Miroslava Vanek for providing human monocytes. Agnes Feige, Alexandra Cee, Christian Hiller, and Silvia Lang are acknowledged for their expert technical assistance. The help from the ZIRP Rodent Phenotyping Facility is gratefully acknowledged.
Footnotes
Supplemental digital content is available for this article. Direct URL citations appear in the printed text and are provided in the HTML and PDF versions of this article on the journal's Web site (www.ibdjournal.org).
Supported by a collaborative grant from the Zürich Center for Integrative Human Physiology (ZIHP) to C. A. Wagner and G. Rogler, research grants from the Swiss National Science Foundation to G. Rogler (Grant No: 314730-153380) and the Swiss IBD Cohort (Grant No: 3347CO-108792).
The authors have no conflicts of interest to disclose.
C. de Vallière and Y. Wang contributed equally to this work.
REFERENCES
- 1.Hanly EJ, Aurora AA, Shih SP, et al. Peritoneal acidosis mediates immunoprotection in laparoscopic surgery. Surgery. 2007;142:357–364. [DOI] [PubMed] [Google Scholar]
- 2.Mogi C, Tobo M, Tomura H, et al. Involvement of proton-sensing TDAG8 in extracellular acidification-induced inhibition of proinflammatory cytokine production in peritoneal macrophages. J Immunol. 2009;182:3243–3251. [DOI] [PubMed] [Google Scholar]
- 3.Brokelman WJ, Lensvelt M, Borel Rinkes IH, et al. Peritoneal changes due to laparoscopic surgery. Surg Endosc. 2011;25:1–9. [DOI] [PMC free article] [PubMed] [Google Scholar]
- 4.Lardner A. The effects of extracellular pH on immune function. J Leukoc Biol. 2001;69:522–530. [PubMed] [Google Scholar]
- 5.van Heel DA, Udalova IA, De Silva AP, et al. Inflammatory bowel disease is associated with functional TNF polymorphism affecting OCT1/NF-kappa B interaction. Gut. 2002;50:A30. [DOI] [PubMed] [Google Scholar]
- 6.Sandborn WJ, Targan SR. Biologic therapy of inflammatory bowel disease. Gastroenterology. 2002;122:1592–1608. [DOI] [PubMed] [Google Scholar]
- 7.Blam ME, Stein RB, Lichtenstein GR. Integrating anti-tumor necrosis factor therapy in inflammatory bowel disease: current and future perspectives. Am J Gastroenterol. 2001;96:1977–1997. [DOI] [PubMed] [Google Scholar]
- 8.Danese S, Colombel JF, Peyrin-Biroulet L, et al. Review article: the role of anti-TNF in the management of ulcerative colitis—past, present and future. Aliment Pharmacol Ther. 2013;37:855–866. [DOI] [PubMed] [Google Scholar]
- 9.Rutgeerts PJ. Review article: efficacy of infliximab in Crohn's disease–induction and maintenance of remission. Aliment Pharmacol Ther. 1999;13(suppl 4):9–15; discussion 38. [DOI] [PubMed] [Google Scholar]
- 10.van Dullemen HM, van Deventer SJ, Hommes DW, et al. Treatment of Crohn's disease with anti-tumor necrosis factor chimeric monoclonal antibody (cA2). Gastroenterology. 1995;109:129–135. [DOI] [PubMed] [Google Scholar]
- 11.Grivennikov SI, Tumanov AV, Liepinsh DJ, et al. Distinct and nonredundant in vivo functions of TNF produced by t cells and macrophages/neutrophils: protective and deleterious effects. Immunity. 2005;22:93–104. [DOI] [PubMed] [Google Scholar]
- 12.Neurath MF, Pettersson S, Meyer zum Buschenfelde KH, et al. Local administration of antisense phosphorothioate oligonucleotides to the p65 subunit of NF-kappa B abrogates established experimental colitis in mice. Nat Med. 1996;2:998–1004. [DOI] [PubMed] [Google Scholar]
- 13.Rogler G, Brand K, Vogl D, et al. Nuclear factor kappaB is activated in macrophages and epithelial cells of inflamed intestinal mucosa. Gastroenterology. 1998;115:357–369. [DOI] [PubMed] [Google Scholar]
- 14.Hatoum OA, Binion DG, Gutterman DD. Paradox of simultaneous intestinal ischaemia and hyperaemia in inflammatory bowel disease. Eur J Clin Invest. 2005;35:599–609. [DOI] [PubMed] [Google Scholar]
- 15.Ludwig MG, Vanek M, Guerini D, et al. Proton-sensing G-protein-coupled receptors. Nature. 2003;425:93–98. [DOI] [PubMed] [Google Scholar]
- 16.Seuwen K, Ludwig MG, Wolf RM. Receptors for protons or lipid messengers or both? J Recept Signal Transduct Res. 2006;26:599–610. [DOI] [PubMed] [Google Scholar]
- 17.Mogi C, Tomura H, Tobo M, et al. Sphingosylphosphorylcholine antagonizes proton-sensing ovarian cancer G-protein-coupled receptor 1 (OGR1)-mediated inositol phosphate production and cAMP accumulation. J Pharmacol Sci. 2005;99:160–167. [DOI] [PubMed] [Google Scholar]
- 18.Tomura H, Wang JQ, Komachi M, et al. Prostaglandin I(2) production and cAMP accumulation in response to acidic extracellular pH through OGR1 in human aortic smooth muscle cells. J Biol Chem. 2005;280:34458–34464. [DOI] [PubMed] [Google Scholar]
- 19.Ichimonji I, Tomura H, Mogi C, et al. Extracellular acidification stimulates IL-6 production and Ca2+ mobilization through proton-sensing OGR1 receptors in human airway smooth muscle cells. Am J Physiol Lung Cell Mol Physiol. 2010;299:L567–L577. [DOI] [PubMed] [Google Scholar]
- 20.Palmer CD, Rahman FZ, Sewell GW, et al. Diminished macrophage apoptosis and reactive oxygen species generation after phorbol ester stimulation in Crohn's disease. PLoS One. 2009;4:e7787. [DOI] [PMC free article] [PubMed] [Google Scholar]
- 21.Campos N, Magro F, Castro AR, et al. Macrophages from IBD patients exhibit defective tumour necrosis factor-alpha secretion but otherwise normal or augmented pro-inflammatory responses to infection. Immunobiology. 2011;216:961–970. [DOI] [PubMed] [Google Scholar]
- 22.Franke A, McGovern DP, Barrett JC, et al. Genome-wide meta-analysis increases to 71 the number of confirmed Crohn's disease susceptibility loci. Nat Genet. 2010;42:1118–1125. [DOI] [PMC free article] [PubMed] [Google Scholar]
- 23.Onozawa Y, Komai T, Oda T. Activation of T cell death-associated gene 8 attenuates inflammation by negatively regulating the function of inflammatory cells. Eur J Pharmacol. 2011;654:315–319. [DOI] [PubMed] [Google Scholar]
- 24.Wirtz S, Neurath MF. Mouse models of inflammatory bowel disease. Adv Drug Deliv Rev. 2007;59:1073–1083. [DOI] [PubMed] [Google Scholar]
- 25.Solomon L, Mansor S, Mallon P, et al. The dextran sulphate sodium (DSS) model of colitis: an overview. Comp Clin Pathol. 2010;19:235–239. [Google Scholar]
- 26.Hibi T, Ogata H, Sakuraba A. Animal models of inflammatory bowel disease. J Gastroenterol. 2002;37:409–417. [DOI] [PubMed] [Google Scholar]
- 27.Rogler G, Daig R, Aschenbrenner E, et al. Establishment of long-term primary cultures of human small and large intestinal epithelial cells. Lab Invest. 1998;78:889–890. [PubMed] [Google Scholar]
- 28.Mohebbi N, Benabbas C, Vidal S, et al. The proton-activated G protein coupled receptor OGR1 acutely regulates the activity of epithelial proton transport proteins. Cell Physiol Biochem. 2012;29:313–324. [DOI] [PubMed] [Google Scholar]
- 29.Zhang X, Goncalves R, Mosser DM. The isolation and characterization of murine macrophages. Curr Protoc Immunol. 2008; Chapter 14:Unit 14 1. [DOI] [PMC free article] [PubMed] [Google Scholar]
- 30.Bentz S, Pesch T, Wolfram L, et al. Lack of transketolase-like (TKTL) 1 aggravates murine experimental colitis. Am J Physiol Gastrointest Liver Physiol. 2011;300:G598–G607. [DOI] [PubMed] [Google Scholar]
- 31.Fischbeck A, Leucht K, Frey-Wagner I, et al. Sphingomyelin induces cathepsin D-mediated apoptosis in intestinal epithelial cells and increases inflammation in DSS colitis. Gut. 2011;60:55–65. [DOI] [PubMed] [Google Scholar]
- 32.Kauffmann A, Gentleman R, Huber W. arrayQualityMetrics—a bioconductor package for quality assessment of microarray data. Bioinformatics. 2009;25:415–416. [DOI] [PMC free article] [PubMed] [Google Scholar]
- 33.Auwerx J. The human leukemia cell line, THP-1: a multifaceted model for the study of monocyte-macrophage differentiation. Experientia. 1991;47:22–31. [DOI] [PubMed] [Google Scholar]
- 34.Widmann C, Gibson S, Jarpe MB, et al. Mitogen-activated protein kinase: conservation of a three-kinase module from yeast to human. Physiol Rev. 1999;79:143–180. [DOI] [PubMed] [Google Scholar]
- 35.Seger R, Krebs EG. The MAPK signaling cascade. FASEB J. 1995;9:726–735. [PubMed] [Google Scholar]
- 36.Cargnello M, Roux PP. Activation and function of the MAPKs and their substrates, the MAPK-activated protein kinases. Microbiol Mol Biol Rev. 2011;75:50–83. [DOI] [PMC free article] [PubMed] [Google Scholar]
- 37.Angel P, Karin M. The role of Jun, Fos and the AP-1 complex in cell-proliferation and transformation. Biochim Biophys Acta. 1991;1072:129–157. [DOI] [PubMed] [Google Scholar]
- 38.Karin M. The regulation of AP-1 activity by mitogen-activated protein kinases. J Biol Chem. 1995;270:16483–16486. [DOI] [PubMed] [Google Scholar]
- 39.DeFranco AL, Crowley MT, Finn A, et al. The role of tyrosine kinases and map kinases in LPS-induced signaling. Prog Clin Biol Res. 1998;397:119–136. [PubMed] [Google Scholar]
- 40.Englaro W, Bahadoran P, Bertolotto C, et al. Tumor necrosis factor alpha-mediated inhibition of melanogenesis is dependent on nuclear factor kappa B activation. Oncogene. 1999;18:1553–1559. [DOI] [PubMed] [Google Scholar]
- 41.Kane LP, Shapiro VS, Stokoe D, et al. Induction of NF-kappaB by the Akt/PKB kinase. Curr Biol. 1999;9:601–604. [DOI] [PubMed] [Google Scholar]
- 42.Ozes ON, Mayo LD, Gustin JA, et al. NF-kappaB activation by tumour necrosis factor requires the Akt serine-threonine kinase. Nature. 1999;401:82–85. [DOI] [PubMed] [Google Scholar]
- 43.Aggarwal BB, Kumar A, Bharti AC. Anticancer potential of curcumin: Preclinical and clinical studies. Anticancer Res. 2003;23:363–398. [PubMed] [Google Scholar]
- 44.Aggarwal S, Ichikawa H, Takada Y, et al. Curcumin (diferuloylmethane) down-regulates expression of cell proliferation and antiapoptotic and metastatic gene products through suppression of IkappaBalpha kinase and Akt activation. Mol Pharmacol. 2006;69:195–206. [DOI] [PubMed] [Google Scholar]
- 45.Katerelos M, Mudge SJ, Stapleton D, et al. 5-aminoimidazole-4-carboxamide ribonucleoside and AMP-activated protein kinase inhibit signalling through NF-kappaB. Immunol Cell Biol. 2010;88:754–760. [DOI] [PubMed] [Google Scholar]
- 46.Pierce JW, Schoenleber R, Jesmok G, et al. Novel inhibitors of cytokine-induced IkappaBalpha phosphorylation and endothelial cell adhesion molecule expression show anti-inflammatory effects in vivo. J Biol Chem. 1997;272:21096–21103. [DOI] [PubMed] [Google Scholar]
- 47.Kishore N, Sommers C, Mathialagan S, et al. A selective IKK-2 inhibitor blocks NF-kappa B-dependent gene expression in interleukin-1 beta-stimulated synovial fibroblasts. J Biol Chem. 2003;278:32861–32871. [DOI] [PubMed] [Google Scholar]
- 48.Fujioka S, Niu J, Schmidt C, et al. NF-kappaB and AP-1 connection: mechanism of NF-kappaB-dependent regulation of AP-1 activity. Mol Cell Biol. 2004;24:7806–7819. [DOI] [PMC free article] [PubMed] [Google Scholar]
- 49.Cartharius K, Frech K, Grote K, et al. MatInspector and beyond: promoter analysis based on transcription factor binding sites. Bioinformatics. 2005;21:2933–2942. [DOI] [PubMed] [Google Scholar]
- 50.Lum H, Qiao J, Walter RJ, et al. Inflammatory stress increases receptor for lysophosphatidylcholine in human microvascular endothelial cells. Am J Physiol Heart Circ Physiol. 2003;285:H1786–H1789. [DOI] [PubMed] [Google Scholar]
- 51.Haas JG, Baeuerle PA, Riethmuller G, et al. Molecular mechanisms in down-regulation of tumor necrosis factor expression. Proc Natl Acad Sci U S A. 1990;87:9563–9567. [DOI] [PMC free article] [PubMed] [Google Scholar]
- 52.Ziegler-Heitbrock HW, Blumenstein M, Kafferlein E, et al. In vitro desensitization to lipopolysaccharide suppresses tumour necrosis factor, interleukin-1 and interleukin-6 gene expression in a similar fashion. Immunology. 1992;75:264–268. [PMC free article] [PubMed] [Google Scholar]
- 53.Pei L, Castrillo A, Tontonoz P. Regulation of macrophage inflammatory gene expression by the orphan nuclear receptor Nur77. Mol Endocrinol. 2006;20:786–794. [DOI] [PubMed] [Google Scholar]
- 54.Esnault C, Stewart A, Gualdrini F, et al. Rho-actin signaling to the MRTF coactivators dominates the immediate transcriptional response to serum in fibroblasts. Genes Dev. 2014;28:943–958. [DOI] [PMC free article] [PubMed] [Google Scholar]
- 55.Zhang YQ, Resta S, Jung B, et al. Upregulation of activin signaling in experimental colitis. Am J Physiol Gastrointest Liver Physiol. 2009;297:G768–G780. [DOI] [PMC free article] [PubMed] [Google Scholar]
- 56.Sierra-Filardi E, Puig-Kroger A, Blanco FJ, et al. Activin A skews macrophage polarization by promoting a proinflammatory phenotype and inhibiting the acquisition of anti-inflammatory macrophage markers. Blood. 2011;117:5092–5101. [DOI] [PubMed] [Google Scholar]
- 57.Lin Z, Hegarty JP, Cappel JA, et al. Identification of disease-associated DNA methylation in intestinal tissues from patients with inflammatory bowel disease. Clin Genet. 2011;80:59–67. [DOI] [PubMed] [Google Scholar]
- 58.Karatzas PS, Gazouli M, Safioleas M, et al. DNA methylation changes in inflammatory bowel disease. Ann Gastroenterol. 2014;27:125–132. [PMC free article] [PubMed] [Google Scholar]
- 59.Ng YL, Klopcic B, Lloyd F, et al. Secreted protein acidic and rich in cysteine (SPARC) exacerbates colonic inflammatory symptoms in dextran sodium sulphate-induced murine colitis. PLoS One. 2013;8:e77575. [DOI] [PMC free article] [PubMed] [Google Scholar]
- 60.Aljarari NMH. The role of GPCR on various second messenger systems. J Basic Med Allied Sci. 2012:1–7. [Google Scholar]
- 61.Anderson CA, Boucher G, Lees CW, et al. Meta-analysis identifies 29 additional ulcerative colitis risk loci, increasing the number of confirmed associations to 47. Nat Genet. 2011;43:246–252. [DOI] [PMC free article] [PubMed] [Google Scholar]
- 62.Jostins L, Ripke S, Weersma RK, et al. Host-microbe interactions have shaped the genetic architecture of inflammatory bowel disease. Nature. 2012;491:119–124. [DOI] [PMC free article] [PubMed] [Google Scholar]
- 63.Khor B, Gardet A, Xavier RJ. Genetics and pathogenesis of inflammatory bowel disease. Nature. 2011;474:307–317. [DOI] [PMC free article] [PubMed] [Google Scholar]


