Understanding the reliable anatomic landmarks of the posterior frontal lobe is crucial to planning resection of gliomas close to the motor cortex, premotor cortex, and supplementary motor area and to determining the possible outcomes of immediate postoperative deficits; also, an understanding of variable anatomic landmarks may help explain observed patterns of spread of gliomas.
Abstract
The posterior frontal lobe of the brain houses Brodmann area 4, which is the primary motor cortex, and Brodmann area 6, which consists of the supplementary motor area on the medial portion of the hemisphere and the premotor cortex on the lateral portion. In this area, safe resection is dependent on accurate localization of the motor cortex and the central sulcus, which can usually be achieved by using thin-section imaging and confirmed by using other techniques. The most reliable anatomic landmarks are the “hand knob” area and the marginal ramus of the cingulate sulcus. Postoperatively, motor deficits can occur not only because of injury to primary motor cortex but also because of injury to the supplementary motor area. Unlike motor cortex injury, the supplementary motor area syndrome is transient, if it occurs at all. On the lateral hemisphere, motor and language deficits can also occur because of premotor cortex injury, but a dense motor deficit would indicate subcortical injury to the corticospinal tract. The close relationship of the subcortical motor fibers and premotor cortex is illustrated. In contrast to the more constant landmarks of the central sulcus and marginal ramus, which aid in preoperative localization, the variable interruptions in the precentral and cingulate sulci of the posterior frontal lobe seem to provide “cortical bridges” for spread of infiltrating gliomas.
©RSNA, 2015
SA-CME LEARNING OBJECTIVES
After completing this journal-based SA-CME activity, participants will be able to:
■ Identify the central sulcus and precentral sulcus.
■ Describe the clinical manifestations of SMA syndrome and the associated postoperative imaging appearance.
■ Apply knowledge of the clinical importance and anatomy of the motor and premotor areas to preoperative evaluation of brain tumors.
Introduction
Surgery is crucial in management of gliomas. The importance of the extent of resection for glioblastoma has been controversial, but modern literature supports safe maximal resection of low- and high-grade gliomas (1–3). Surgical resection may be limited for a tumor in or near the motor area. This is not a small problem, because 25% of gliomas arise in the frontal lobe (4). Radiologists involved in preoperative evaluation of brain tumors should be familiar with the clinical importance and anatomy of the motor and premotor areas.
For precision in naming and localization of the cortical motor and premotor areas of the frontal lobe, publications by surgeons and anatomists often refer to Brodmann’s map. Brodmann divided the cerebral cortex into numbered areas on the basis of the histologic appearance of six cell layers, which generally correlate with function. We further applied the cortical Brodmann map to organize the superficial white matter of the cerebral hemispheres (5). This article illustrates the functional anatomy of gliomas that occupy the cortex and superficial white matter of Brodmann area (BA) 6; we will stress the localization of vital structures, which can be used to guide surgery in this complex area. For clarity, the discussion is divided according to portions of BA 6 that are located on medial and lateral areas of the hemisphere (hereafter, medial and lateral BA 6).
The medial and lateral areas are at risk for different types of postoperative injury. Medial BA 6, where the supplementary motor area (SMA) is located, is somatotopically organized and is involved in planning, rehearsing, programming, and initiating complex contralateral motor sequences. The SMA of the dominant hemisphere has a large role in speech initiation. Postoperative SMA syndrome results in transient motor and speech deficits and will be presented in more detail later (6,7). The prevention of postoperative deficit of BA 6 on the lateral hemisphere is dependent on localizing the subcortical motor tract. Deficits involving the premotor cortex, or lateral BA 6, can manifest as apraxia; in the dominant hemisphere, the deficit can involve language (8).
In our experience, the variations in anatomy of medial and lateral BA 6 also influence the spread pattern of gliomas. Infiltrating gliomas may prefer to spread along the cortex rather than sulci, so that their appearance is determined by variations in sulcal anatomy. Glioblastomas often appear to have a more subcortical spread pattern.
Medial BA 6 and SMA
Anatomic Landmarks
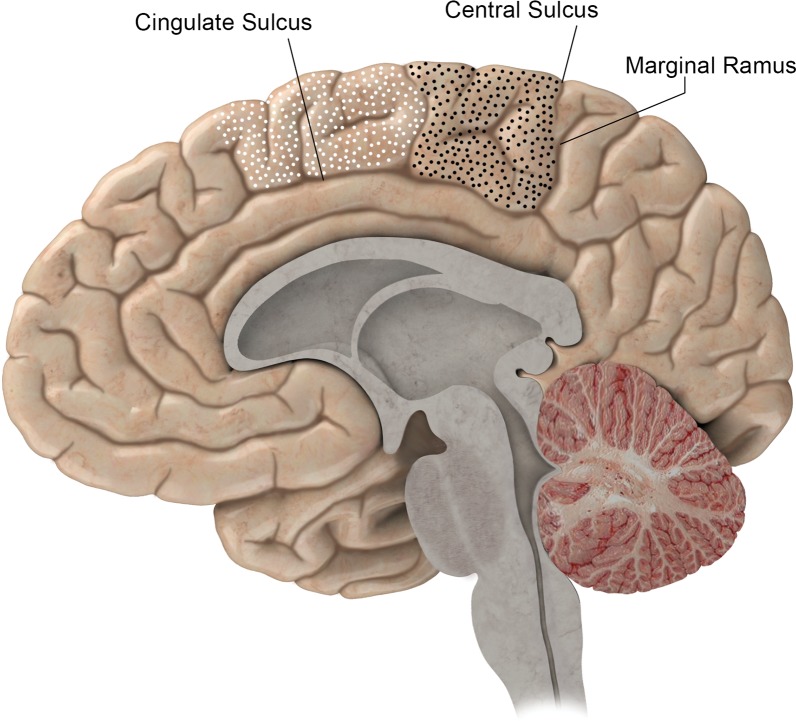
BA 6 is one of several BAs that include both the lateral and medial surfaces of the cerebral hemisphere. On the medial surface, BA 6 and the SMA are defined by the cingulate sulcus inferiorly. The SMA wraps over the top of the superior frontal gyrus to the superior frontal sulcus. The posterior margin of the SMA, and of BA 6 above the superior frontal sulcus, is generally the precentral sulcus. Note that the precentral sulcus rarely extends to the medial surface. Brodmann acknowledged that the anterior margin of BA 6 was variable (5) (Fig 1).
Figure 1.
BA 4 (black-dotted area) and BA 6 (white-dotted area) on the medial portion of the right hemisphere. The posterior margin of BA 4 is the central sulcus. The anterior margins of BA 4 and BA 6 are variable on the medial hemisphere, and the inferior margin of both is the cingulate sulcus. The continuation of the cingulate sulcus that curves up toward the convexity is named the marginal ramus. The marginal ramus has a variable termination. It may be forked, as here, or reach the surface of the convexity.
Clinical Importance
The portion of BA 6 that is confined to the medial surface of the cerebral hemisphere has clinical relevance because part of this cortex is an eloquent region that plans motor functions and rhythmic movements. In the dominant hemisphere, the anterior part of this area initiates speech. The middle part of the SMA mediates initiation and programming of facial and upper extremity movement, and the most posterior part mediates the same functions for the lower limb. The SMA must be stimulated more intensely than the primary motor cortex to produce movement during surgery. The resulting movement is complex, such as opening and closing the hand (9–11). On the dominant side, stimulation during surgery causes anomia (8,12).
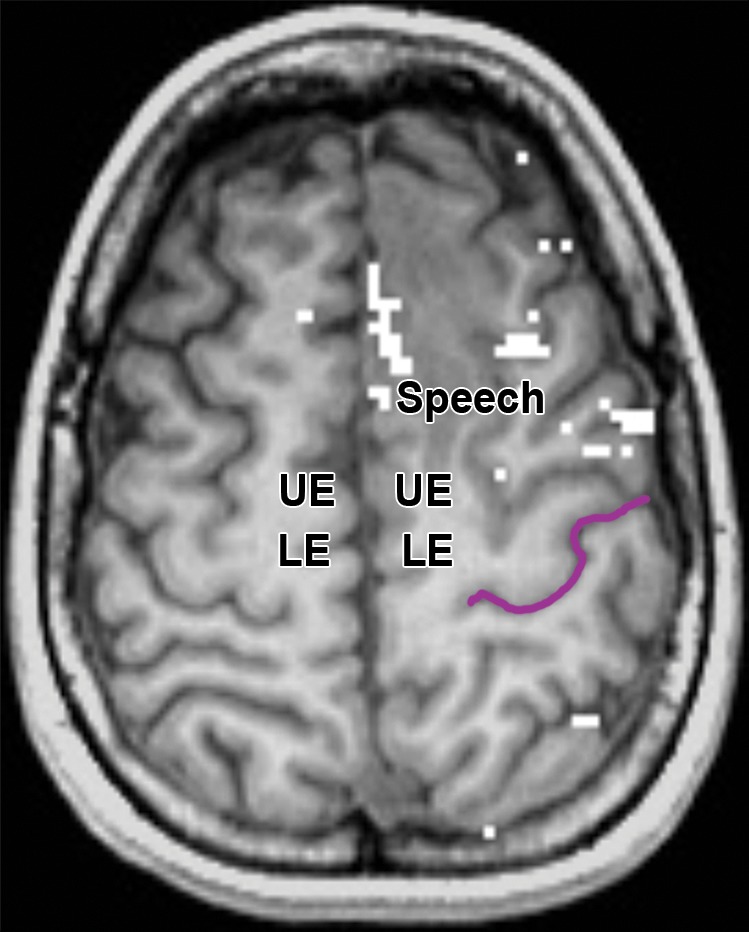
In 1977, Laplane et al (13) described the full postoperative SMA syndrome as global contralateral akinesia with speech arrest, sudden partial motor recovery with reduction of spontaneous movement and speech, and long-term near-complete recovery with continued disturbance of rapid alternating movement. Partial SMA syndrome can also occur. SMA syndrome due to SMA injury in the dominant hemisphere can cause a transient language deficit, as occurred in the case described in Figure 2. In the immediate postoperative period, the motor deficits may be presumed to have resulted from primary motor cortex or motor fiber injury; however, near-complete recovery of motor deficit is expected for patients with full or partial SMA syndrome. A sudden improvement is seen within 10 days; further gains may be made with rehabilitation. Even when the cortex is resected, a deficit occurs in about 30% of patients (6,14) (Fig 2). In summary, SMA syndrome is a postoperative deficit in movement and/or language programming, which is expected to improve rapidly, although some milder form of the deficit may persist.
Figure 2a.
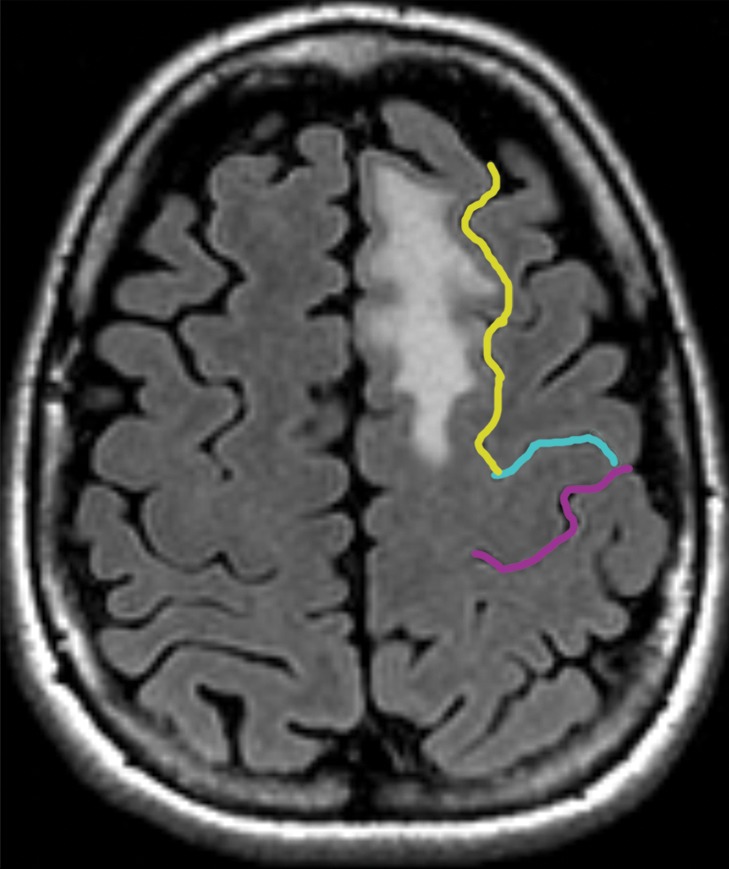
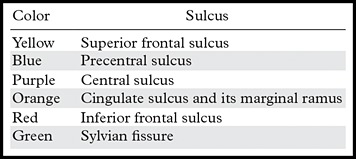
Partial SMA syndrome after glioma resection. A 22-year-old woman underwent magnetic resonance (MR) imaging because of seizures. She reported increasing incoordination, causing difficulty typing and walking her dogs. Resection of the SMA tumor revealed anaplastic astrocytoma. Postoperatively, she experienced a debilitating naming deficit, which improved, in keeping with partial SMA syndrome. (a) Axial fluid-attenuated inversion-recovery (FLAIR) MR image shows nonenhancing tumor confined to the superior frontal gyrus (yellow). (See Table for color coding of sulcal lines.) (b) Axial functional MR image obtained during a right-hand motor task shows normal blood oxygen level–dependent (BOLD) activation in the central sulcus at the hand knob (lateral white pixels) and in the SMA (medial white pixels) at the position of the upper extremity (UE) motor cortex region. The lower extremity (LE) region of the SMA should be somatotopically arranged posterior to the upper extremity SMA region, and the speech region is located anterior to it. (c) Axial functional MR image obtained during a category-naming task shows normal BOLD activation in the speech region of the SMA at the margin of the tumor. (d) Axial T1-weighted MR image shows the appearance after gross total resection of the anaplastic astrocytoma involving the speech region of the SMA.
Figure 2b.
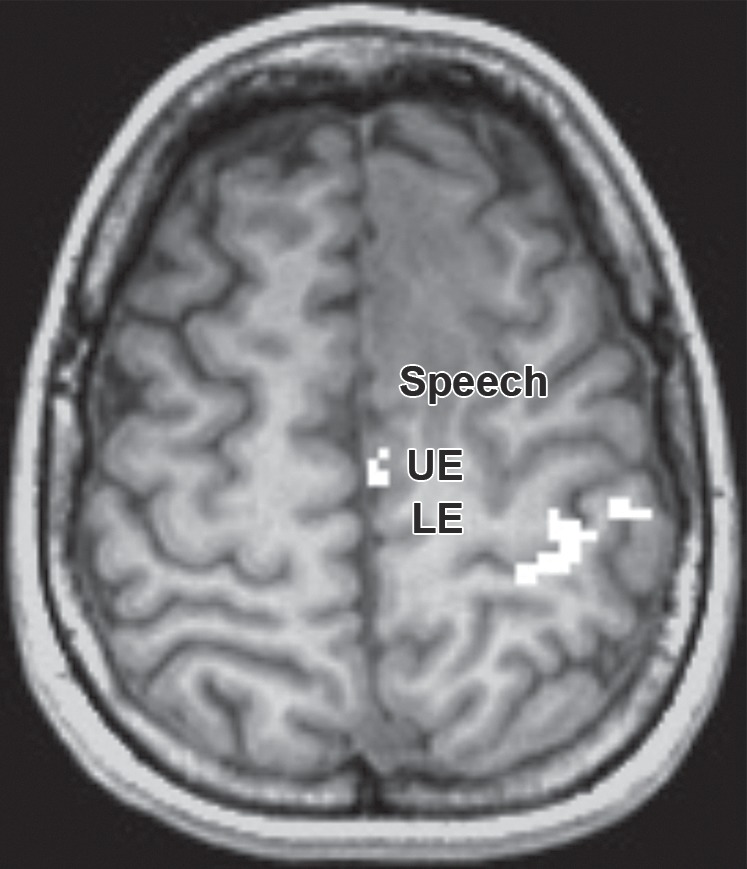
Partial SMA syndrome after glioma resection. A 22-year-old woman underwent magnetic resonance (MR) imaging because of seizures. She reported increasing incoordination, causing difficulty typing and walking her dogs. Resection of the SMA tumor revealed anaplastic astrocytoma. Postoperatively, she experienced a debilitating naming deficit, which improved, in keeping with partial SMA syndrome. (a) Axial fluid-attenuated inversion-recovery (FLAIR) MR image shows nonenhancing tumor confined to the superior frontal gyrus (yellow). (See Table for color coding of sulcal lines.) (b) Axial functional MR image obtained during a right-hand motor task shows normal blood oxygen level–dependent (BOLD) activation in the central sulcus at the hand knob (lateral white pixels) and in the SMA (medial white pixels) at the position of the upper extremity (UE) motor cortex region. The lower extremity (LE) region of the SMA should be somatotopically arranged posterior to the upper extremity SMA region, and the speech region is located anterior to it. (c) Axial functional MR image obtained during a category-naming task shows normal BOLD activation in the speech region of the SMA at the margin of the tumor. (d) Axial T1-weighted MR image shows the appearance after gross total resection of the anaplastic astrocytoma involving the speech region of the SMA.
Figure 2c.
Partial SMA syndrome after glioma resection. A 22-year-old woman underwent magnetic resonance (MR) imaging because of seizures. She reported increasing incoordination, causing difficulty typing and walking her dogs. Resection of the SMA tumor revealed anaplastic astrocytoma. Postoperatively, she experienced a debilitating naming deficit, which improved, in keeping with partial SMA syndrome. (a) Axial fluid-attenuated inversion-recovery (FLAIR) MR image shows nonenhancing tumor confined to the superior frontal gyrus (yellow). (See Table for color coding of sulcal lines.) (b) Axial functional MR image obtained during a right-hand motor task shows normal blood oxygen level–dependent (BOLD) activation in the central sulcus at the hand knob (lateral white pixels) and in the SMA (medial white pixels) at the position of the upper extremity (UE) motor cortex region. The lower extremity (LE) region of the SMA should be somatotopically arranged posterior to the upper extremity SMA region, and the speech region is located anterior to it. (c) Axial functional MR image obtained during a category-naming task shows normal BOLD activation in the speech region of the SMA at the margin of the tumor. (d) Axial T1-weighted MR image shows the appearance after gross total resection of the anaplastic astrocytoma involving the speech region of the SMA.
Figure 2d.
Partial SMA syndrome after glioma resection. A 22-year-old woman underwent magnetic resonance (MR) imaging because of seizures. She reported increasing incoordination, causing difficulty typing and walking her dogs. Resection of the SMA tumor revealed anaplastic astrocytoma. Postoperatively, she experienced a debilitating naming deficit, which improved, in keeping with partial SMA syndrome. (a) Axial fluid-attenuated inversion-recovery (FLAIR) MR image shows nonenhancing tumor confined to the superior frontal gyrus (yellow). (See Table for color coding of sulcal lines.) (b) Axial functional MR image obtained during a right-hand motor task shows normal blood oxygen level–dependent (BOLD) activation in the central sulcus at the hand knob (lateral white pixels) and in the SMA (medial white pixels) at the position of the upper extremity (UE) motor cortex region. The lower extremity (LE) region of the SMA should be somatotopically arranged posterior to the upper extremity SMA region, and the speech region is located anterior to it. (c) Axial functional MR image obtained during a category-naming task shows normal BOLD activation in the speech region of the SMA at the margin of the tumor. (d) Axial T1-weighted MR image shows the appearance after gross total resection of the anaplastic astrocytoma involving the speech region of the SMA.
Color Coding of Sulcal Lines in Figures
Spread Pattern in Patients with Glioma
The well-known “butterfly” glioblastoma (15,16) may represent a late stage of medial frontal glioma. Before reaching the corpus callosum and opposite hemisphere, gliomas arising in BA 6 may infiltrate through interruptions in the cingulate sulcus. The opposite route of spread is also seen, from the cingulate gyrus to BA 6. Interruptions in the cingulate sulcus are present in 40% of normal brain hemispheres (17). In our experience, infiltrating gliomas tend to spread through gyri rather than through sulci. When gliomas infiltrate through normal interruptions in sulci, also called incomplete sulci, we call these cortical bridges (Figs 3, 4).
Figure 3a.
Glioma infiltration through an interrupted cingulate sulcus. (a) A 45-year-old man with left upper extremity seizure underwent gross total resection of tumor in the cingulate gyrus and SMA, revealing anaplastic astrocytoma. Preoperative sagittal FLAIR MR image shows glioma infiltrating over the cortical bridge between the cingulate gyrus and BA 6. (b) Sagittal FLAIR MR image in a 47-year-old man with left temporal oligodendroglioma shows normal interruption in the cingulate sulcus. Purple shading = communication between cingulate gyrus and BA 6. See the Table for color coding of sulcal lines.
Figure 4a.
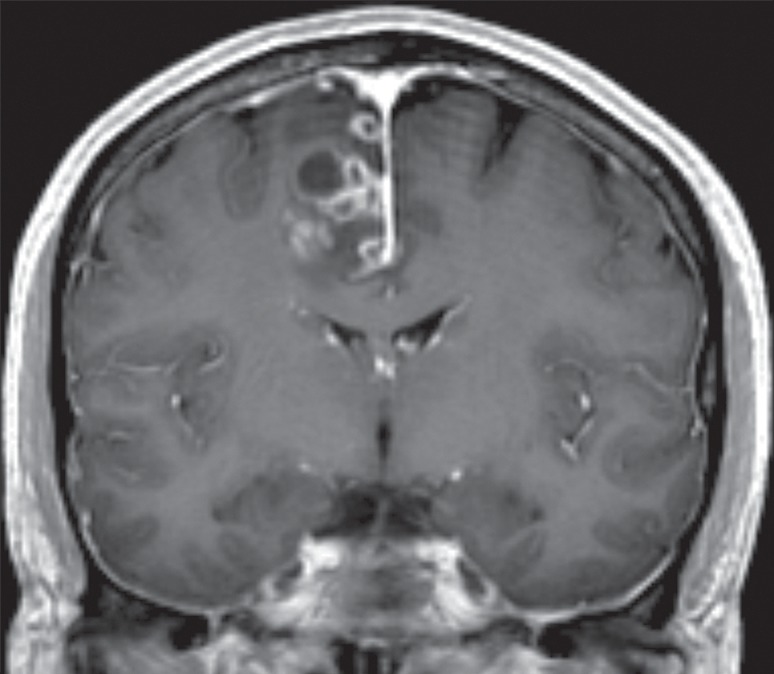
Glioblastoma in the cingulate gyrus and BA 6, associated with an interrupted cingulate sulcus. A 57-year-old man presented with left-upper-extremity shaking while playing golf. Resection of the cingulate gyrus and SMA tumor revealed glioblastoma. (a) Coronal contrast material–enhanced T1-weighted MR image shows heterogeneously enhancing glioblastoma in the right parafalcine posterior frontal lobe. (b) Sagittal T2-weighted MR image shows the glioblastoma in the cingulate gyrus and BA 6.
Figure 3b.
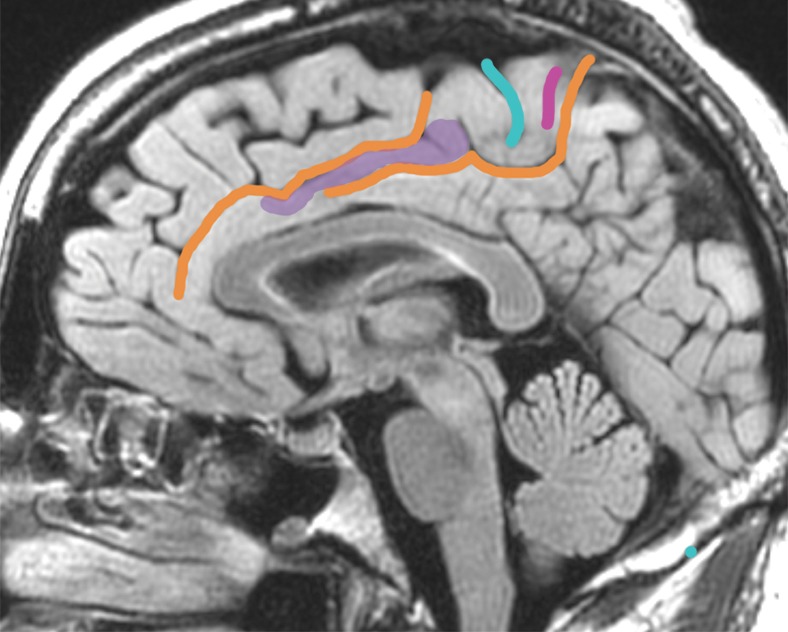
Glioma infiltration through an interrupted cingulate sulcus. (a) A 45-year-old man with left upper extremity seizure underwent gross total resection of tumor in the cingulate gyrus and SMA, revealing anaplastic astrocytoma. Preoperative sagittal FLAIR MR image shows glioma infiltrating over the cortical bridge between the cingulate gyrus and BA 6. (b) Sagittal FLAIR MR image in a 47-year-old man with left temporal oligodendroglioma shows normal interruption in the cingulate sulcus. Purple shading = communication between cingulate gyrus and BA 6. See the Table for color coding of sulcal lines.
Figure 4b.
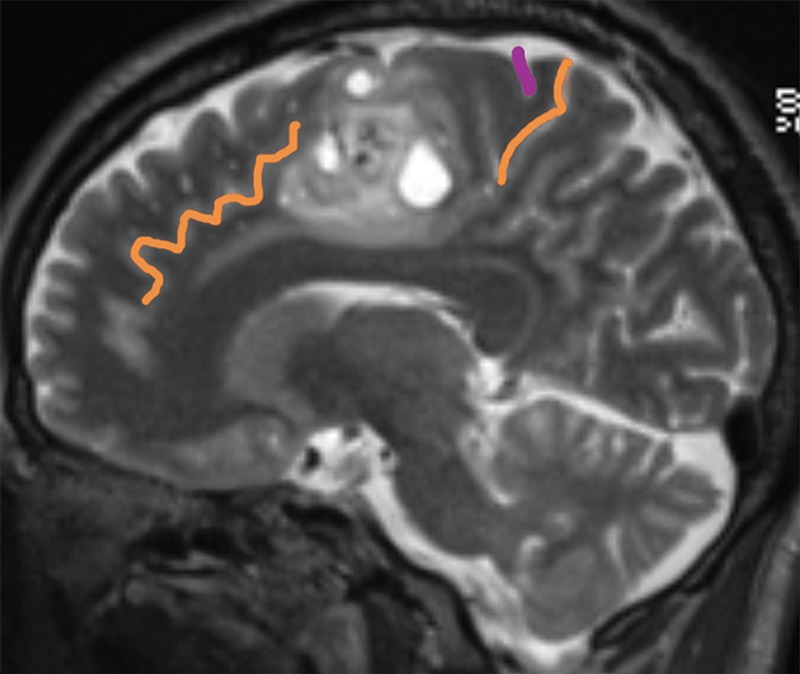
Glioblastoma in the cingulate gyrus and BA 6, associated with an interrupted cingulate sulcus. A 57-year-old man presented with left-upper-extremity shaking while playing golf. Resection of the cingulate gyrus and SMA tumor revealed glioblastoma. (a) Coronal contrast material–enhanced T1-weighted MR image shows heterogeneously enhancing glioblastoma in the right parafalcine posterior frontal lobe. (b) Sagittal T2-weighted MR image shows the glioblastoma in the cingulate gyrus and BA 6.
Lateral BA 6 and Primary Motor Cortex
Clinical Importance
Both the lateral and medial parts of BA 6 are involved in motor learning or generating preprogrammed processes that coordinate movement in time and space. Although these movements can be complex, they require decreased attention as they become learned. Examples include reproducing rhythm and alternating hand movements, such as playing the piano or writing. Although both the SMA and lateral BA 6 are important for temporal control of movement and smooth, preprogrammed, complex movements, it seems that the SMA houses memorized programs while the premotor cortex (BA 6 lateral to the superior frontal sulcus) houses programs that respond to visual cues (9). On the left, BA 6 on the lateral hemisphere plays a major role in speech articulation and picture naming. Stimulation during surgery of the premotor cortex anterior to the precentral sulcus resulted in naming deficits, while stimulation of the premotor cortex on the precentral gyrus resulted in dysarthria (8).
Anatomic Landmarks
The shape of BA 6 on the lateral surface of the hemisphere is a peculiar combination of the anterior bank of the precentral gyrus and the adjacent base of the middle frontal gyrus. The inferior frontal gyrus is not included in BA 6. The posterior aspect of the middle frontal gyrus is a common site of glioma and is close to the primary motor neurons and fibers that arise from the posterior bank of the precentral gyrus (5). BA 6 and BA 4 in fact share the precentral gyrus, as can be clearly seen in Figure 5. The proximity of lateral BA 6 gliomas to the primary motor area demands that every possible tool be used to prevent paralyzing the patient. The motor homunculus is presented in Figure 6.
Figure 5.
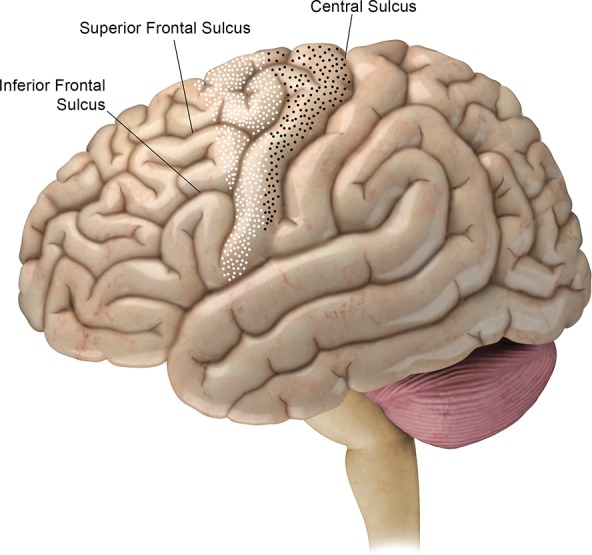
BA 4 (black-dotted area) and BA 6 (white-dotted area) on the lateral brain hemisphere. The posterior margin of BA 4 is the central sulcus. The margin between BA 4 and BA 6 runs superoanteriorly to inferoposteriorly on the precentral gyrus. The anterior margin of BA 6 runs over the superior and middle frontal gyri. Below the inferior frontal sulcus, BA 6 is entirely contained in the precentral gyrus.
Figure 6.
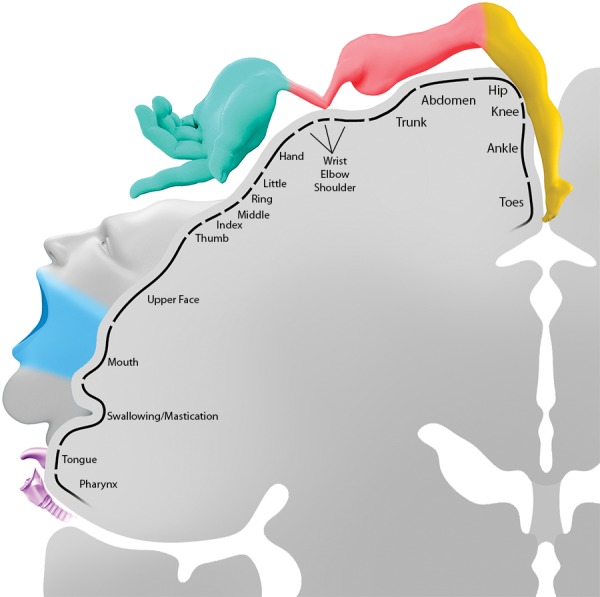
Schema shows the motor homunculus. At the high convexity, lower-extremity motor function extends onto the medial hemisphere anterior to the central sulcus. Motor function is arranged somatotopically, with lower face and voice motor control at the inferior margin of the central sulcus. Injury to the motor cortex results in a contralateral deficit except at the forehead, which is bilaterally innervated; therefore, unilateral injury does not result in paralysis. (The color coding corresponds to the coloring of the corticospinal tracts seen in Figs 10–12: leg = yellow, pink = shoulder, blue-green = hand, light gray = upper face, light blue = lower face, purple = tongue and pharynx.)
Enormous effort has gone into developing preoperative imaging that can map the motor regions of the cerebral hemispheres. Diffusion tensor imaging and magnetoencephalography were developed to enable visualization of the motor tracts, but they are often difficult to perform when tumor has altered the surrounding brain (18,19). Functional MR imaging was devised to localize the motor cortex—in particular the hand area—but its usefulness in even partially paralyzed patients is limited. None of these efforts has replaced the definitive standard of intraoperative stimulation, which is limited by many situations, not the least of which is the patient’s inability to fully cooperate for long periods of time (11). The interpretation of all these test results begins with the correct identification of the central sulcus and the hand knob area, a distinctive shape described in the next section. The discussion in the next section summarizes the approach employed at our institution to identify these anatomic landmarks.
Localization of Central Sulcus
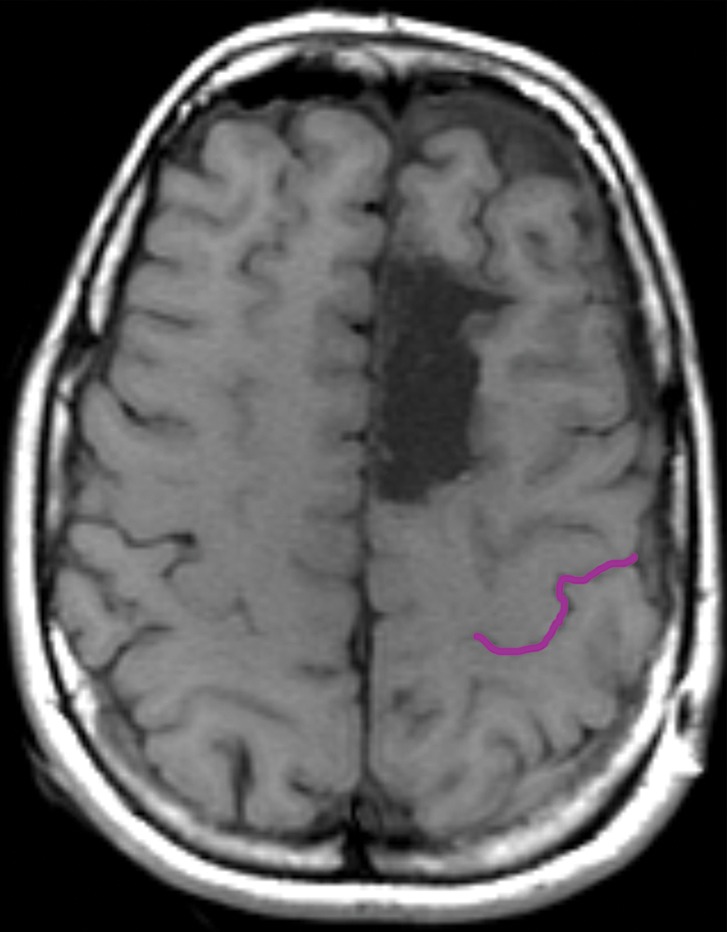
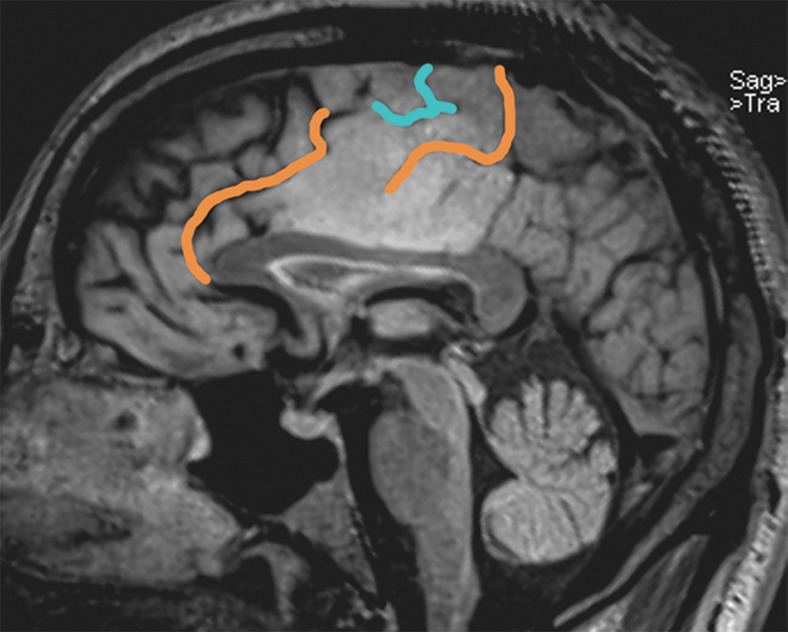
The central sulcus is among the most constant, meaning nearly always present normally, of cerebral sulci, and is continuous, meaning without interruptions, in 92% of cerebral hemispheres (20). A starting point for locating the central sulcus on cross-sectional images is to realize that the central sulcus has a known relationship to the coronal suture of the skull, which can always be found as a marrow-free strip that separates the frontal and parietal bones (21) (Fig 7). In cases where the central sulcus is not obvious, its relationship to other sulci can be used to identify it. The bracket sign uses the pars marginalis (marginal ramus) of the cingulate sulcus (22) (Fig 8). The marginal ramus of the cingulate sulcus ends immediately posterior to the central sulcus in almost 100% of hemispheres (17). Many times, the distinctive bulbous enlargements of the cortex that mediate the hand muscles will provide a helpful landmark, the hand knob, which has an omega (ω) or epsilon (ε) shape in the axial plane in 98% of hemispheres (23,24). The hand knob is hook-shaped in the sagittal plane (Fig 9) and is most often found at the level of the superior frontal sulcus. Other times, the best approach is to find the precentral sulcus; the central sulcus will be the sulcus posterior to it. The pitfall in identification of the precentral sulcus is that the precentral sulcus is often discontinuous; the upside is that its intersections with the superior frontal and inferior frontal sulci are seen in 88%–100% of hemispheres (20,25) (Figs 9–11). If these landmarks cannot be found in the glioma-bearing hemisphere, marking them on the opposite (normal) side can be helpful by providing reference points.
Figure 7.
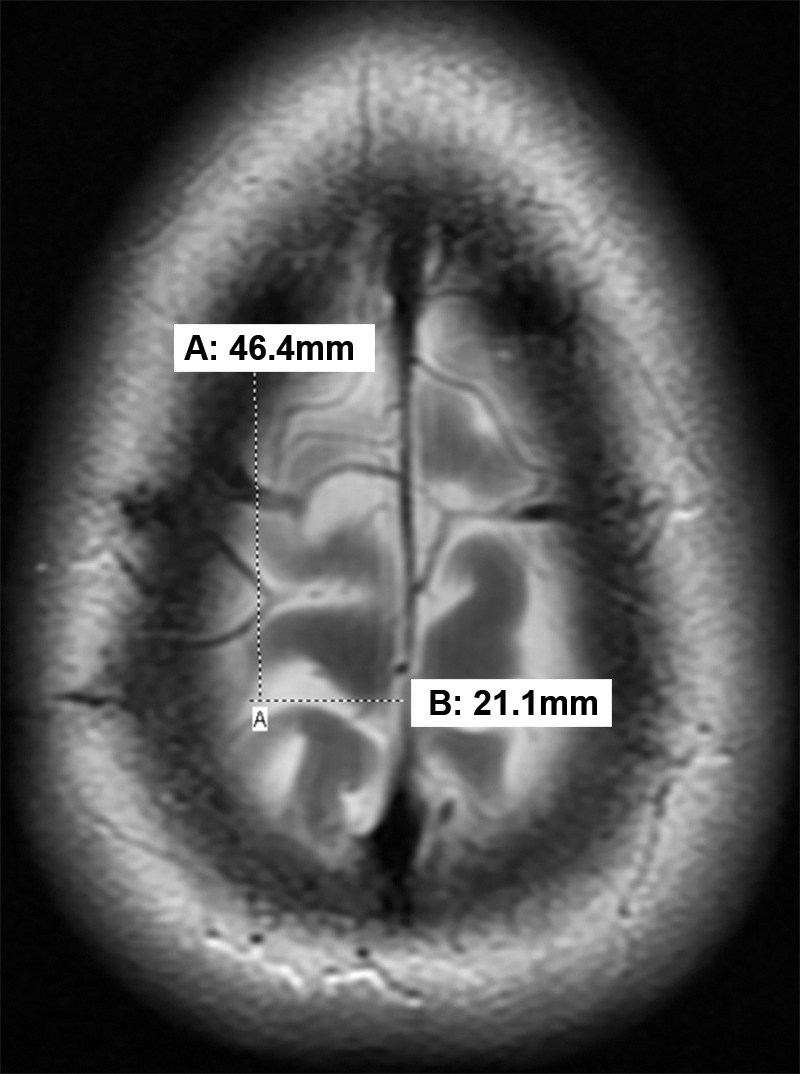
Axial MR image shows that the central sulcus is 46.4 mm posterior to the coronal suture and 21.1 mm lateral to the midline established by the falx cerebri.
Figure 8a.
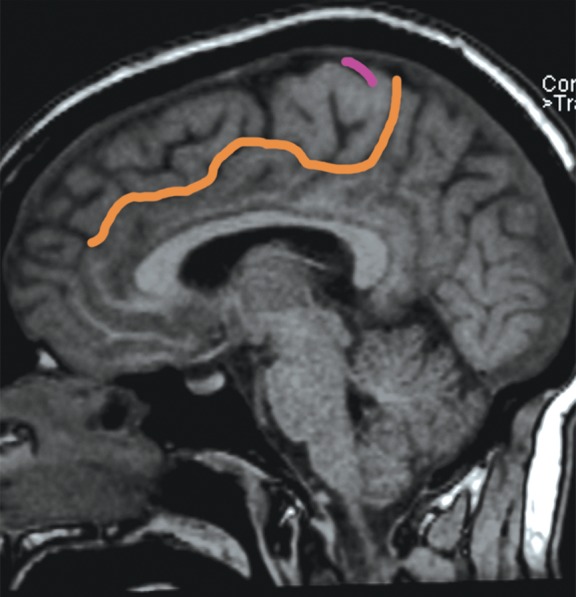
The bracket sign. Once the marginal ramus (orange) is located, the central sulcus (purple) is identifiable as the first sulcus immediately anterior to the marginal ramus. (a) Sagittal unenhanced T1-weighted MR image. (b) Axial unenhanced T1-weighted MR image.
Figure 9a.
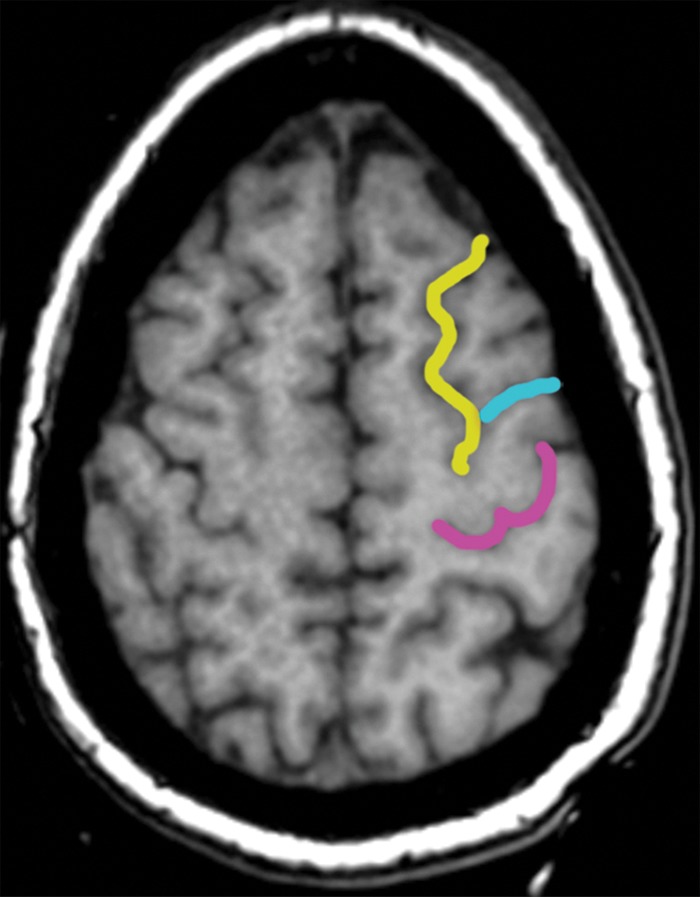
Localization of the precentral sulcus intersections and hand knob. (a) Axial T1-weighted MR image shows the intersection of the superior frontal sulcus (yellow) with the precentral sulcus (blue). The central sulcus (purple) forms an epsilon-shaped hand knob. See Figure 2b and 2c for an example of an omega-shaped hand knob. (b) Parasagittal T1-weighted MR image shows the “hook” sign of the hand knob in the sagittal plane. (c) Parasagittal T1-weighted MR image lateral to b shows the intersection of the inferior frontal sulcus (red) with the precentral sulcus (blue), and the central sulcus (purple) behind it.
Figure 11a.
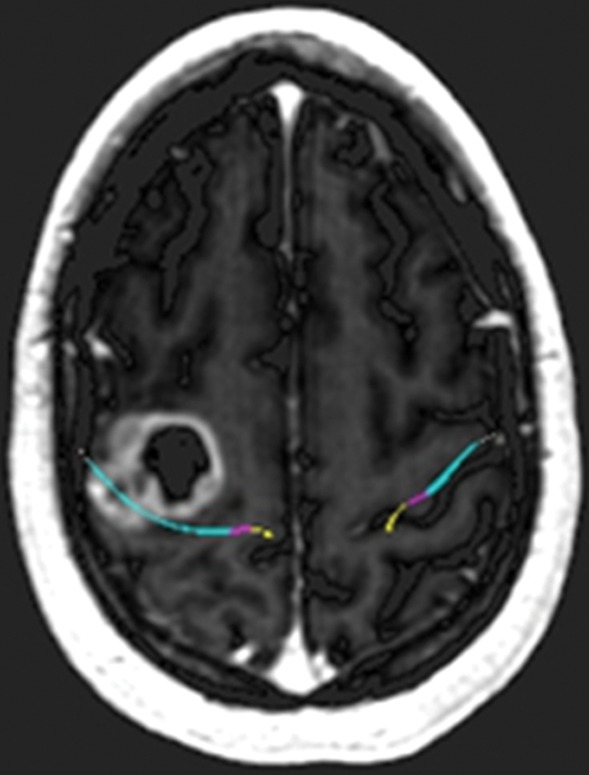
Glioblastoma under the hand knob. A 52-year-old woman noticed left third- and fourth-digit weakness that progressed to complete loss of left-hand function over 4–6 weeks. She was not a good candidate for functional MR imaging because of poor motor function. Diffusion tensor imaging was performed, but the tracts were not well seen. Contrast-enhanced T1-weighted MR images with embedded deformable anatomic template (see Fig 6 for color coding key) are helpful to show the relationship to the motor tract. The atlas-based motor tract was deformed around the glioblastoma to show the possible deviation in the tracts, assuming the tracts were intact. Resection of the rim-enhancing lesion under the hand knob revealed glioblastoma. After surgery, the patient had dense left hemiplegia, which improved slightly over 8 months of physical therapy. (a) Axial contrast-enhanced T1-weighted MR image shows how the tracts may be displaced posterior to the tumor. (b) Sagittal contrast-enhanced T1-weighted MR image shows the manual deformation of the upper extremity tracts and the normal course of the lower face and tongue motor fibers.
Figure 8b.
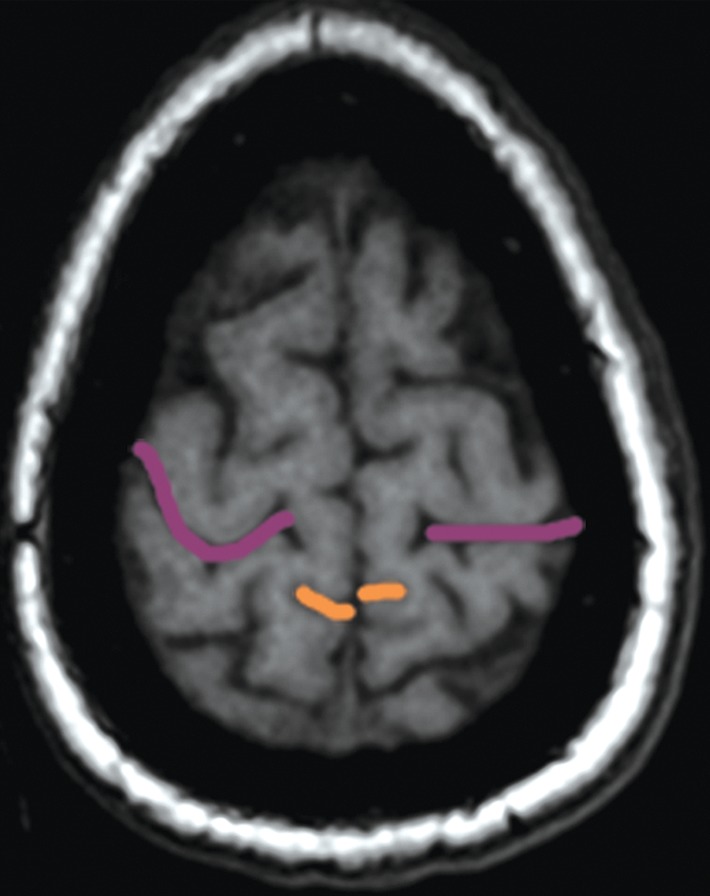
The bracket sign. Once the marginal ramus (orange) is located, the central sulcus (purple) is identifiable as the first sulcus immediately anterior to the marginal ramus. (a) Sagittal unenhanced T1-weighted MR image. (b) Axial unenhanced T1-weighted MR image.
Figure 9b.
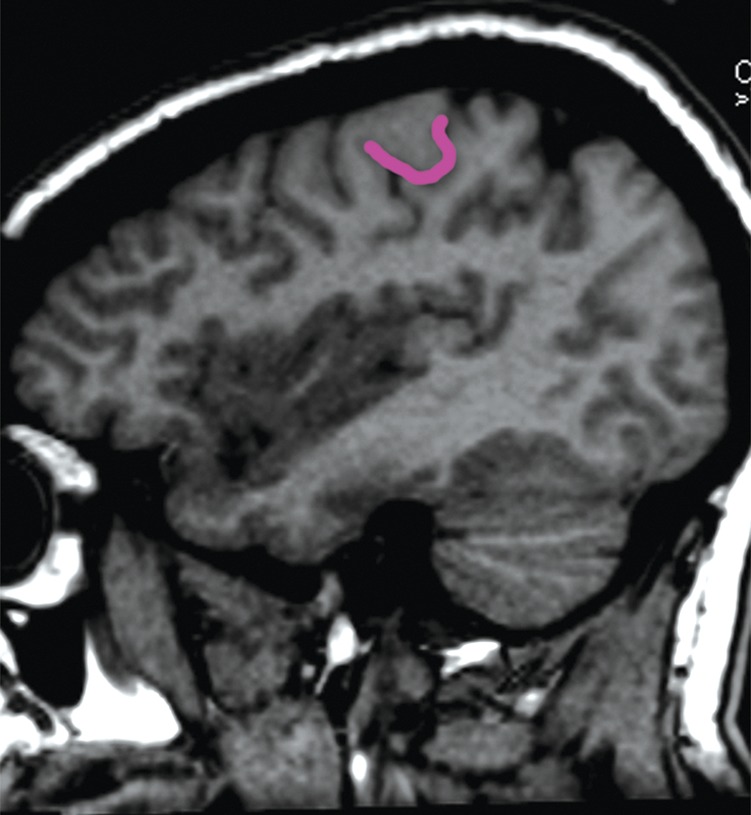
Localization of the precentral sulcus intersections and hand knob. (a) Axial T1-weighted MR image shows the intersection of the superior frontal sulcus (yellow) with the precentral sulcus (blue). The central sulcus (purple) forms an epsilon-shaped hand knob. See Figure 2b and 2c for an example of an omega-shaped hand knob. (b) Parasagittal T1-weighted MR image shows the “hook” sign of the hand knob in the sagittal plane. (c) Parasagittal T1-weighted MR image lateral to b shows the intersection of the inferior frontal sulcus (red) with the precentral sulcus (blue), and the central sulcus (purple) behind it.
Figure 9c.
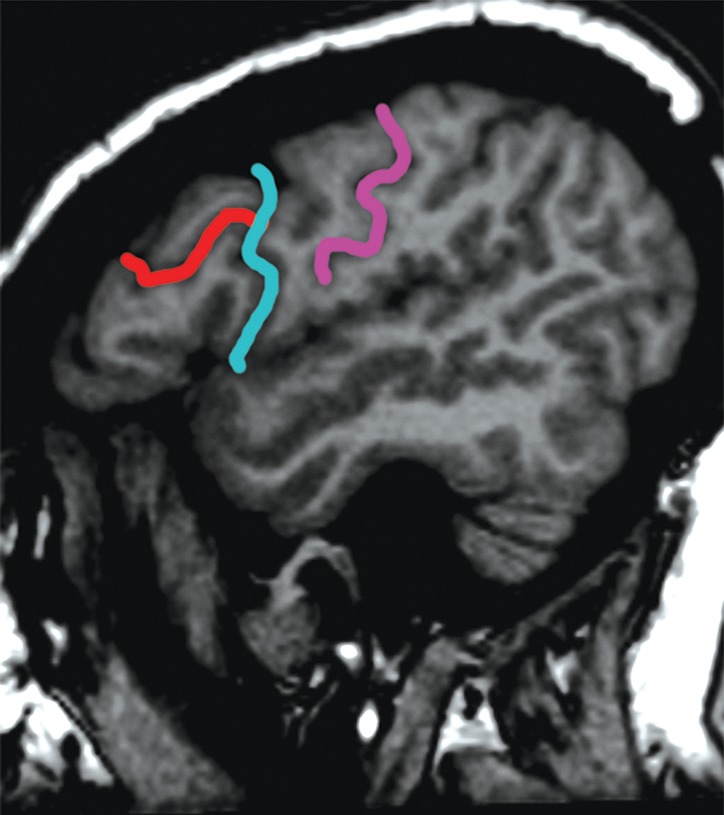
Localization of the precentral sulcus intersections and hand knob. (a) Axial T1-weighted MR image shows the intersection of the superior frontal sulcus (yellow) with the precentral sulcus (blue). The central sulcus (purple) forms an epsilon-shaped hand knob. See Figure 2b and 2c for an example of an omega-shaped hand knob. (b) Parasagittal T1-weighted MR image shows the “hook” sign of the hand knob in the sagittal plane. (c) Parasagittal T1-weighted MR image lateral to b shows the intersection of the inferior frontal sulcus (red) with the precentral sulcus (blue), and the central sulcus (purple) behind it.
Figure 10b.
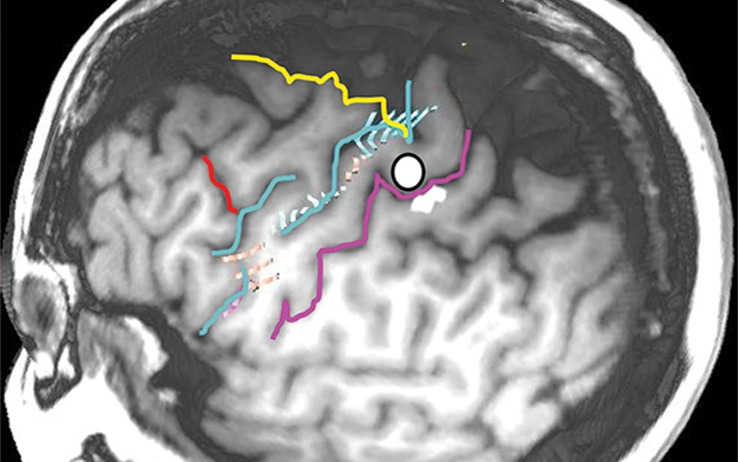
Normal variations in the precentral gyrus (purple shading), demonstrated by confocal volume rendering with an embedded deformable anatomic template of the corticospinal fibers and superimposed functional MR images of a subject performing a right-hand motor task. The fibers appear as dashed lines with color coding corresponding to that in Figure 6. White dot = hand knob, peach shading = potential cortical bridge. (a–c) Images show a single, roughly horizontal, T-shaped gyrus interrupting the precentral sulcus. (d–f) Images show a single interruption in the length of the precentral sulcus. (g–i) Images show two interruptions of the precentral sulcus.
Figure 10c.
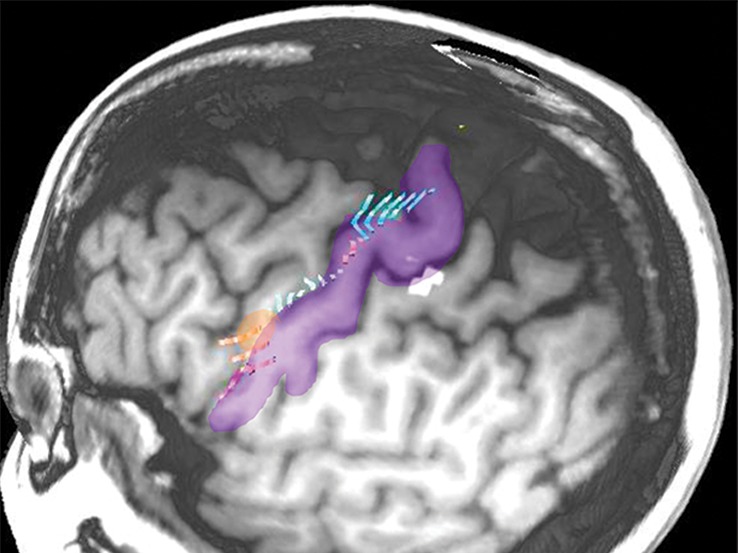
Normal variations in the precentral gyrus (purple shading), demonstrated by confocal volume rendering with an embedded deformable anatomic template of the corticospinal fibers and superimposed functional MR images of a subject performing a right-hand motor task. The fibers appear as dashed lines with color coding corresponding to that in Figure 6. White dot = hand knob, peach shading = potential cortical bridge. (a–c) Images show a single, roughly horizontal, T-shaped gyrus interrupting the precentral sulcus. (d–f) Images show a single interruption in the length of the precentral sulcus. (g–i) Images show two interruptions of the precentral sulcus.
Figure 10d.
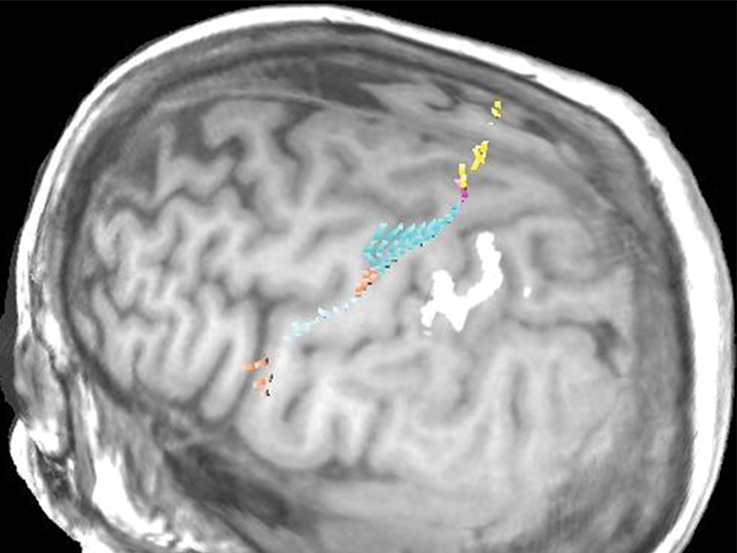
Normal variations in the precentral gyrus (purple shading), demonstrated by confocal volume rendering with an embedded deformable anatomic template of the corticospinal fibers and superimposed functional MR images of a subject performing a right-hand motor task. The fibers appear as dashed lines with color coding corresponding to that in Figure 6. White dot = hand knob, peach shading = potential cortical bridge. (a–c) Images show a single, roughly horizontal, T-shaped gyrus interrupting the precentral sulcus. (d–f) Images show a single interruption in the length of the precentral sulcus. (g–i) Images show two interruptions of the precentral sulcus.
Figure 10e.
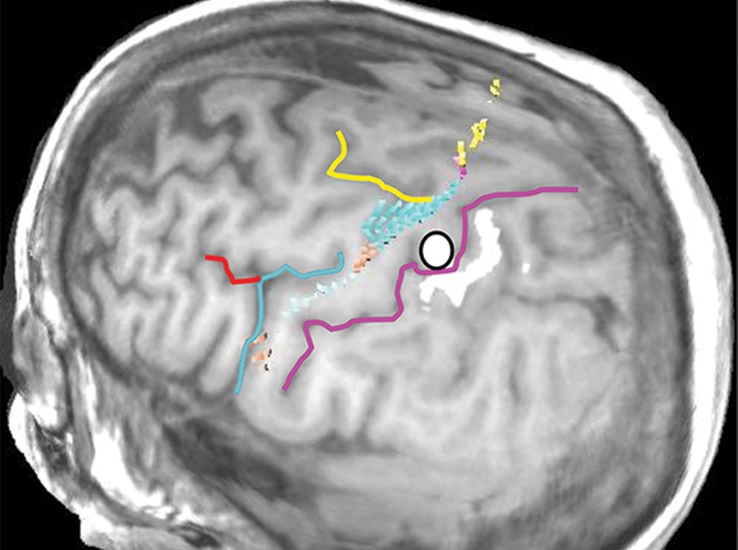
Normal variations in the precentral gyrus (purple shading), demonstrated by confocal volume rendering with an embedded deformable anatomic template of the corticospinal fibers and superimposed functional MR images of a subject performing a right-hand motor task. The fibers appear as dashed lines with color coding corresponding to that in Figure 6. White dot = hand knob, peach shading = potential cortical bridge. (a–c) Images show a single, roughly horizontal, T-shaped gyrus interrupting the precentral sulcus. (d–f) Images show a single interruption in the length of the precentral sulcus. (g–i) Images show two interruptions of the precentral sulcus.
Figure 10f.
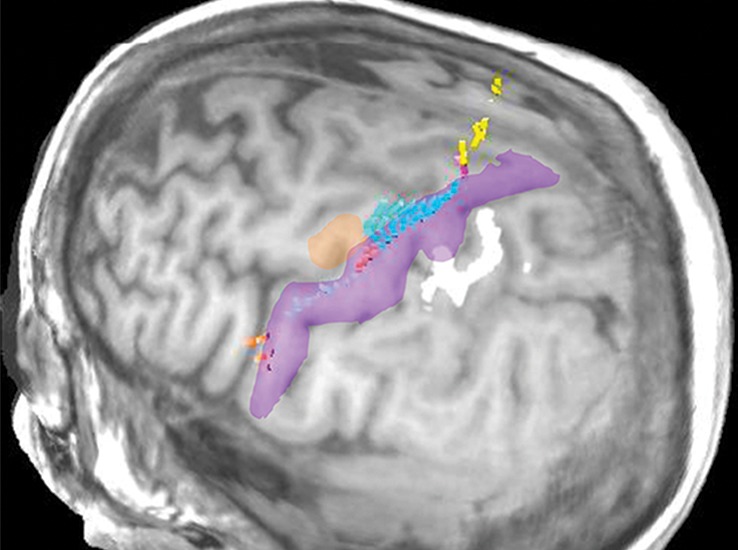
Normal variations in the precentral gyrus (purple shading), demonstrated by confocal volume rendering with an embedded deformable anatomic template of the corticospinal fibers and superimposed functional MR images of a subject performing a right-hand motor task. The fibers appear as dashed lines with color coding corresponding to that in Figure 6. White dot = hand knob, peach shading = potential cortical bridge. (a–c) Images show a single, roughly horizontal, T-shaped gyrus interrupting the precentral sulcus. (d–f) Images show a single interruption in the length of the precentral sulcus. (g–i) Images show two interruptions of the precentral sulcus.
Figure 10g.
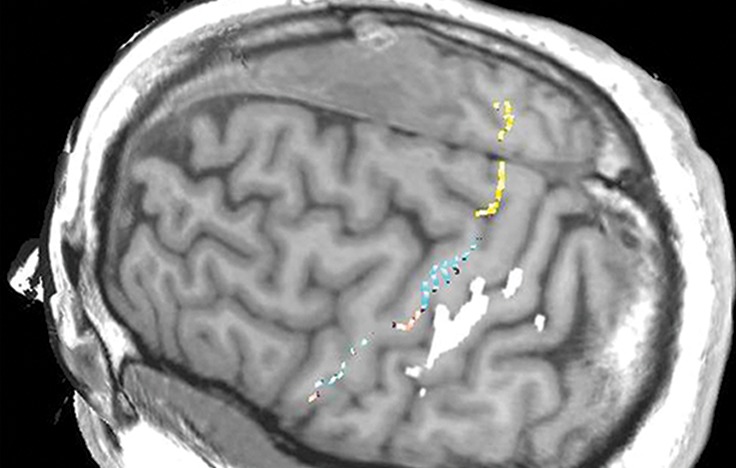
Normal variations in the precentral gyrus (purple shading), demonstrated by confocal volume rendering with an embedded deformable anatomic template of the corticospinal fibers and superimposed functional MR images of a subject performing a right-hand motor task. The fibers appear as dashed lines with color coding corresponding to that in Figure 6. White dot = hand knob, peach shading = potential cortical bridge. (a–c) Images show a single, roughly horizontal, T-shaped gyrus interrupting the precentral sulcus. (d–f) Images show a single interruption in the length of the precentral sulcus. (g–i) Images show two interruptions of the precentral sulcus.
Figure 10h.
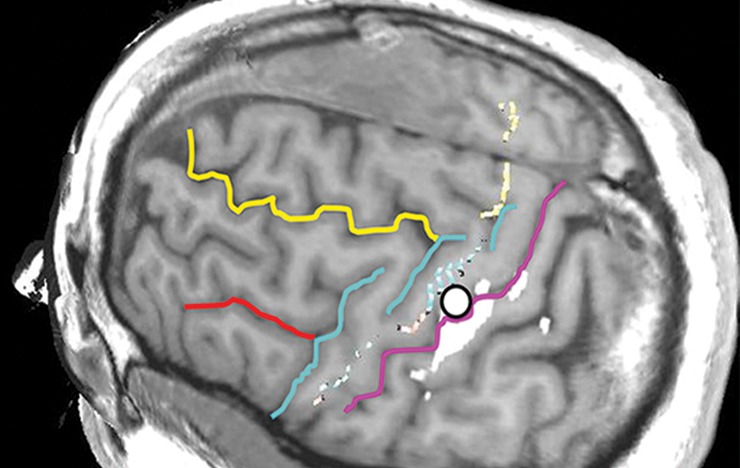
Normal variations in the precentral gyrus (purple shading), demonstrated by confocal volume rendering with an embedded deformable anatomic template of the corticospinal fibers and superimposed functional MR images of a subject performing a right-hand motor task. The fibers appear as dashed lines with color coding corresponding to that in Figure 6. White dot = hand knob, peach shading = potential cortical bridge. (a–c) Images show a single, roughly horizontal, T-shaped gyrus interrupting the precentral sulcus. (d–f) Images show a single interruption in the length of the precentral sulcus. (g–i) Images show two interruptions of the precentral sulcus.
Figure 10i.
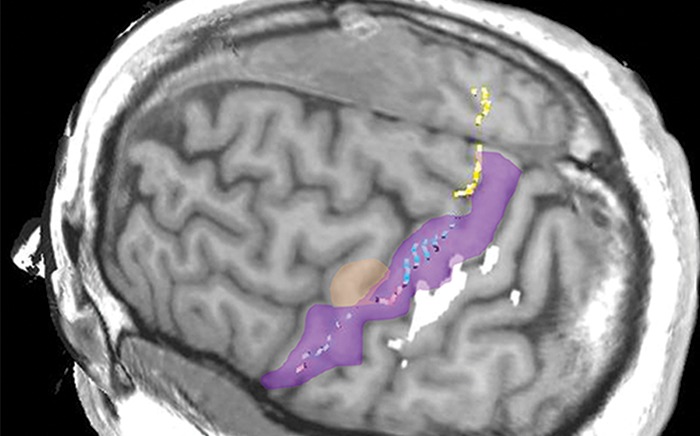
Normal variations in the precentral gyrus (purple shading), demonstrated by confocal volume rendering with an embedded deformable anatomic template of the corticospinal fibers and superimposed functional MR images of a subject performing a right-hand motor task. The fibers appear as dashed lines with color coding corresponding to that in Figure 6. White dot = hand knob, peach shading = potential cortical bridge. (a–c) Images show a single, roughly horizontal, T-shaped gyrus interrupting the precentral sulcus. (d–f) Images show a single interruption in the length of the precentral sulcus. (g–i) Images show two interruptions of the precentral sulcus.
Figure 11b.
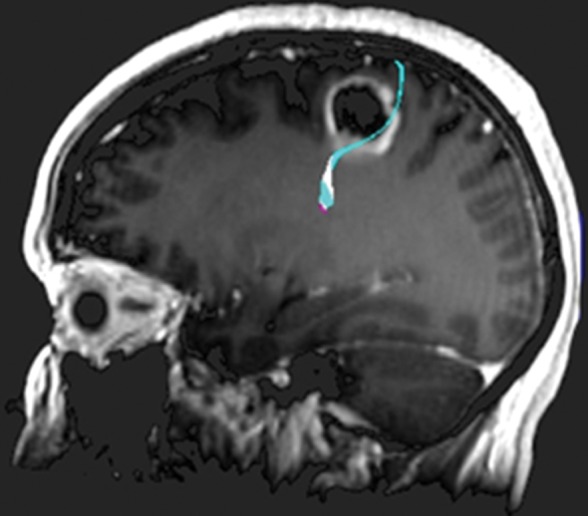
Glioblastoma under the hand knob. A 52-year-old woman noticed left third- and fourth-digit weakness that progressed to complete loss of left-hand function over 4–6 weeks. She was not a good candidate for functional MR imaging because of poor motor function. Diffusion tensor imaging was performed, but the tracts were not well seen. Contrast-enhanced T1-weighted MR images with embedded deformable anatomic template (see Fig 6 for color coding key) are helpful to show the relationship to the motor tract. The atlas-based motor tract was deformed around the glioblastoma to show the possible deviation in the tracts, assuming the tracts were intact. Resection of the rim-enhancing lesion under the hand knob revealed glioblastoma. After surgery, the patient had dense left hemiplegia, which improved slightly over 8 months of physical therapy. (a) Axial contrast-enhanced T1-weighted MR image shows how the tracts may be displaced posterior to the tumor. (b) Sagittal contrast-enhanced T1-weighted MR image shows the manual deformation of the upper extremity tracts and the normal course of the lower face and tongue motor fibers.
Once the central sulcus is identified, it is important to remember that the precentral gyrus is angled 7° forward as it slopes down the side of the hemisphere (20). Thus, the subcortical motor tracts course under the premotor cortex on their way to the posterior limb of the internal capsule.
A note about methods: Figures 10–12 demonstrate confocal volume rendering with an embedded deformable anatomic template with the use of a software program (Anatom-e [Anatom-e Information Systems, Houston, Tex]). The confocal method allows the user to define a “see-through band” on a volume-rendered image (26). For example, the skull can be stripped away over a defined area, so the surface of the brain can be made visible over a specific region. The anatomic template is then anchored to the volume rendering by using the reliable landmarks of the hand knob and central sulcus and is adjusted in size to fit the patient’s anatomy. The anatomic structures in the template (eg, the fan of the corticospinal tracts) can be deformed to account for tumor mass effect (27–29).
Figure 10a.
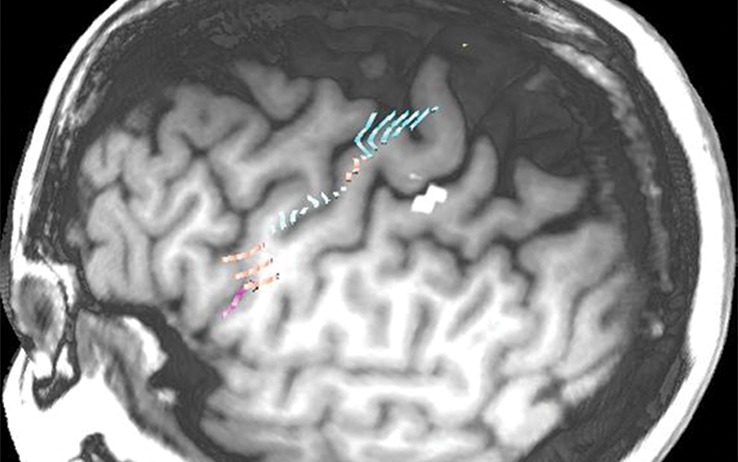
Normal variations in the precentral gyrus (purple shading), demonstrated by confocal volume rendering with an embedded deformable anatomic template of the corticospinal fibers and superimposed functional MR images of a subject performing a right-hand motor task. The fibers appear as dashed lines with color coding corresponding to that in Figure 6. White dot = hand knob, peach shading = potential cortical bridge. (a–c) Images show a single, roughly horizontal, T-shaped gyrus interrupting the precentral sulcus. (d–f) Images show a single interruption in the length of the precentral sulcus. (g–i) Images show two interruptions of the precentral sulcus.
Figure 12a.
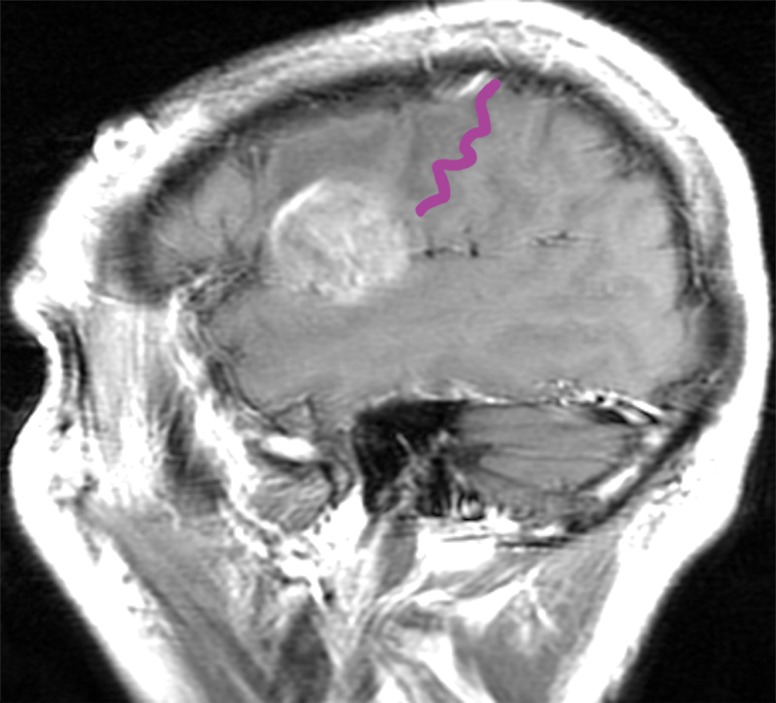
Mass effect causing difficulty in localization. A 52-year-old man presented with slurred speech due to a large left opercular glioblastoma in the lateral part of BA 6. (a) Sagittal unenhanced T1-weighted MR image shows a large glioblastoma, possibly in the primary motor area of the tongue, consistent with the patient’s dysarthria. (b) Confocal volume-rendered MR image with embedded deformable anatomic template of the corticospinal tract (see Fig 6 for color coding key) shows close relationship of the glioblastoma to the tract. No deformation for tumor mass effect was performed. (c) Postoperative sagittal gadolinium-enhanced T1-weighted MR image shows the small surgical cavity in the opercular part of BA 6.
Figure 12b.
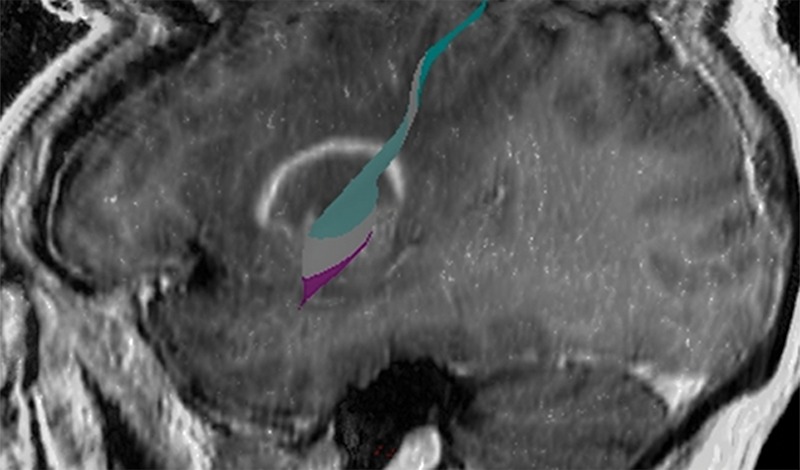
Mass effect causing difficulty in localization. A 52-year-old man presented with slurred speech due to a large left opercular glioblastoma in the lateral part of BA 6. (a) Sagittal unenhanced T1-weighted MR image shows a large glioblastoma, possibly in the primary motor area of the tongue, consistent with the patient’s dysarthria. (b) Confocal volume-rendered MR image with embedded deformable anatomic template of the corticospinal tract (see Fig 6 for color coding key) shows close relationship of the glioblastoma to the tract. No deformation for tumor mass effect was performed. (c) Postoperative sagittal gadolinium-enhanced T1-weighted MR image shows the small surgical cavity in the opercular part of BA 6.
Figure 12c.
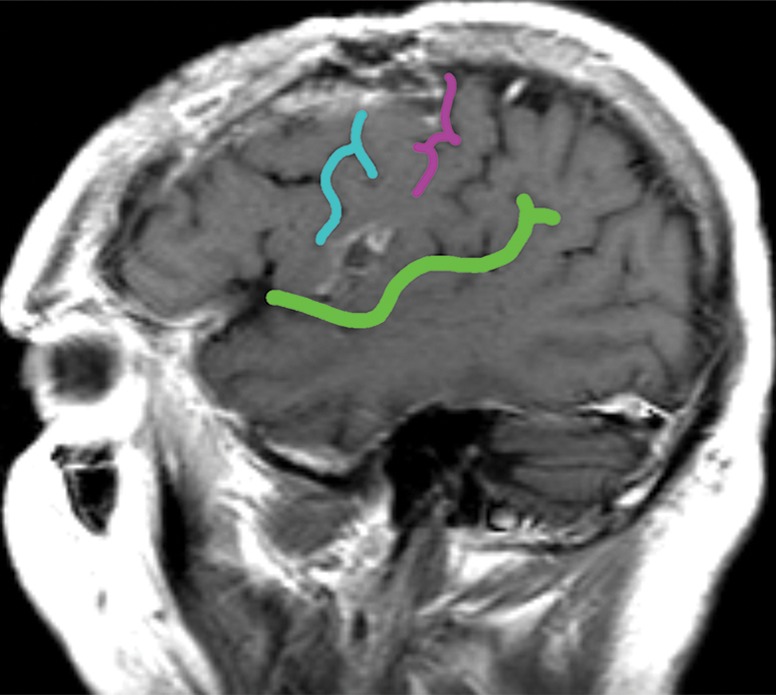
Mass effect causing difficulty in localization. A 52-year-old man presented with slurred speech due to a large left opercular glioblastoma in the lateral part of BA 6. (a) Sagittal unenhanced T1-weighted MR image shows a large glioblastoma, possibly in the primary motor area of the tongue, consistent with the patient’s dysarthria. (b) Confocal volume-rendered MR image with embedded deformable anatomic template of the corticospinal tract (see Fig 6 for color coding key) shows close relationship of the glioblastoma to the tract. No deformation for tumor mass effect was performed. (c) Postoperative sagittal gadolinium-enhanced T1-weighted MR image shows the small surgical cavity in the opercular part of BA 6.
Spread Pattern of Gliomas
The intersections of the precentral sulcus with the superior and inferior frontal sulci are relatively constant, as mentioned in the previous section, but the remainder of the precentral sulcus is often interrupted. The interruptions in the precentral sulcus appear to provide cortical bridges for infiltrating gliomas. Tumors that arise in BA 6 rarely spread posterior to the central sulcus or do so at a late stage in our experience; however, they routinely infiltrate over cortical bridges, thereby creating characteristically shaped tumors in the posterior frontal lobe. We speculate that the depth of the central sulcus presents an obstacle, while the cortical bridges facilitate spread between the superior and middle frontal gyri on one side and the precentral gyrus on the other (Fig 13).
Figure 13a.
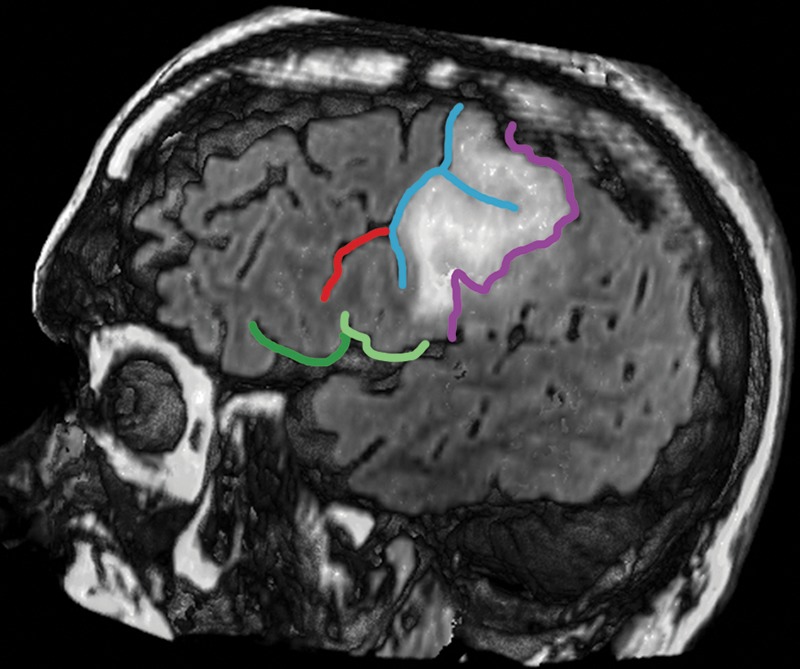
Confocal reconstructions of FLAIR MR images obtained in a 49-year-old man who presented after a grand mal seizure show an infiltrative lesion. Biopsy performed because of motor cortex involvement revealed anaplastic oligodendroglioma. Resection was terminated when intraoperative stimulation produced a contralateral facial seizure. (a) View of the opercular region shows involvement of BA 4 and BA 6 on the expanded precentral gyrus. Dark green = sylvian fissure outlining pars opercularis (BA 44), light green = sylvian fissure outlining pars triangularis (BA 45). (b) View of the posterior middle frontal gyrus shows infiltration of oligodendroglioma over the cortical bridge (peach shading) caused by interruption in the precentral sulcus. White dot = hand knob.
Figure 13b.
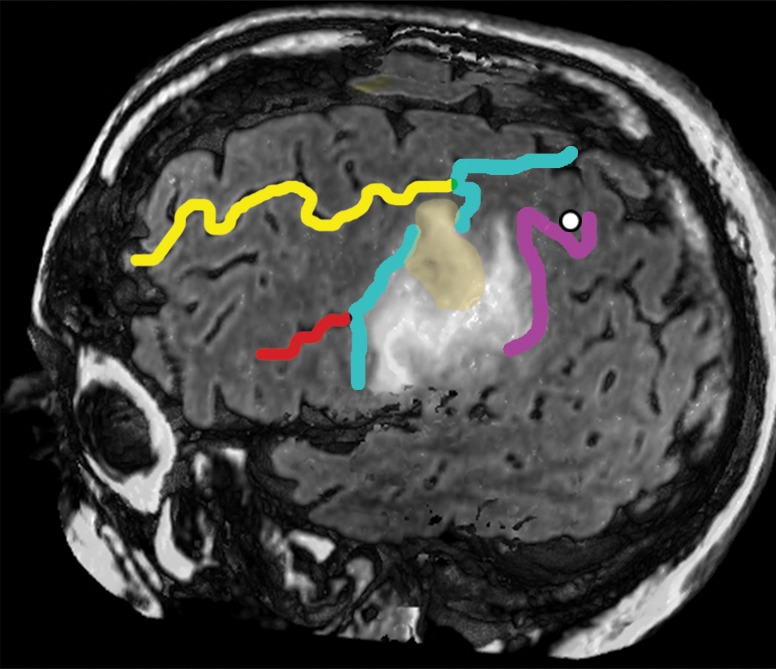
Confocal reconstructions of FLAIR MR images obtained in a 49-year-old man who presented after a grand mal seizure show an infiltrative lesion. Biopsy performed because of motor cortex involvement revealed anaplastic oligodendroglioma. Resection was terminated when intraoperative stimulation produced a contralateral facial seizure. (a) View of the opercular region shows involvement of BA 4 and BA 6 on the expanded precentral gyrus. Dark green = sylvian fissure outlining pars opercularis (BA 44), light green = sylvian fissure outlining pars triangularis (BA 45). (b) View of the posterior middle frontal gyrus shows infiltration of oligodendroglioma over the cortical bridge (peach shading) caused by interruption in the precentral sulcus. White dot = hand knob.
Conclusion
BA 6, which includes the SMA (medial) and premotor cortex (lateral), has important roles in motor function bilaterally and in language on the dominant hemisphere. However, injuries in BA 6 are not as devastating to the patient as injuries to BA 4, the primary motor cortex, which resides in close contact to BA 6. Being able to localize the central sulcus, hand knob, precentral sulcus intersections, cingulate sulcus, and marginal ramus is crucial to preoperative planning. Identification of interruptions in sulci also helps in understanding the observed pattern of glioma infiltration.
Acknowledgments
Acknowledgments
The authors thank David Bier for his original illustrations in Figures 1, 5, and 6 and Kelly Duggan for preparation of the MR images.
Presented as an education exhibit at the 2013 RSNA Annual Meeting.
For this journal-based SA-CME activity, the author L.A.H. has provided disclosures (see “Disclosures of Conflicts of Interest”); all other authors, the editor, and the reviewers have disclosed no relevant relationships.
Funding: The work was supported by the National Cancer Institute [grant number P30CA016672].
Abbreviations:
- BA
- Brodmann area
- FLAIR
- fluid-attenuated inversion recovery
- SMA
- supplementary motor area
Disclosures of Conflicts of Interest.—: L.A.H. Activities related to the present article: medical director and founder of Anatom-e. Activities not related to the present article: disclosed no relevant relationships. Other activities: disclosed no relevant relationships.
References
- 1.Chang EF, Potts MB, Keles GE, et al. Seizure characteristics and control following resection in 332 patients with low-grade gliomas. J Neurosurg 2008;108(2):227–235. [DOI] [PubMed] [Google Scholar]
- 2.Hardesty DA, Sanai N. The value of glioma extent of resection in the modern neurosurgical era. Front Neurol 2012;3:140. [DOI] [PMC free article] [PubMed] [Google Scholar]
- 3.Lacroix M, Abi-Said D, Fourney DR, et al. A multivariate analysis of 416 patients with glioblastoma multiforme: prognosis, extent of resection, and survival. J Neurosurg 2001;95(2):190–198. [DOI] [PubMed] [Google Scholar]
- 4.Ostrom QT, Gittleman H, Farah P, et al. CBTRUS statistical report: primary brain and central nervous system tumors diagnosed in the United States in 2006–2010. Neuro-oncol 2013;15(suppl 2):ii1–ii56. [DOI] [PMC free article] [PubMed] [Google Scholar]
- 5.Brodmann K. Brodmann’s localisation in the cerebral cortex. 3rd ed. New York, NY: Springer, 2006. [Google Scholar]
- 6.Russell SM, Kelly PJ. Incidence and clinical evolution of postoperative deficits after volumetric stereotactic resection of glial neoplasms involving the supplementary motor area. Neurosurgery 2007;61(suppl 1):358–367; discussion 367–368. [DOI] [PubMed] [Google Scholar]
- 7.Fontaine D, Capelle L, Duffau H. Somatotopy of the supplementary motor area: evidence from correlation of the extent of surgical resection with the clinical patterns of deficit. Neurosurgery 2002;50(2):297–303; discussion 303–305. [DOI] [PubMed] [Google Scholar]
- 8.Duffau H, Capelle L, Denvil D, et al. The role of dominant premotor cortex in language: a study using intraoperative functional mapping in awake patients. Neuroimage 2003;20(4):1903–1914. [DOI] [PubMed] [Google Scholar]
- 9.Halsband U, Ito N, Tanji J, Freund HJ. The role of premotor cortex and the supplementary motor area in the temporal control of movement in man. Brain 1993;116(pt 1):243–266. [DOI] [PubMed] [Google Scholar]
- 10.Halsband U, Lange RK. Motor learning in man: a review of functional and clinical studies. J Physiol Paris 2006;99(4–6):414–424. [DOI] [PubMed] [Google Scholar]
- 11.Picard N, Strick PL. Motor areas of the medial wall: a review of their location and functional activation. Cereb Cortex 1996;6(3):342–353. [DOI] [PubMed] [Google Scholar]
- 12.Duffau H. New insights into functional mapping in cerebral tumor surgery. Hauppauge, NY: Nova Science, 2009. [Google Scholar]
- 13.Laplane D, Talairach J, Meininger V, Bancaud J, Orgogozo JM. Clinical consequences of corticectomies involving the supplementary motor area in man. J Neurol Sci 1977;34(3): 301–314. [DOI] [PubMed] [Google Scholar]
- 14.Zentner J, Hufnagel A, Pechstein U, Wolf HK, Schramm J. Functional results after resective procedures involving the supplementary motor area. J Neurosurg 1996;85(4): 542–549. [DOI] [PubMed] [Google Scholar]
- 15.Louis DN, Ohgaki H, Wiestler OD, Cavenee WK, eds. WHO classification of tumours of the central nervous system. 4th ed. Lyon, France: International Agency for Research on Cancer, 2007. [Google Scholar]
- 16.Dziurzynski K, Blas-Boria D, Suki D, et al. Butterfly glioblastomas: a retrospective review and qualitative assessment of outcomes. J Neurooncol 2012;109(3):555–563. [DOI] [PMC free article] [PubMed] [Google Scholar]
- 17.Ono M, Kubik S, Abernathey CD. Atlas of the cerebral sulci. New York, NY: Thieme, 1990; 112–123. [Google Scholar]
- 18.Holodny AI, Watts R, Korneinko VN, et al. Diffusion tensor tractography of the motor white matter tracts in man: current controversies and future directions. Ann N Y Acad Sci 2005;1064:88–97. [DOI] [PubMed] [Google Scholar]
- 19.Bello L, Gambini A, Castellano A, et al. Motor and language DTI fiber tracking combined with intraoperative subcortical mapping for surgical removal of gliomas. Neuroimage 2008;39(1):369–382. [DOI] [PubMed] [Google Scholar]
- 20.Ono M, Kubik S, Abernathey CD. Atlas of the cerebral sulci. New York, NY: Thieme, 1990; 36–61. [Google Scholar]
- 21.Kido DK, LeMay M, Levinson AW, Benson WE. Computed tomographic localization of the precentral gyrus. Radiology 1980;135(2):373–377. [DOI] [PubMed] [Google Scholar]
- 22.Naidich TP, Brightbill TC. The pars marginalis. I. A “bracket” sign for the central sulcus in axial plane CT and MRI. Int J Neuroradiol 1996;2(1):3–19. [Google Scholar]
- 23.Yousry TA, Schmid UD, Alkadhi H, et al. Localization of the motor hand area to a knob on the precentral gyrus: a new landmark. Brain 1997;120(pt 1):141–157. [DOI] [PubMed] [Google Scholar]
- 24.Caulo M, Briganti C, Mattei PA, et al. New morphologic variants of the hand motor cortex as seen with MR imaging in a large study population. AJNR Am J Neuroradiol 2007;28(8):1480–1485. [DOI] [PMC free article] [PubMed] [Google Scholar]
- 25.Fesl G, Moriggl B, Schmid UD, Naidich TP, Herholz K, Yousry TA. Inferior central sulcus: variations of anatomy and function on the example of the motor tongue area. Neuroimage 2003;20(1):601–610. [DOI] [PubMed] [Google Scholar]
- 26.Mullick R, Bryan RN, Butman J. Confocal volume rendering: fast, segmentation free visualization of internal structures. In: Mun SK, ed. Proceedings of SPIE: medical imaging 2000—image display and visualization. Vol 3976. Bellingham, Wash: International Society for Optics and Photonics (SPIE), 2000; 70. [Google Scholar]
- 27.Hamilton JD, Kumar VA, Hayman LA, et al. Deformable anatomic templates embed knowledge into brain images. II. Validation using functional magnetic resonance imaging of the motor hand. J Comput Assist Tomogr 2012;36(2):280–284. [DOI] [PMC free article] [PubMed] [Google Scholar]
- 28.Hayman LA, Kumar VA, Hamilton J, et al. Deformable anatomic templates embed knowledge into patient’s brain images. I. Construction and display. J Comput Assist Tomogr 2012;36(3):354–359. [DOI] [PubMed] [Google Scholar]
- 29.Kumar VA, Hamilton J, Hayman LA, et al. Deformable anatomic templates improve analysis of gliomas with minimal mass effect in eloquent areas. Neurosurgery 2013;73(3):534–542. [DOI] [PubMed] [Google Scholar]


