

Abstract
Cryptochromes (CRYs) are widespread flavoproteins with homology to photolyases (PHRs), a class of blue-light-activated DNA repair enzymes. Unlike PHRs, both plant and animal CRYs have a C-terminal domain. This cryptochrome C-terminal (CCT) domain mediates interactions with other proteins, while the PHR-like domain converts light energy into a signal via reduction and radical formation of the flavin adenine dinucleotide cofactor. However, the mechanism by which the PHR-like domain regulates the CCT domain is not known. Here, we applied the pulsed-laser-induced transient grating method to detect conformational changes induced by blue-light excitation of full-length Arabidopsis thaliana cryptochrome 1 (AtCRY1). A significant reduction in the diffusion coefficient of AtCRY1 was observed upon photoexcitation, indicating that a large conformational change occurs in this monomeric protein. AtCRY1 containing a single mutation (W324F) that abolishes an intra-protein electron transfer cascade did not exhibit this conformational change. Moreover, the conformational change was much reduced in protein lacking the CCT domain. Thus, we conclude that the observed large conformational changes triggered by light excitation of the PHR-like domain result from C-terminal domain rearrangement. This interdomain modulation would be critical for CRYs’ ability to transduce a bluelight signal into altered protein–protein interactions for biological activity. Lastly, we demonstrate that the transient grating technique provides a powerful method for the direct observation and understanding of photoreceptor dynamics.
Keywords: blue-light receptor, flavin, photoreduction, diffusion, conformational dynamics
Introduction
Cryptochromes (CRYs) are flavoproteins found in all kingdoms of life: plants,1,2 animals,3-5 and bacteria.6 CRYs share amino acid sequence similarities, a common structural fold and the non-covalently bound flavin adenine dinucleotide (FAD) cofactor with DNA photolyase (PHR) enzymes, which catalyze the light-dependent repair of UV-damaged DNA. CRYs have little or no DNA repair activity7 but instead control a wide variety of life activities:1,8,9 light-dependent growth and development in plants, the circadian clock in animals, and sensitivity to the magnetic field (light-dependent magnetoreceptor) in flies.5
Among plant CRYs, Arabidopsis thaliana cryptochrome 1 (AtCRY1) has been most extensively studied,1,2,10-15 while recent publications expand the fundamental knowledge about the others such as A. thaliana CRY 216 or algal CRY.17 AtCRY1 regulates many aspects of photomorphogenesis.1,2,18 Plant CRYs, represented by AtCRY1, contain not only the N-terminal PHR-like domain (ca 500 amino acids) but also an additional characteristic cryptochrome Cterminal (CCT) domain.1,2 While the crystal structure of the PHR-like domain of AtCRY1 has been reported,10 the isolated CCT domain was found to be unstructured by NMR analysis.11 For plant CRYs, the CCT domain plays an important functional role; genetic and physiological analysis of truncated forms of CRYs has demonstrated that the CCT domain mediates signal transduction by interaction with protein partners and can function in isolation when fused to a reporter gene.12,13 The mechanism and kinetics for CRY signal transduction from the light excitation of FAD in the N-terminal PHR-like domain to protein–protein interactions of the CCT domain remain central unanswered questions.
For CRY signaling, the FAD-containing PHR-like domain most likely initiates light signal conversion through the cofactor, regulating the activity of CCT domain in a light-dependent manner.12,13 Transient absorption (TA)14 and Fourier transform infrared (FTIR)15 studies on AtCRY1 in vitro have both revealed that light-induced intra-protein electron transfer from an aromatic residue (Trp or Tyr) to the chromophore takes place during formation of the FAD radical (FADH·), which has been shown to be the signaling state in plant CRYs,16,19 following photoexcitation of oxidized flavin. This electron transfer is presumed to take place within the PHRlike domain of CRYs by analogy with that during photoactivation [photoreduction, not photoreactivation (DNA repair)] reaction of Escherichia coli DNA PHR.20 Subsequent to light absorption and flavin reduction, additional changes in the protein have been probed by FTIR and partial proteolysis experiments, which suggested the possibility of light-dependent conformational rearrangement of AtCRY1.11,15 However, the conformational changes observed by FTIR are relatively weak and have not been well assigned.15 Similarly, indirect proteolysis analysis11 showed only minor effects and gave poor information in time resolution. Therefore, the nature and reaction kinetics for the overall signal transduction process associated with plant CRYs, including potential rearrangement of the CCT domain, still remain unclear.
It is essential to monitor time-resolved changes in protein conformation and/or intermolecular interactions to reveal the kinetics and mechanism of signal transduction in AtCRY1. To date, the TA method has been one of the main techniques to monitor reaction kinetics of photoreceptor proteins. However, because structural changes affecting absorption are generally localized to the vicinity of the chromophore, this method is not suitable for monitoring the conformational changes elsewhere in the protein. To observe time-resolved conformational dynamics throughout the protein, we complemented TA with time-resolved detection of changes in diffusion by the pulsed-laser-induced transient grating (TG) technique.21-29 The unique advantage of this method is its possibility to detect changes in molecular diffusion coefficients (D) during chemical reactions with a very short time resolution. D is a valuable and important physical property to characterize a molecule in solution. This value is sensitive to not only the protein conformational changes but also intermolecular interaction between the protein and the solvent. If the friction between the diffusing protein and the solvent molecules increases, D should decrease. In fact, it was reported that D of a protein molecule in the aqueous solution is largely decreased upon the unfolding.21 Therefore, time-resolved measurement of D by the TG technique provides a powerful way to study the kinetics of both spectrally active and spectrally silent changes in molecular conformation and/or intermolecular interactions. Conformation changes observed by the TG method so far are consistent with results from other methods, and kinetics of the changes have been revealed by this method, for example, N-terminal helix unfolding of photoactive yellow protein22 [consistent with circular dichroism (CD) study30], N-terminal helix formation of phytochrome23 (consistent with the time-resolved CD data31), Jα-helix unfolding of the linker region of phototropins LOV2 domain24,25 (consistent with CD32 and NMR33 experiments), and so on. These previous studies support the validity of the TG method.
In this study, we investigated the photochemical reactions of full-length AtCRY1 using the TG method. We successfully detected large conformational change in full-length AtCRY1 as the change in D and determined its kinetics. This D-change was not observed in the AtCRY1 W324F mutant protein carrying a single mutation in the Trp triad of the N-terminal PHR-like domain. We also found that the conformational change in truncated AtCRY1 lacking the CCT domain is very small. These observations clearly indicate that both the PHR-like and the CCT domains are responsible for the overall conformational change in plant CRYs. Thus, light-dependent modulation between these two domains would likely be critical for activation of the receptor and subsequent biological activity by CRYs.
Results and Discussion
Detection of conformational change in full-length AtCRY1
The TG signal of the full-length AtCRY1 was measured in buffer solution at 12 °C at a protein concentration of 80 μM, and the signal at a grating wavenumber of q2 = 4.1 × 10¹¹ m−2 is depicted in Figure 1a. In principle, the TG signal intensity is proportional to the square of the photo-induced refractive index change (δn), which mainly derives from thermal energy releasing (thermal grating) and the creation and depletion of the chemical species (species grating).34-35 The observed TG signal (Fig. 1a) mainly consisted of two components; after the pulsed laser light irradiation, the TG signal quickly rose followed by a decay to the baseline within a few microseconds and then by a rise–decay profile in the hundred-millisecond time range. If the kinetics of the signal depend on grating wavenumbers (q2), this phase should be attributed to a diffusion process. If not, it should be due to reaction kinetics. For the assignment of the signal components, the TG signals of the AtCRY1 sample were measured at various q2 (Fig. 1b). The rate of the initial decay indeed depended on q2 (Fig. 1b, inset). The dependence indicates that this phase represents diffusion process, not reaction kinetics. Furthermore, the profile was expressed by an exponential function, and the rate constant agreed well with the rate of the thermal diffusion Dthq2 (Dth, thermal diffusivity), which was determined independently from the TG signal of the calorimetric reference sample (bromocresol purple) under the same condition. Hence, this initial decay component was clearly attributed to the thermal grating signal [δnth(t)].
| (1) |
where the δnth is the initial refractive index change in the thermal grating signal. The timescales of the last rise–decay curve are also q2 dependent (Fig. 1b). This phase indicates a protein diffusion process [diffusion signal, δnP(t)−δnR(t)], which reflects the decay process of the species grating signal due to the reactant (δnR) and product (δnP) by their diffusion processes. If we ignore the time dependence of the molecular diffusion coefficient D, the diffusion signal should be expressed as a following biexponential function.37,38
| (2) |
where DR and DP are the molecular diffusion coefficients of the reactant and product, respectively. The rise–decay feature of the observed diffusion signal indicates two diffusion components having opposite signs of δn [Eq. (2)]. Because the thermal grating signal had decayed to the baseline before the appearance of the diffusion signal and the sign of δnth is negative at this temperature, the signs of δn for the rise and decay components were unambiguously determined to be negative and positive, respectively. The rate of the rise component is faster than that of the decay component, indicating that D was decreased by the photoreaction. D is a physical property that reflects not only the molecular size but also the intermolecular interactions including the large conformational rearrangement. The significant reduction in D following photoexcitation will be discussed later.
Fig. 1.

(a) TG signal of the full-length AtCRY1 after blue-light excitation at 465 nm in the buffer solution containing 50 mM Tris, 500 mM NaCl, and 30% glycerol (pH 7.5) at q2 = 4.1 × 10¹¹ m−2 at the excitation wavelength of 465 nm (red line). The signal was measured at a concentration of 80 μM, at 12 °C, and at an excitation laser power of ~10 μJ. (inset) Magnification of the signal in the time region of 2 μs to 40 ms. (b). TG signals of full-length AtCRY1 at various q2 values: 4.1 × 10¹¹ m−2 (red), 1.9 × 10¹¹ m−2 (orange), 7.3 × 10¹⁰ m−2 (green), and 3.5 × 10¹⁰ m−2 (blue). Signals were normalized by thermal grating intensity. (c) Magnification of (b) in the time region of 100 μs to 150 ms. The q2-independent decay components were observed in the millisecond time range (arrows). These components indicate reaction kinetics (absorption changes). The black broken curves in these figures show the best fitted curves by Eq. (4).
What are the kinetics of this D-change? The kinetics can be obtained from the q2 dependence of the signal. In Fig. 1b, the TG signals are normalized by the thermal grating intensity, which is a measure of the concentration of photoexcited molecules. If the D-change completes before the timescale of the diffusion signal, the diffusion signal should not depend on q2. Contrary to this, the diffusion signal in a fast timescale is weak, and its intensity dramatically increased at longer time (Fig. 1b). This time dependence of the diffusion signal implies that the D-change reaction of AtCRY1 took place within this observation time. Qualitatively, this change can be explained as follows: when the protein diffusion rate (Dq2) is more rapid than its rate of D-change reaction (i.e., under a large q2 condition), the diffusion coefficients of the reactant and product are similar, and the diffusion signal should be weak, due to the cancellation of refractive index changes in the product and the reactant (δnP and δnR, respectively) of Eq. (2). With decreasing q2, the diffusion signal appeared in a longer time region, and DP also decreases significantly. Hence, the diffusion signal intensity increased with decreasing q2. A similar time-dependent feature of the diffusion signal was observed previously for other photosensor proteins,24-29 and the time dependence was analyzed by the following two-state model.37,38
| (3) |
where R, I, P, and k represent the reactant, an initial product (intermediate), the final product, and the rate constant of the change, respectively. Furthermore, δnI and DI are the refractive index changes due to the creation of the I species and the diffusion coefficient of the intermediate, respectively.
The diffusion signals for AtCRY1 were analyzed by the time-dependent model above. We first determined DR and DP, respectively, from the diffusion signal in the smallest q2, that is, in the long timescale where the D-change reaction should be almost completed. We fitted the slower part (>2 s) of the diffusion signal at the smallest q2 by a bi-exponential function to obtain DR = 1.46 (±0.05) × 10−11 m2 s−1 and DP = 0.62 (±0.03) × 10−11 m2 s−1. Through the use of these values and DI = DR, the observed TGsignals at all q2 can be reproduced well based on Eq. (3). The time constant (k−1) for the D-change was determined to be k−1 = 0.4 (±0.1) s.
Between the timescales for the thermal grating and diffusion signals, another weak species grating signal was observed (Fig. 1c, arrows). The precise determination of its rate constant was difficult because of the interference from the thermal grating and the diffusion signal contributions. We analyzed this weak species grating component as follows. The total TG signal of AtCRY1 should be fitted by the following equation, which includes thermal grating contribution δnth(t), protein diffusion contribution δnP(t)−δnR(t), and weak species grating contributions.
| (4) |
The thermal and molecular diffusion contributions are given by Eqs. (1) and (3), respectively. Additional exponential terms were added to the equation to reproduce weak species grating contributions. We conducted single-exponential and biexponential analyses for the species grating signal [Eq. (4) with i=1 and i=2]. Figure 2 depicts the fitting results by single-exponential (continuous curve) and bi-exponential (broken curve) fitting. During the fitting process, we used Dthq2 determined by the decay rate of the signal of the calorimetric reference sample. We also used the parameters for the protein diffusion terms, which were determined in the diffusion signal analysis above. Apparently, the signal was reproduced well in the bi-exponential analysis. We could determine the time constants of 1 ms and 7.5 ms for this weak species signal. According to the previous TA studies,14 absorption changes showed the creation of the radical form of AtCRY1 after the photoexcitation. Following radical formation, a 1-ms phase (lifetime of 1.4 ms) was observed and attributed to the intra-protein electron transfer from Trp· to Tyr. Therefore, the 1-ms dynamics observed by the TG method are attributed to the population grating signal reflecting the absorption change involved in this electron transfer reaction. This flavin radical observed by TA returned to the original ground state with half lifetimes of 5 ms and >100 ms (corresponding to time constants of 7.2 ms and >140 ms). Therefore, we attributed the 7.5-ms dynamics observed in the TG signal to this dark reversion process of the chromophore from the radical form to the ground state. (In the present study, the phase of >100 ms was not observed probably because this component was masked by the strong diffusion signal.) The fact that these time constants are similar to those reported in previous study14 clearly indicates that the full-length AtCRY1 sample was stable and exhibited a proper photoreaction under our experimental conditions. Remarkably, even after the 7.5-ms decay, the TG signal did not disappear but showed the strong diffusion signal. This fact indicates that the light-induced conformational changes in the protein were retained even after the recovery of the chromophore.
Fig. 2.
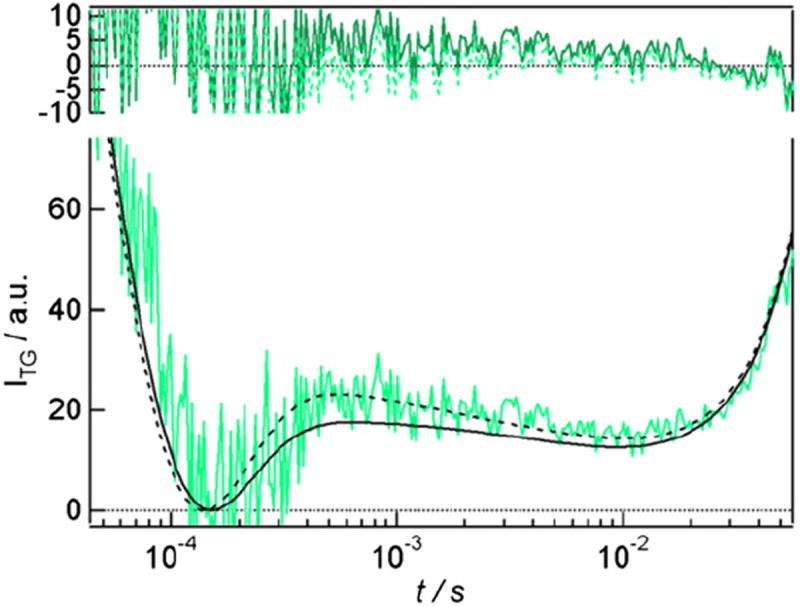
The comparison of single-exponential (black continuous curve) and bi-exponential (black broken curve) analyses for the weak species grating components observed in the TG signal of full-length AtCRY1 at q2 = 7.3 × 10¹⁰ m−2. Residual errors are also shown in the figure top by dark-green continuous curve (singleexponential analysis) and green broken curve (biexponential analysis).
Assignment of origin of the molecular diffusion coefficient change in AtCRY1
To date, reported photo-induced decreases in molecular diffusion coefficient D of photosensor proteins have been classified as originating from either oligomer formation27-29 or conformational change.24-26 Those are referred as diffusionsensitive conformation change (DSCC). It seems rather straightforward to conclude that an oligomarization reaction of AtCRY1 might cause the D reduction upon photoreaction because, according to the Stokes–Einstein relationship, D is inversely proportional to the radius of a molecule. If the difference in D between the reactant and the product (DP/DR = 2.3) was interpreted only in terms of the difference in molecular radius, the molecular volume of the product would be (2.3)3 = 12 times larger than that of the reactant. (Although D-value depends on the shape of molecule, the dependence is rather weak according to the theoretical equation for the molecule with a nonspherical shape.39) However, D is determined not only by the molecular size but also by the intermolecular interaction between the protein and the solvent molecules; therefore, an increase in protein/solvent intermolecular interaction must be also taken into account. If protein conformational changes produce an increase in protein/solvent intermolecular interactions, then D would be reduced too. The concentration dependence of the signal profile should be examined to distinguish between these two possibilities. If this Dchange is caused by oligomer formation, the reaction rate for the D-change would be sensitive to protein concentration, and this should result in a concentration-dependent time profile of the signal. Photosensor proteins, BLUF (sensors of blue light using FAD) domains of AppA, YcgF, and LOV2 (light oxygen voltage sensing) domains of phototropins all exhibit concentration-dependent TG signals.27-29 In contrast, if intramolecular protein conformational change is directly responsible for the D-change, this reaction rate should be independent of the protein concentration, and the time profile of the TG signal should not depend on the concentration, except for the absolute intensity.
Therefore, we examined the TG signal at various sample concentrations under relatively large q2 condition (4.3 × 10¹¹ m−2) (Fig. 3a and b). At this grating wavenumber, the diffusion signal appears in several 100-ms time range, which covers the D-change (<1 s). Hence, if the rate of the D-change depends on the concentration, the profile of the signal should be sensitive to the concentration. Figure 3a depicts the concentration dependence of the TG signal. Naturally, the signal intensity decreased with decreasing concentration. However, the time profile normalized at the peak intensity did not depend on the concentration except for a small temporal shift. (This shift could be due to a viscosity change by the dilution of the solution.) Indeed, by fitting the present signalswith the present model, we determined that DP and DR increased slightly with decreasing the concentration of the protein (DR = 1.46 × 10⁻¹¹ m2 s−1 and DP = 0.62 × 10⁻¹¹ m2 s−1 at 80 μM and DR = 1.59 × 10⁻¹¹ m2 s−1 and DP = 0.68 × 10⁻¹¹ m2 s−1 at 39 μM), but the rate constant for the D-change reaction did not change. Since the rate constant is concentration independent, the origin of D-change is due to a significant and large conformational change in AtCRY1 protein rather than light-dependent aggregation or oligomerization.
Fig. 3.
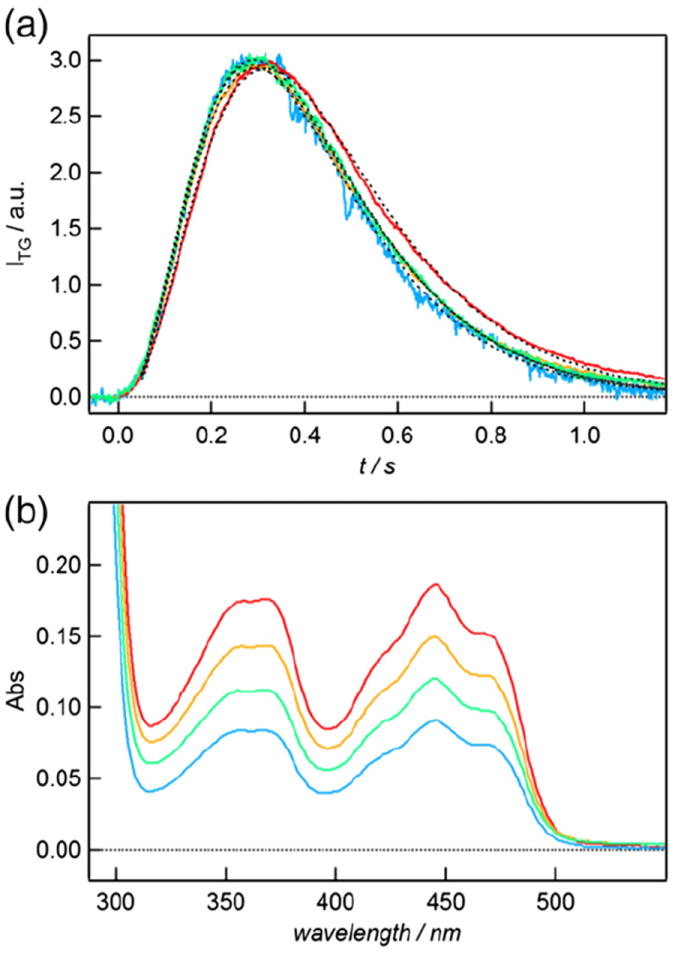
(a) TG signals for the full-length AtCRY1 at protein concentrations of 80 μM (red), 64 μM (orange), 50 μM (green), and 39 μM (blue) at q2 = 4.3 × 10¹¹ m−2. The TG signals were normalized by the diffusion peak. (b) AtCRY1 absorption spectra at matching concentrations.
Furthermore, this large D-change cannot be explained by only one or two hydrogen bond rearrangements between protein residues and water because of the following reason. Previously, we estimated an increase in the excess friction by unfolding of α-helix to be 0.3 × 10⁻¹² kg/s.40 [Here, the friction coefficient of species i is defined by fi = kBT/Di (i=P or R), where kB is the Boltzmann constant and T is the temperature. The change in the friction Δf upon the transformation from the reactant to the product is calculated by Δf = fP−fR.] In the present AtCRY1 case, the increase in friction was calculated to be 3.75 × 10⁻¹⁰ kg/s. This value is very large. If Δf of photoactive yellow protein40 is used and only unfolding occurs for this conformation change, this increase means that about 100 residues are exposed to the buffer. Although this number is just a rough estimation of the extent of the conformation change, the significant reduction in D observed here, at least, implies that a large conformational rearrangement occurs after photoexcitation of AtCRY1.
Photoreduction-induced conformational change in AtCRY1
All structurally characterized members of the CRY/PHR family including AtCRY1 conserve a common motif consisting of a chain of three Trp residues extending from the FAD cofactor to the protein surface.6,20,41 In E. coli PHR, this Trp chain is responsible for electron transfer to FAD during photoactivation (photoreduction of the oxidized form of PHR). After a single photo-induced electron transfer step from a nearby Trp reduces the FAD, the resulting radical state on the Trp is subsequently transferred to the terminal Trp (Trp306 in E. coli PHR). Because of the high structural conservation, a similar electron transfer mechanism has been assumed for CRYs.6,14,42 TA and FTIR studies on AtCRY1 also suggested the involvement of an aromatic residue (Trp or Tyr) in the photoexcitation reaction.14,15 To decipher correlations between electron transfer and the observed conformational change, we made TG measurements for an AtCRY1 mutant (W324F) lacking the terminal surfaceexposed Trp residue of the proposed electron transfer pathway (Fig. 4). The W324F mutant shows almost the same absorption spectrum as wild-type protein but shows no light-induced absorption change, indicating that the mutant has no photoreduction reactions.43 For the W324F mutant, we detected no diffusion signal, although the thermal grating signals for the mutant and the wild-type were similar. These results indicate that the D-change reaction is likely linked to the electron transfer event in AtCRY1. Thus, the conformational change observed in the full-length wild-type protein is triggered in the N-terminal PHR-like domain.
Fig. 4.

TG signal of the wild-type full-length AtCry1 (black), the CCT domain truncated AtCry1 (blue), and W324F mutant (red) of full-length AtCry1 at q2 = 2.3 × 10¹² m−2 under the same experimental conditions. The signals were measured at protein concentrations of 50 μM, at 12 °C.
Contribution of the CCT domain to the conformational change
CRY proteins are generally larger than PHRs, due to C-terminal extension of their sequences. In particular, plant CRYs have an additional characteristic C-terminal domain, named the CCT domain. The plant CCT domains have been implicated in signal transduction and shown to function as a scaffold for other proteins.12,13 NMR studies coupled with proteolysis indirectly suggested that some conformational change occurs in the CCT domain upon light irradiation.11 To directly examine and distinguish light-induced conformational changes in the N- and C-terminal domains of AtCRY1, we measured TG signals of truncated AtCRY1 protein lacking the CCT domain (trAt-CRY1) under the same experimental conditions as full-length AtCRY1 (Fig. 4). In contrast to the fulllength protein, which shows the characteristic large diffusion signal, trAtCRY1 does not show this component, but only a very weak diffusion signal. These observations implicate that the major component of the DSCC in AtCRY1 is derived from the CCT domain.
Through the use of a binding assay coupled with proteolysis for AtCRY1, the PHR-like domain was shown to interact with the CCT domain in the dark, inducing stable tertiary structure in the C-terminal domain.11 This interaction was destabilized in the light due to some conformational change in the CCT domain.11 We have reproduced these proteolysis experiments using a slightly modified protocol using the current AtCRY1 sample and a highintensity blue-light-emitting diode to promote greater photoreduction (Fig. 5). Arrows indicate bands that are differentially sensitive to proteolysis in dark- and light-treated samples. At earlier time points, the upper indicated band is significantly more stable in dark as compared to light samples even after double the time of digestion, consistent with previous reports.11 At longer digestion times, lower bands appear in the dark sample but not in the irradiated sample, indicative of further differential cleavage in the digestion products. This differential resistance to proteolysis in light and dark samples indicates considerable changes in protein surface properties and susceptibility to cleavage as a result of irradiation, indicating that the light-induced structural changes are likely to be quite large. Furthermore, a proteolysis experiment for trAtCRY1 did not show any significant difference between dark and light-illuminated samples (data not shown). Taken together, these results confirm the large conformational change directly observed by the TG method and are all consistent with the following interpretation; in the dark, inter-domain interactions between the PHR-like and the CCT domains produce a relatively packed overall structure. Light excitation and reduction of FAD in the Nterminal PHR-like domain would affect the adjacent Trp triad and could propagate to the interface between the PHR-like and the CCT domains, resulting in their dissociation. This dissociation would increase the surface area between AtCRY1 and the solvent, producing a D-value reduction, and simultaneously would expose interaction sites for other molecules, thereby activating signals in the photomorphogenesis pathways. The conformational changes in the CCT domain have been suggested to be important for a long time.12 However, there has been no information on the dynamics of the proposed conformational changes. Here, our timeresolved measurement revealed not only the existence of the conformational change in the CCT domain but also the rate of the conformational change for the first time.
Fig. 5.

Partial proteolysis of the full-length AtCRY1 under dark (left) and light (right) conditions. The bands showing differential proteolysis are indicated (arrows). The topmost band is less stable subsequent to illumination.
Interestingly, a weak diffusion signal with a small D-change was observed in trAtCRY1 lacking the CCT domain (Fig. 4b, blue). The observation is consistent with a small conformational change in the vicinity of the FAD binding site, as previously observed by vibrational spectral analysis.15 TG signals are sensitive to both spectral changes and conformational changes that are spectrally silent. Therefore, the relatively large DSCC observed here is not conflicted with the conclusions from FTIR studies 15 because the diffusion coefficient monitored by TG techniques would be sensitive to dissociation of the PHR-like and CCT domains. We propose that PHRs undergo relatively small conformational changes upon light illumination, whereas CRYs have evolved their C-terminal extensions to increase dynamics for signaling. The schematic illustrations of the possible reactions are shown in Fig. 6.
Fig. 6.

The schematic illustrations of the proposed photoreaction of AtCRY1. In the dark, AtCRY1 takes a relatively compact structure by inter-domain interactions. Blue light induces the reduction of FAD chromophore to the radical form (FADH·) through the intra-protein electron transfer from the conserved tryptophan triad.14 The change in the PHR-like domain could propagate to the interface between the PHR-like and the CCT domains, resulting in their dissociation. This dissociation would increase the surface area (colored pink) between AtCRY1 and the solvent, producing a reduction in the molecular diffusion coefficient and the protein stability to the protease. This simultaneously would expose interaction sites for other molecules, thereby activating signals in the photomorphogenesis pathways.
Conclusions
This work for the first time demonstrates a significant light-dependent conformational change in a CRY that may provide the basis for signaling. Although the suggestion that conformational changes in CRYs may provide a mechanism for signaling has been made since many years,41 direct experimental evidence for such a dynamic transformation has been missing. Here, we report a significant conformational change in full-length AtCRY1 that is dependent on light activation of the N-terminal PHR-like domain through flavin reduction by intra-protein electron transfer involving conserved Trp residues. We further show that the CCT domain is critical to this conformational change subsequent to the initial light activation event. We propose that electron transfer from the flavin chromophore triggers the dissociation between the CCT and the PHR-like domains in the protein, which are connected to each other to form a stable tertiary structure by inter-domain interaction in the dark state. This dissociation leads to exposure of the previously buried interfaces and the consequent increase in interaction between AtCRY1 and solvent, resulting in the observed large D-change. These events associated with light-induced conformational changes most likely represent essential processes that underlie AtCRY1 signaling in plants.
Materials and Methods
Measurement
The experimental setup for the TG experiment was similar to conditions reported for other photoreceptors in previous papers.44,45 For excitation of AtCRY1, a XeCl excimer laser-pumped dye laser beam (Lamda Physik Compex 102xc, Lumonics Hyper Dye 300; λ = 465 nm) was used. The time resolution of the instrument was ~20 ns. The laser beam was split into two by a beam splitter and crossed inside a quartz sample cell (optical path length = 2 mm). The spot size of the excitation beams at the sample position was ca 1-mm diameter. The created refractive index modulation in the sample was probed by a diode laser (835 nm) as a Bragg diffracted signal (TG signal). The TG signal was detected by a photomultiplier tube (Hamamatsu R1477) and fed into a digital oscilloscope (Tetronix 2430A). The TG signals were transferred to a microcomputer and averaged 6–36 pulse to improve a signal-to-noise (S/N) ratio. After every shot of the excitation pulse, the sample solution (200 μL) was stirred so that the photoproduct was not excited again. The grating wavenumber (q2) was determined with the decay rate of the thermal grating signal of a calorimetric reference solution, bromocresol purple, which gives rise to only the thermal grating signal due to the nonradiative transition within the pulse width of the excitation laser. The various grating numbers were adjusted by changing the crossing angle of the excitation pulses and the probe beam. All measurements were carried out at room temperature (12 °C).
In the proteolysis measurement, samples were 100 μL of 10 μM AtCRY1 in 50 mM Tris (pH 7.5), 10 mM DTT, 20% glycerol, and 2 μM trypsin placed in a 1 mm × 10 mm glass cuvette. Under the blue-light condition, samples were irradiated on ice by a blue-light-emitting diode at 150 mmol m2 s− 1 through an infrared light cut filter to eliminate heating effects, and temperature was continuously checked in the immediate vicinity of the cuvette throughout the whole course of the experiment. A 10-min pre-irradiation was carried out before the addition of trypsin (T0). Aliquots were removed at T0 (before addition of trypsin), 0, 5, 10, 15, 20, 30, 45, and 60min after addition of trypsin, boiled in SDS sample buffer, and resolved on 13% acrylamide SDS gels. Under the dark condition, samples were harvested under the identical conditions and time points as above but without undergoing irradiation.
Sample preparation
AtCRY1 was isolated from a recombinant baculovirus expression system and purified by nickel column affinity chromatography as described previously.46 The W324F mutant of AtCRY1 was also prepared as reported previously.43 For the truncated proteins, gene coding PHR-like domain10 was inserted into pGEX-6P-1. The protein lacking the CCT domain was expressed in E. coli and purified with glutathione Sepharose followed by Mono Q and Sephacryl S-300 after tag cleavage. The proteins were dissolved into the buffer solution containing 50 mM Tris–HCl, 500 mM NaCl, and 30% (vol/vol) glycerol (pH 7.5). Dusts in the sample solution were removed with a centrifuge before measurement. The TG signal was measured mostly at a concentration of 80 μM. Dependence on the concentration was examined in the concentration range from 39 μM to 80 μM.
Acknowledgments
This work was supported by the Grant-in-Aid for Scientific Research (A) (No. 18205002), Grantin-Aid for Scientific Research on Innovative Areas (Research in a proposed research area) (20107003) from the Ministry of Education, Science, Sports, and Culture in Japan (to M.T.); National Science Foundation grant 0848311 (to M.A.); and National Institutes of Health grant GM37684 (to E.D.G.). M. K. was supported by research fellowship of Global COE program, International Center for Integrated Research and Advanced Education in Material Science, Kyoto University, Japan. K.H. was supported by The Skaggs Institute for Chemical Biology.
Abbreviations used
- AtCRY1
Arabidopsis thaliana cryptochrome 1
- CRY
cryptochrome
- PHR
photolyase
- CCT
cryptochrome C-terminal
- FAD
flavin adenine dinucleotide
- TG
transient grating
- TA
transient absorption
- FTIR
Fourier transform infrared
- DSCC
diffusion-sensitive conformation change
References
- 1.Cashmore AR, Jarillo JA, Wu Y, Liu D. Cryptochromes: blue light receptors for plants and animals. Science. 1999;284:760–765. doi: 10.1126/science.284.5415.760. [DOI] [PubMed] [Google Scholar]
- 2.Ahmad M, Cashmore AR. HY4 gene of A. thaliana encodes a protein with characteristics of a blue-light photoreceptor. Nature. 1993;366:162–166. doi: 10.1038/366162a0. [DOI] [PubMed] [Google Scholar]
- 3.Hsu DS, Zhao X, Zhao S, Kazantsev A, Wang R, Todo T, et al. Putative human blue-light photoreceptors hCRY1 and hCRY2 are flavoproteins. Biochemistry. 1996;35:13871–13877. doi: 10.1021/bi962209o. [DOI] [PubMed] [Google Scholar]
- 4.Song S, Őztűrk N, Denaro TR, Arat NŐ, Kao Y, Zhu H, et al. Formation and function of flavin anion radical in cryptochrome 1 blue-light photoreceptor of monarch butterfly. J Biol Chem. 2007;282:17608–17612. doi: 10.1074/jbc.M702874200. [DOI] [PubMed] [Google Scholar]
- 5.Gegear RJ, Casselman A, Waddell S, Reppert SM. Cryptochrome mediates light-dependent magnetosensitivity in Drosophila. Nature. 2008;454:1014–1018. doi: 10.1038/nature07183. [DOI] [PMC free article] [PubMed] [Google Scholar]
- 6.Brudler R, Hitomi K, Daiyasu H, Toh H, Kucho K, Ishiura M, et al. Identification of a new cryptochrome class: structure, function, and evolution. Mol Cell. 2003;11:59–67. doi: 10.1016/s1097-2765(03)00008-x. [DOI] [PubMed] [Google Scholar]
- 7.Sancer A. Structure and function of photolyase and in vivo enzymology: 50th anniversary. J Biol Chem. 2008;283:32153–32157. doi: 10.1074/jbc.R800052200. [DOI] [PMC free article] [PubMed] [Google Scholar]
- 8.Losi A. Flavin-based blue-light photosensors: a photobiophysics update. Photochem Photobiol. 2007;83:1283–1300. doi: 10.1111/j.1751-1097.2007.00196.x. [DOI] [PubMed] [Google Scholar]
- 9.Sancer A. Structure and function of DNA photolyase and cryptochrome blue-light photoreceptors. Chem Rev. 2003;103:2203–2238. doi: 10.1021/cr0204348. [DOI] [PubMed] [Google Scholar]
- 10.Brautigam CA, Smith BS, Ma Z, Palnitkar M, Tomchick DR, Machius M, Deisenhofer J. Structure of the photolyase-like domain of cryptochrome 1 from Arabidopsis thaliana. Proc Natl Acad Sci USA. 2004;101:12142–12147. doi: 10.1073/pnas.0404851101. [DOI] [PMC free article] [PubMed] [Google Scholar]
- 11.Partch CL, Clarkson MW, Őzgűr S, Lee AL, Sancar A. Role of structural plasticity in signal transduction by the cryptochrome blue-light photoreceptor. Biochemistry. 2005;44:3795–3805. doi: 10.1021/bi047545g. [DOI] [PubMed] [Google Scholar]
- 12.Yang H, Wu Y, Tang R, Liu D, Liu Y, Cashmore AR. The C termini of Arabidopsis cryptochromes mediate a constitutive light response. Cell. 2000;103:815–827. doi: 10.1016/s0092-8674(00)00184-7. [DOI] [PubMed] [Google Scholar]
- 13.Yang H, Tang R, Cashmore AR. The signaling mechanism of Arabidopsis CRY1 involves direct interaction with COP1. Plant Cell. 2001;13:2573–2587. doi: 10.1105/tpc.010367. [DOI] [PMC free article] [PubMed] [Google Scholar]
- 14.Giovani B, Byrdin M, Ahmad M, Brettel K. Light-induced electron transfer in a cryptochrome blue-light photoreceptor. Nat Struct Biol. 2003;10:489–490. doi: 10.1038/nsb933. [DOI] [PubMed] [Google Scholar]
- 15.Kottke T, Batschauer A, Ahmad M, Heberle J. Blue-light-induced changes in Arabidopsis cryptochrome 1 probed by FTIR difference spectroscopy. Biochemistry. 2006;45:2472–2479. doi: 10.1021/bi051964b. [DOI] [PubMed] [Google Scholar]
- 16.Banerjee R, Schleicher E, Meier S, Munoz VR, Pokorny R, Ahmad M, et al. The signaling state of Arabidopsis cryptochrome 2 contains flavin semiquinone. J Biol Chem. 2007;282:14916–14922. doi: 10.1074/jbc.M700616200. [DOI] [PubMed] [Google Scholar]
- 17.Langenbacher T, Immeln D, Dick B, Kottke T. Microsecond light-induced proton transfer to flavin in the blue light sensor plant cryptochrome. J Am Chem Soc. 2009;131:14274–14280. doi: 10.1021/ja901628y. [DOI] [PubMed] [Google Scholar]
- 18.Li Q, Yang H. Cryptochrome signaling in plants. Photochem Photobiol. 2007;83:94–101. doi: 10.1562/2006-02-28-IR-826. [DOI] [PubMed] [Google Scholar]
- 19.Bouly JP, Schleicher E, Dionisio-Sese M, Vandenbussche F, Van Der Straeten D, Bakrim N, et al. Cryptochrome blue light photoreceptors are activated through interconversion of flavin redox states. J Biol Chem. 2007;282:9383–9391. doi: 10.1074/jbc.M609842200. [DOI] [PubMed] [Google Scholar]
- 20.Aubert C, Vos MH, Mathis P, Eker APM, Brettel K. Intraprotein radical transfer during photoactivation of DNA photolyase. Nature. 2000;405:586–590. doi: 10.1038/35014644. [DOI] [PubMed] [Google Scholar]
- 21.Inoue K, Baden N, Terazima M. Diffusion coefficient and the secondary structure of poly-l-glutamic acid in aqueous solution. J Phys Chem B. 2005;109:22623–22628. doi: 10.1021/jp052897y. [DOI] [PubMed] [Google Scholar]
- 22.Hoshihara Y, Imamoto Y, Kataoka M, Tokunaga F, Terazima M. Conformational changes in the N-terminal region of photoactive yellow protein: a time-resolved diffusion study. Biophys J. 2008;94:2187–2193. doi: 10.1529/biophysj.107.115253. [DOI] [PMC free article] [PubMed] [Google Scholar]
- 23.Eitoku T, Zarate X, Kozhukh GV, Kim JI, Song PS, Terazima M. Time-resolved detection of conformational changes in oat phytochrome A: time-dependent diffusion. Biophys J. 2006;91:3797–3804. doi: 10.1529/biophysj.106.092882. [DOI] [PMC free article] [PubMed] [Google Scholar]
- 24.Nakasone Y, Eitoku T, Matsuoka D, Tokutomi S, Terazima M. Dynamics of conformational changes of Arabidopsis phototropin 1 LOV2 with the linker domain. J Mol Biol. 2007;367:432–442. doi: 10.1016/j.jmb.2006.12.074. [DOI] [PubMed] [Google Scholar]
- 25.Eitoku T, Nakasone Y, Matsuoka D, Tokutomi S, Terazima M. Conformational dynamics of phototropin 2 LOV2 domain with the linker upon photoexcitation. J Am Chem Soc. 2005;127:13238–13244. doi: 10.1021/ja052523i. [DOI] [PubMed] [Google Scholar]
- 26.Tanaka K, Nakasone Y, Okajima K, Ikeuchi M, Tokutomi S, Terazima M. Oligomericstate-dependent conformational change of the BLUF protein TePixD (Tll0078) J Mol Biol. 2009;386:1290–1300. doi: 10.1016/j.jmb.2009.01.026. [DOI] [PubMed] [Google Scholar]
- 27.Nakasone Y, Ono T, Ishii A, Masuda S, Terazima M. Transient dimerization and conformational change of a BLUF protein: YcgF. J Am Chem Soc. 2007;129:7028–7035. doi: 10.1021/ja065682q. [DOI] [PubMed] [Google Scholar]
- 28.Hazra P, Inoue K, Laan W, Helligwerf KJ, Terazima M. Tetramer formation kinetics in the signaling state of AppA monitored by timeresolved diffusion. Biophys J. 2006;91:654–661. doi: 10.1529/biophysj.106.083915. [DOI] [PMC free article] [PubMed] [Google Scholar]
- 29.Nakasone Y, Eitoku T, Matsuoka D, Tokutomi S, Terazima M. Kinetic measurement of transient dimerization and dissociation reactions of Arabidopsis phototropin 1 LOV2 domain. Biophys J. 2006;91:645–653. doi: 10.1529/biophysj.106.084772. [DOI] [PMC free article] [PubMed] [Google Scholar]
- 30.Harigai M, Imamoto Y, Kamikubo H, Yamazaki Y, Kataoka M. Role of an N-terminal loop in the secondary structural change of photoactive yellow protein. Biochemistry. 2003;42:13893–13900. doi: 10.1021/bi034814e. [DOI] [PubMed] [Google Scholar]
- 31.Chen E, Lapko VN, Song PS, Kliger DS. Dynamics of the N-terminus alpha-helix unfolding in the photoreversion reaction of phytochrome A. Biochemistry. 1997;36:4903–4908. doi: 10.1021/bi9627065. [DOI] [PubMed] [Google Scholar]
- 32.Corchnoy SB, Swartz TE, Lewis JW, Szundi I, Briggs WR, Bogomolni RA. Intramolecular proton transfers and structural changes during the photocycle of the LOV2 domain of phototropin 1. J Biol Chem. 2003;278:724–731. doi: 10.1074/jbc.M209119200. [DOI] [PubMed] [Google Scholar]
- 33.Harper SM, Christie J, Gardner KH. Disruption of the LOV-Jα helix interaction activates phototropin kinase activity. Biochemistry. 2004;43:16184–16192. doi: 10.1021/bi048092i. [DOI] [PubMed] [Google Scholar]
- 34.Terazima M. Photothermal studies of photophysical and photochemical processes by the transient grating method. Adv Photochem. 1998;24:255–338. [Google Scholar]
- 35.Terazima M, Hirota N. Translational diffusion of a transient radical studied by the transient grating method; pyrazinyl radical in 2-propanol. J Chem Phys. 1993;98:6257–6262. [Google Scholar]
- 36.Hara T, Hirota N, Terazima M. A new application of the transient grating method to a photochemical reaction; the entropy, reaction volume and partial molar volume measurements. J Phys Chem. 1996;100:10194–10200. [Google Scholar]
- 37.Nishida S, Nada T, Terazima M. Kinetics of intermolecular interaction during protein folding of reduced cytochrome c. Biophys J. 2004;87:2663–2675. doi: 10.1529/biophysj.104.042531. [DOI] [PMC free article] [PubMed] [Google Scholar]
- 38.Terazima M. Diffusion coefficients as a monitor of reaction kinetics of biological molecules. Phys Chem Chem Phys. 2006;8:545–557. doi: 10.1039/b513509e. [DOI] [PubMed] [Google Scholar]
- 39.Cussler EL. Diffusion. 3. chapt. 5. Cambridge University Press; New York: 2009. p. 129. [Google Scholar]
- 40.Khan JS, Imamoto Y, Harigai M, Kataoka M, Terazima M. Conformational changes of PYP monitored by diffusion coefficient: effect of N-terminal α-helices. Biophys J. 2006;90:3686–3693. doi: 10.1529/biophysj.105.078196. [DOI] [PMC free article] [PubMed] [Google Scholar]
- 41.Busza A, Emery-Le M, Rosbash M, Emery P. Roles of the two Drosophila cryptochrome structural domains in circadian photoreception. Science. 2004;304:1503–1506. doi: 10.1126/science.1096973. [DOI] [PubMed] [Google Scholar]
- 42.Biskup T, Schleicher E, Okafuji A, Link G, Hitomi K, Getzoff ED, Weber S. Direct observation of a photoinduced radical pair in a cryptochrome blue-light photoreceptor. Angew Chem Int Ed. 2009;48:404–407. doi: 10.1002/anie.200803102. [DOI] [PMC free article] [PubMed] [Google Scholar]
- 43.Zeugner A, Byrdin M, Bouly J, Bakrim N, Giovani B, Brettel K, Ahmad M. Light-induced electron transfer in Arabidopsis cryptochrome-1 correlates with in vivo function. J Biol Chem. 2005;280:19437–19440. doi: 10.1074/jbc.C500077200. [DOI] [PubMed] [Google Scholar]
- 44.Terazima M, Hirota N. Measurement of the quantum yield of triplet formation and short triplet lifetimes by the transient grating technique. J Chem Phys. 1991;95:6490–6495. [Google Scholar]
- 45.Terazima M. Is the translational diffusion of organic radicals different from that of closed-shell molecules? Acc Chem Res. 2000;33:687–694. doi: 10.1021/ar000003g. [DOI] [PubMed] [Google Scholar]
- 46.Lin C, Robertson DE, Ahmad M, Raibekas AA, Jorns MS, Dutton PL, Cashmore AR. Association of flavin adenine dinucleotide with the Arabidopsis blue light receptor CRY1. Science. 1995;269:968–970. doi: 10.1126/science.7638620. [DOI] [PubMed] [Google Scholar]