

Abstract
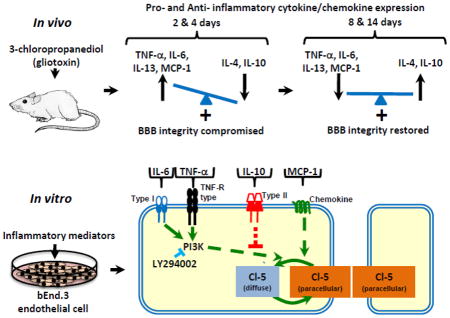
Signaling mechanisms involved in regulating blood-brain barrier (BBB) integrity during central nervous system (CNS) inflammation remain unclear. We show that an imbalance between pro-/anti-inflammatory cytokines/chemokines alter claudin-5 expression. In vivo, gliotoxin-induced changes in glial populations and an imbalance between pro-/anti-inflammatory cytokine/chemokine expression occurred as BBB integrity was compromised. The balance was restored as BBB integrity was reestablished. In vitro, TNF-α, IL-6, and MCP-1 induced paracellular claudin-5 expression loss. TNF-α- and IL-6-, effects were mediated through the PI3K pathway and IL-10 attenuated TNF- α’s effect. This study shows that pro-/anti-inflammatory modulators play a critical role in BBB integrity during CNS inflammation.
Keywords: Astrocytes, blood-brain barrier, chemokine, cytokine, claudin-5, microglia
Graphical abstract
1. Introduction
The blood-brain barrier (BBB) is a key regulator of central nervous system (CNS) homeostasis, promoting neuronal support and limiting lymphocytes, toxins, blood proteins, and microorganisms from entering brain and spinal tissue. This highly selective and dynamic barrier is composed of endothelial cells that express tight and adherens junction proteins, astrocytes, microglia, and pericytes (Willis et al., 2008; Abbott et al., 2010). Although the BBB is central to CNS homeostasis, the factors responsible for maintaining BBB properties remain unclear. A number of studies have shown that astrocytes play an important role in BBB regulation. In vitro, cultured primary brain endothelial cells lose their BBB characteristics (Rubin et al., 1991). These features are restored when endothelial cells are co-cultured with cells of astroglial origin or when incubated with astroglial membrane fractions or astrocyte/glioma-conditioned medium (Tao-Cheng et al., 1987; Abbott et al., 1992; Hurst and Fritz 1996; Sobue et al., 1999; Prat et al., 2001). In vivo, we have previously shown that astrocytes play a critical role in tight junction protein expression and in maintaining BBB integrity (Willis et al., 2004a&b; Willis et al., 2013). Systemic administration of the gliotoxin, 3-chloropropanediol, induced a loss of glial fibrillary acidic protein (GFAP)-immunoreactive astrocytes and CD11b-immunoreactive microglia in the rat inferior colliculus. Vascular endothelial cells lost paracellular expression of tight junction proteins claudin-5, occludin, and zonula occludens-1 (ZO-1), but not adherens junction markers VE-cadherin nor β-catenin (Willis et al., 2004b; Willis et al., 2013). These morphological changes culminated in the loss of BBB integrity to 4–70 kDa dextran tracers (Willis et al., 2004b). As the pathology progressed, a gliosis developed in which GFAP-immunoreactive astrocytes and CD11b-immunoreactive microglia repopulated the lesion, and tight junction proteins returned to paracellular domains with restoration of BBB integrity to dextran tracers. Results from this study suggest a restorative role primarily for astrocytes at the BBB (Willis et al., 2004b). However, the mechanism of signal transduction between glial cells and endothelial cells was not studied.
Astrocytes perform a wide range of functions, including neuronal metabolic support, regulation of the extracellular space ion concentration, neurotransmitter uptake and release, modulation of synaptic transmission, vasomodulation, and repair of the CNS scarring process (Abbott et al., 2006). The myeloid-derived microglia are the resident monocytes of the CNS. Hypertrophy and proliferation of microglial cells are morphological features of the CNS innate immune response to stimuli such as inflammation and endotoxins during neurodegenerative disease (McMahon et al., 2005; Inoue, 2006). Under inflammatory conditions, both activated astrocytes and hypertropic microglia secrete a variety of inflammatory mediators including interleukin (IL)-1β, IL-6, tumor necrosis factor-α (TNF-α), and interferon-gamma (IFN-γ), (DeLeo et al., 2004; Coull et al., 2005; McMahon et al., 2005; Abbott et al., 2006). There is a growing body of evidence that inflammatory mediators play a role in BBB breakdown (Capaldo et al., 2009; Pan et al., 2011; Erikson et al., 2012). Patients with multiple sclerosis (MS) show elevated levels of cytokines and chemokines in the CNS and a loss of BBB integrity (Plumb et al., 2002; Erikson et al., 2012). However, the effect of pro- and anti-inflammatory mediators regulating the integrity of the mature BBB is not fully understood.
We reasoned that modulation of astrocyte and microglia populations would initiate an inflammatory response with marked changes in pro- and anti-inflammatory mediator expression, and that these mediators directly regulate markers of BBB integrity. To test this hypothesis, we employed both an in vivo and in vitro experimental design. In vivo, we used the well-defined 3-chloropropanediol lesion model (Willis et al., 2004b). In vitro, we employed use of the endothelial cell line, bEnd.3, to determine the effect of select cytokines/chemokines directly on vascular endothelial cells. We show that a chemically-induced change in glial populations and an imbalance in pro-/anti-inflammatory cytokine/chemokine expression in the rat inferior colliculus occur when the integrity of the BBB is compromised. In vitro, TNF-α, IL-6, and MCP-1, but not IL-10, induced a loss of paracellular claudin-5 expression. Pre-treatment with IL-10 attenuated TNF-α’s effects on claudin-5 expression. In addition, TNF-α-, and IL-6-, but not MCP-1-, induced effects are in part mediated through the PI3K pathway. Therapeutics based on anti-inflammatory cytokine activity, or that restore the pro-/anti-inflammatory balance may slow progression of, or even reverse, neurodegenerative disease pathology, such as seen with MS, by preserving BBB integrity.
2. Methods
2.1. Animals and dosing
Male Fischer F344 rats (180–220 g; Harlan, Indianapolis, IN, USA) were maintained on a 12:12 h day/night light cycle. Food and water was provided ad libitum. Rats were given a single i.p. dose of 140 mg/kg 3-chloropropanediol ((S)-(+)-3-chloro- 1,2-propanediol, S-α-chlorohydrin); (Sigma-Aldrich Inc., St. Louis, MO, USA) in sterile saline (1 ml/kg) under light isoflurane anesthesia. The rats were allowed to recover and were then sacrificed up to 14 days after dosing. Vehicle injected animals were used for control inferior colliculus tissue studies. Four to six animals were used in each group. All animal procedures were carried out in accordance with National Institutes of Health guidelines and were approved by the University of New England Institutional Animal Care and Use Committee. All efforts were made to minimize the number of animals used and their suffering.
2.2. Tissue preparation
For confocal microscopy and MILLIPLEX immunoassays, animals were killed by over-dose of isoflurane anesthetic followed by decapitation. For confocal microscopy whole brains were rapidly removed and the hind brain collected. For MILLIPLEX immunoassays, the inferior colliculus was dissected out. All samples were snap-frozen in dry ice-cooled isopentane at −40°C and stored at −80°C until required.
2.3. In vivo confocal microscopy
Cryostat sections (30 μm) containing inferior colliculus (+0.4 to +0.6 mm from the interaural line) (Paxinos et al., 1998) were mounted on gelatin-coated glass slides and stored at −80°C until used for staining. Tissue sections were air-dried and fixed in 100% ethanol for 10 min. Following fixation, sections were washed in phosphate buffered saline (PBS) (pH 7.2), then in buffer (1% bovine serum albumin (BSA)/0.2% Tween-20 in PBS), and incubated in normal goat serum (2 mg/ml in buffer; Dako A/S, Glostrup, Denmark) for 30 min. Indirect immunofluorescence was performed using GFAP (0.8 μg/ml; Sigma-Aldrich), and CD11b (0.5 μg/ml; AbD Serotec, Raleigh, NC, USA). Primary antibodies were diluted in buffer and incubated on sections for 2 h. Following incubation, sections were washed in buffer and incubated in purified goat anti-mouse IgG secondary antibodies conjugated to Alexa-Fluor-488 (4 μg/ml; Life Technologies, Carlsbad, CA, USA) for 1 h in the dark. Finally, sections were washed in buffer, then in PBS, and mounted in ProLong Gold antifade with DAPI (Life Technologies) under coverslips. All incubations were performed at room temperature (RT).
Sections were examined using a Leica TCS SP5 laser scanning confocal microscope with an argon-krypton laser and three channel scan head (Leica, Buffalo Grove, IL, USA). Sequential scans were created through the 30 μm sections and maximum projection images were obtained. These were exported and viewed using Paint Shop Pro 7.0 (Jasc Software, Inc. Eden Prairie, MN, USA) and uniformly adjusted to optimize brightness and contrast.
2.4. MILLIPLEX immunoassay analysis of cytokines/chemokines in vivo
The inferior colliculus was homogenized using a handheld Teflon homogenizer in ice-cold CelLytic buffer (Sigma-Aldrich) containing protease inhibitor cocktail (Sigma-Aldrich) and phosphatase inhibitor cocktails 2&3 (Sigma-Aldrich). The homogenate was cleared by centrifugation (10,000g, 10 min, 4°C). The protein concentration of each sample was determined using the bicinchoninic acid protein assay (Pierce Biotechnology, Rockford, IL, USA) and used for immunoassay analysis. A commercially available MILLIPLEX MAP Rat Cytokine/Chemokine Magnetic Bead Immunoassay (Millipore, Billerica, MA, USA) was used to measure the tissue TNF-α, IL-6, IL-13, MCP-1, IL-4, and IL-10, levels in the rat inferior colliculus. All procedures followed the manufacturer’s protocol. Briefly, assay buffer was added to a 96-well plate and incubated for 10 min at RT. Assay buffer was removed and replaced with rat inferior colliculus tissue homogenate sample or CelLytic buffer (without inhibitors) for background. A standard curve was prepared using supplied standards and control samples. Finally, well-mixed and sonicated magnetic beads were added to each well. The plate was incubated at 4°C on a plate shaker overnight. The plate was then washed with wash buffer (Millipore), detection antibodies added, and then incubated for 1 h at RT while shaking. Without removing the detection antibodies, Streptavidin-Phycoerythrin was added and the plate incubated for 30 min at RT while shaking. Finally, the plate was washed, sheath fluid (Millipore) added, and the overall median fluorescent intensity in each well was determined using MAGPIX hardware. The median fluorescent intensity of each analyte was determined through the logistic curve-fitting method. Analytes were normalized to total protein concentration.
2.5. Mouse bEnd.3 endothelial cell-culture
bEnd.3 endothelial cells are BALB/c mouse brain endothelial cells transformed by a retrovirus vector that expresses polyomavirus middle T antigen (CRL-2299 American Type Culture Collection, Manassas, VA, USA). Cells were grown in Dulbecco’s Modified Eagle’s Medium (DMEM, D6046)/10% fetal bovine serum (FBS) (Sigma-Aldrich) in a humidified cell culture incubator at 37°C and 5% CO2/95% room air following supplier’s instructions. For experimental use, cells were trypsinized and plated at a density of 0.5–1.0×10⁴ cells/cm2 (Omidi et al., 2003) onto 12-well plates with collagen I–coated glass coverslips, to be viewed by immunofluorescence microscopy. Cells were grown until confluent and medium was monitored and changed every three days and again 24 h before cell treatment.
2.6. Cytokine, chemokine, and PI3K inhibitor treatment
Pro-inflammatory cytokines TNF-α and IL-6 (Miltenyi Biotec Inc., San Diego, CA, USA), anti-inflammatory cytokine IL-10 (Miltenyi Biotec Inc.), and chemokine MCP-1 (BioLegend, San Diego, CA, USA) were prepared in DMEM/10% FBS and added to bEnd.3 cells to give a final concentration of 0.1, 1.0, or 10 ng/ml. Endothelial cells were exposed to TNF-α, IL-6, MCP-1, or IL-10, for 24 h. The PI3K inhibitor, LY294002 (2-(4-Morpholinyl)-8-phenyl-4H-1-benzopyran-4-one hydrochloride); (Tocris Bioscience, Minneapolis, MN, USA), and IL-10 were added to the bEnd.3 cells 30 min prior to treatment with TNF-α or IL-6. Following treatment, culture plates were returned to the incubator for 24 h.
2.7. In vitro immunofluorescence microscopy
Following treatment, bEnd.3 cells grown on glass coverslips were washed in PBS and fixed/permeabilized in 100% ethanol for 5 min. Cells were then washed with PBS followed by buffer (1% bovine serum albumin (BSA)/0.2% Tween-20 in PBS) before incubating in normal goat serum (2 mg/ml in buffer; Dako A/S) for 15 min at RT. Indirect immunofluorescence was performed using claudin-5 (2.5 μg/ml; Life Technologies). The primary antibody was diluted in buffer and incubated with cells for 90–120 min. Cells were then washed in 1% PBS/BSA and incubated in purified goat anti-mouse IgG conjugated to Alexa-Fluor-488 (4 μg/ml) for 60 min in the dark. Finally, cells were washed in 1% PBS/BSA, then PBS, and mounted in ProLong Gold antifade with DAPI (Life Technologies). bEnd.3 monolayers were assessed for changes in claudin-5 morphology. All incubations were performed at RT.
The bEnd.3 monolayers were examined using an Olympus BX53 (Olympus, Center Valley, PA, USA) fluorescent microscope. A digital camera captured images using the CellSens image software (Olympus). Captured images were exported and uniformly adjusted to optimize brightness and contrast utilizing Paint Shop Pro 7.0 (Jasc Software Inc.).
2.8. Statistical analysis
Immunoassay densitometry data are reported as mean ± s.e.m. from 4–6 separate rats in each group. Statistical significance between treatment groups and control values was determined using Student’s t-test analysis. p values less than 0.05 were considered to be significant.
3. Results
3.1. 3-chloropropanediol-induced reversible loss of astrocytes and microglia in the rat inferior colliculus
CD11b-immunoreactive microglia appeared with fine filamentous processes and were present throughout the inferior colliculus in control samples (Fig. 1A, arrow). At 1 day post-treatment, there was a marked loss of microglia (Fig. 1B, asterisk). However, by 2 days post 3-chloropropanediol administration, microglia were repopulating the lesion and CD11b-immunoreactivity appeared comparable to control levels, although morphology differed as these microglia appeared amoeboid in profile (Fig. 1C, arrows). By 4 to 8 days, CD11b-immunoreactive microglia continued to proliferate and showed raised CD11b-immunoreactivity (Fig. 1D,E). By day 14, CD11b-immunoreactivity was comparable to control levels, but morphology of CD11b-immunoreactive cells differed (Fig. 1F). GFAP-immunoreactive astrocytes were present in the rat inferior colliculus in control samples (Fig. 1G, arrow). At days 1 and 2, GFAP-immunoreactive astrocytes were lost from the inferior colliculus (Fig. 1H,I). By 4 days post 3-chloropropanediol treatment, a marked loss of GFAP-astrocytes was seen within the lesioned area (Fig. 1J, asterisk). Over the next 8 days, astrocytes repopulated the lesion, and GFAP expression was comparable to levels seen in control tissue by day 14 (Fig. 1K,L, arrows).
Figure 1. Reversible loss of GFAP and CD11b expression in the rat inferior colliculus following 3-chloropropanediol treatment.

Confocal micrographs showing; (A) CD11b-immunoreactive microglia were seen in control rat inferior colliculus tissue. (B) 1 day post-treatment, there was a marked reduction in CD11b expression (asterisk). (C) At 2 days, there was a marked increase in CD11b expression in the inferior colliculus (arrows). (D) At day 4, there was a further increase in CD11b expression. (E&F) At days 8 & 14, CD11b expression remained elevated compared to control tissue. (G) GFAP-immunoreactive astrocytes (arrow) in the control rat inferior colliculus. (H&I) At 1 & 2 days following 3-chloropropanediol administration, a marked loss of GFAP-immunoreactive astrocytes was seen. (J) 4 days post-treatment, GFAP-immunoreactive astrocytes were lost from the lesioned area (asterisk). (K&L) At 8 & 14 days, GFAP-immunoreactive astrocytes repopulated the inferior colliculus (arrows). Scale bar = 80 μm (refers to A–L).
3.2. Early increased pro-inflammatory and decreased anti-inflammatory cytokine/chemokine expression in the rat inferior colliculus
Pro- and anti-inflammatory cytokines/chemokines, TNF-α, IL-6, IL-13, MCP-1, IL-4, and IL-10, were detected using MILLIPLEX immunoassay (Fig. 2A–F). Control levels of TNF-α were 0.13 +/− 0.05 pg/μg protein. There was a slight decrease in TNF-α at 1 day post-treatment, but then expression significantly (p<0.01–0.001) increased by days 2 and 4, reaching 800% (0.60 +/− 0.08 pg/μg) and 480% (0.35 +/− 0.20 pg/μg) above control levels respectively (Fig. 2A). TNF-α showed a gradual decrease over the next 4–10 days, returning to levels comparable to control samples by the end of the study at day 14 (Fig. 2A). Control levels of IL-6 were 31.52 +/− 6.27 pg/μg protein. On day 1, following systemic administration of 3-chloropropanediol, IL-6 expression reached 500% (p<0.01) above control levels and 677% (294.36 +/− 18.82 pg/μg) (p<0.001) at day 2 (Fig. 2B). At days 4, 8 and 14, IL-6 showed a marked drop in expression. At day 4, IL-6 was at 157% (51.89 +/− 6.69 pg/μg), with levels returning to control values at 8 days (35.42 +/− 6.47 pg/μg) (Fig. 2B). Control levels of IL-13 were 0.54 +/− 0.14 pg/μg protein. By day 2, there was a significant (p<0.001) 800% increase from baseline levels reaching 5.31 +/− 0.43 pg/μg. By day 4, levels had decreased, although were still significantly above control levels at 2.32 +/− 0.22 pg/μg. By day 8, IL-13 levels were approaching baseline values and by day 14 were at 0.60 +/− 0.22 pg/μg (Fig. 2C). MCP-1 showed a significant (p<0.001) 2300% increase at day 2 rising from 44.34 +/− 10.94 pg/μg to 490.95 +/− 32.58 pg/μg (Fig. 2D). By day 4, there was a decrease to 737% (p<0.001) above control values at 184.91 +/− 32.58 pg/μg, before returning towards control levels at days 8 and 14 (65.03 +/− 8.43 pg/μg) (Fig. 2D).
Figure 2. Modulation of cytokine/chemokine expression in the rat inferior colliculus following 3-chloropropanediol administration.

The MILLIPLEX immunoassay showed (A–D) increased expression of pro-inflammatory cytokines and chemokines TNF-α, IL-6, IL-13, and MCP-1. (A) TNF-α expression peaked at 2 days and slowly returned towards control levels over the next 12 days. (B) IL-6 expression was markedly increased at 1 day post 3-chloropropanediol administration, and continued to increase at day 2, before returning to control levels at 8 and 14 days. (C) IL-13 expression slightly decreased at 1 day post treatment, but dramatically increased and peaked at day 2. (D) MCP-1 expression peaked at 2 days post 3-chloropropanediol administration, before returning to control values over the next 4 to 14 days. Anti-inflammatory cytokines (E) IL-4 and (F) IL-10 both initially decreased, with expression lowest at 4 days post 3-chloropropanediol treatment. (F) IL-10 returned to and above control levels at days 8 and 14. Values are expressed as percent change in expression compared to control values and are represented as mean ± s.e.m. *p<0.05, **p<0.01, ***p<0.001 compared to control groups. Each column n = 4–6 rats.
The anti-inflammatory cytokines, IL-4 and IL-10, followed an opposite change in expression. Control levels of IL-4 were 4.26 +/− 0.74 pg/μg protein and showed a reduction in expression, with a significant (p<0.01) decrease at day 4 (1.47 +/− 0.38 pg/μg). IL-4 remained significantly (p<0.01–0.001) below control levels by day 14 (Fig. 2E). In control tissue, IL-10 was measured at 11.49 +/− 1.93 pg/μg protein. There was a slight (non-significant) reduction in expression to 87% (10.63 +/− 1.76 pg/μg) over the first 2 days before decreasing significantly (p<0.01) at day 4, reaching 60% (6.14 +/− 1.37 pg/μg) below control values. By days 8 and 14, IL-10 levels had returned. At 8 days, IL-10 was at 95% (8.70 +/− 1.93 pg/μg) and by day 14 had increased significantly (p<0.05) to 112% of control values (Fig. 2F).
3.3. Pro-inflammatory cytokine/chemokine-induced loss of paracellular claudin-5 expression in bEnd3 cells
To study the effect of cytokines/chemokines directly on endothelial cells, we used bEnd.3 endothelial cell monocultures. Control cells probed for claudin-5 showed sharply defined immunoreactivity at the cell margins (Fig. 3A, E, I arrows). Treating bEnd.3 cells with TNF-α, IL-6, and MCP-1 (0.1, 1, or 10 ng/ml) for 24 h induced a loss of paracellular claudin-5 expression. TNF-α treatment induced a dose-dependent loss of claudin-5. 24 h exposure to TNF-α (0.1 or 1 ng/ml) resulted in loss of the sharply defined claudin-5 expression with immunoreactivity appearing diffuse, although still concentrated at the cell margins (Fig. 3B,C asterisks). Increasing the dose to 10 ng/ml induced a marked loss of paracellular claudin-5 expression (Fig. 3D, asterisk). IL-6 treatment resulted in loss of paracellular claudin-5 expression at all doses (Fig. 3F–H, asterisks). MCP-1 treatment also induced loss of the sharply defined paracellular claudin-5 expression (Fig. 3J–L, asterisks). However, at the doses of MCP-1 used (0.1, 1, or 10 ng/ml), the loss appeared not as marked as with TNF-α or IL-6 since claudin-5 immunoreactivity was still largely found around the cell margins.
Figure 3. Pro-inflammatory cytokines TNF-α and IL-6 and chemokine MCP-1, induce loss of paracellular claudin-5 expression in bEnd.3 cells.

Immunofluorescence studies showed (A,E,I, arrows) sharply defined claudin-5 expression at cell margins in control bEnd.3 cells. (B–D) Treatment with TNF-α (0.1, 1.0, 10 ng/ml) induced a dose-dependent loss of claudin-5 expression at cell margins (asterisks) after 1 day of exposure. Treatment with (F–H) IL-6 and (J–L) MCP-1 also induced loss of paracellular claudin-5 expression (asterisks) at all doses (0.1, 1.0, 10 ng/ml) after 1 day of exposure. Scale bar = 25 μm (refers to A–L).
3.4. Anti-inflammatory cytokine IL-10 had no effect on paracellular claudin-5 expression
Unlike the pro-inflammatory cytokines, the anti-inflammatory cytokine, IL-10 (0.1, 1.0, 10 ng/ml), had no effect on the sharply defined paracellular claudin-5 expression after 24 h (Fig. 4B–D) and treated cells appeared comparable to control cell morphology (Fig. 4A).
Figure 4. Anti-inflammatory cytokine IL-10 treatment had no effect on paracellular claudin-5 expression in bEnd.3 cells.
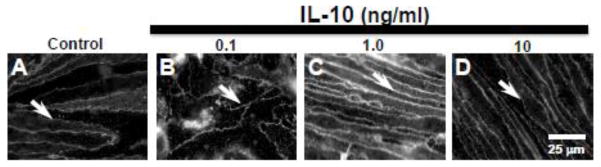
Immunofluorescence studies showed (A) sharply defined claudin-5 expression at bEnd.3 cell margins (arrow). (B–D) Treatment with IL-10 (0.1, 1.0, 10 ng/ml) had no effect on claudin-5 expression which remained at cell margins (arrows). Scale bar = 25 μm (refers to A–D).
3.5. Anti-inflammatory cytokine IL-10 attenuates TNF-α-induced paracellular loss of claudin-5 expression
To determine whether anti-inflammatory cytokines could attenuate the pro-inflammatory cytokine-induced loss of paracellular claudin-5 expression, bEnd.3 cells were treated with IL-10 (1 or 10 ng/ml) 30 min prior to TNF-α (1 or 10 ng/ml). Sharply defined paracellular claudin-5 immunoreactivity was present in control cells (Fig. 5A,F, arrows), but was lost following TNF-α (1.0 or 10 ng/ml) treatment for 24 h (Fig. 5B,G, asterisks). The paracellular claudin-5 morphology was preserved when bEnd.3 cells were pre-treated (30 min) with IL-10 (1 or 10 ng/ml) and then exposed to 1 or 10 ng/ml TNF-α for 24 h (Fig. 5C,D,H,I, arrows). IL-10 (1 or 10 ng/ml) treatment alone had no effect on claudin-5 expression (Fig. 5E,J, arrows).
Figure 5. IL-10 pre-treatment attenuated TNF-α-induced loss of claudin-5 expression.
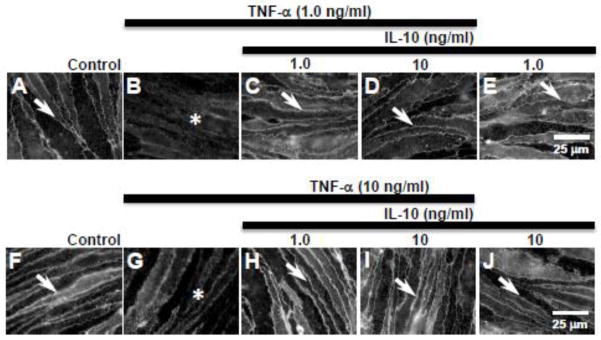
Analysis of immunofluorescence studies showed that (A, F) control bEnd.3 cells express claudin-5 at the cell margins (arrows). (B) TNF-α (1.0 ng/ml) exposure for 24 h induced loss of paracellular claudin-5 expression (asterisk). (C, D) 30 min pre-treatment with IL-10 (1.0 & 10 ng/ml) prevented the loss of paracellular claudin-5 expression (arrows) induced by TNF-α. (E) IL-10 (1.0 ng/ml) alone had no effect on claudin-5 expression (arrow). (G) TNF-α (10 ng/ml) induced loss of paracellular claudin-5 expression. (H, I) Pre-treatment with IL-10 (1.0–10 ng/ml) prevented TNF-α-induced loss of paracellular claudin-5 (arrows). (J) IL-10 (10 ng/ml) alone had no effect on claudin-5 expression (arrow). Scale bar = 25 μm (refers to A–J).
3.6. Pharmacological inhibition of phosphoinositide 3-kinase (PI3K) prevents TNF-α- or IL-6-induced loss of paracellular claudin-5, but not loss induced by MCP-1
In an earlier study, we have shown that the PI3K/AKT pathway plays a key role in modulating paracellular claudin-5 expression (Camire et al., 2014). To determine whether the PI3K/AKT pathway plays a role in cytokine/chemokine-induced loss of paracellular claudin-5 expression, we inhibited PI3K with the cell permeable inhibitor, LY294002. LY294002 inhibits α, β, δ, and γ PI3K subunits with IC50 values ranging from 0.31–6.60 μM. Immunofluorescence studies showed that LY294002 (25 μM) pre-treatment of bEnd.3 cells prevented the TNF-α (10 ng/ml) (Fig. 6C, arrow) and IL-6 (10 ng/ml) (Fig. 6E, arrow) induced loss of paracellular claudin-5 expression at 24 h. However, LY294002 (25 μM) pre-treatment (30 min) did not prevent the loss of paracellular claudin-5 expression induced by MCP-1 (10 ng/ml) (Fig 6G, asterisk).
Figure 6. Inhibition of PI3K with LY294002 attenuated TNF-α- and IL-6-, but not MCP-1-induced loss of claudin-5 expression.

Immunofluorescence analysis showed (A) sharply defined paracellular claudin-5 expression in control bEnd.3 cells (arrow). (B) TNF-α (10 ng/ml), (D) IL-6 (10 ng/ml), and (F) MCP-1 (10 ng/ml) induced loss of paracellular claudin-5 expression (asterisks). Pre-treatment with the PI3K inhibitor, LY294002 (25 μM), prevented the loss of paracellular claudin-5 expression induced by (C) TNF-α and (E) IL-6 (arrows), but did not attenuate (G) MCP-1-induced loss of claudin-5 expression (asterisk). Scale bar = 25 μm (refers to A–G).
5. Discussion
The present in vivo study shows that in the rat inferior colliculus, following 3-chloropropanediol administration, there was transient loss of CD11b-expressing microglia and GFAP-immunoreactive astrocytes. Over the first 24 h, although there was a marked change in CD11b expression, there was no significant change in the cytokines/chemokines measured, except IL-6. By 2–4 days, CD11b-microglial populations had recovered, whereas GFAP-astrocyte expression had further decreased. Pro-inflammatory cytokines/chemokine (TNF-α, IL-6, IL-13, and MCP-1) levels were significantly increased, while anti-inflammatory cytokines IL-4 and IL-10 expression decreased. Over the next 8–14 days, GFAP-astrocyte expression increased while the elevated CD11b expression decreased, but remained above control levels. Over the same period, IL-4 and IL-10 expression recovered as pro-inflammatory cytokine/chemokine expression returned to baseline levels. In vitro, direct application of TNF-α, IL-6, and MCP-1, but not IL-10, to bEnd.3 vascular endothelial cells induced loss of paracellular claudin-5 expression. Pre-treatment (30 min) with IL-10 prevented TNF-α-induced loss of paracellular claudin-5 expression. Further, the TNF-α- and IL-6-, but not MCP-1-, induced change in claudin-5 morphology was mediated through PI3K, since pharmacological inhibition of PI3K with LY294002 attenuated loss of paracellular claudin-5 expression. Together, these in vivo and in vitro results suggest that BBB integrity is mediated through glial cell interactions, and a balance between pro-/anti-inflammatory cytokines/chemokines that act directly on vascular endothelial cells, in part through the PI3K pathway.
Both in vivo and in vitro studies support the proposal that astrocytes play a key role in maintaining the restrictive properties of the mature BBB (Janzer and Raff 1987; Rubin et al., 1991; Krum et al., 1997; Sobue et al., 1999; Prat et al., 2001; Willis et al., 2004b). However, the signalling molecule(s) and signal transduction pathways at the BBB remain unclear. A growing body of evidence suggests that pro- and anti-inflammatory mediators modulate BBB properties (Abbott et al., 2006; Milner et al., 2008; Pan et al., 2011). In this study we took advantage of the in vivo 3-chloropropanediol model since it induces a well-defined lesion in the rat inferior colliculus, and a few other brain stem nuclei (Willis et al., 2004a). Further, lesion pathology shows good temporal separation of both degenerative and regenerative phases over a 28 day period. Cellular injury occurs rapidly after gliotoxin administration, following which only regenerative processes are present. This allows determination of inflammatory mediators in each phase without confounding overlap of degenerative/regenerative processes seen in other immune-mediated or toxin-induced models (Miron et al., 2013). The mechanism of action of 3-chloropropanediol and why specific brain regions are vulnerable to the gliotoxin is yet to be determined. In vivo, the loss of astrocytes may be due to the greater capacity of these cells to metabolize 3-chloropropanediol to 3-chlorolactaldehyde, through the action of alcohol dehydrogenase III (Mori et al., 2000; Skamarauskas et al., 2007). 3-chlorolactaldehyde is an inhibitor of GAPDH and triose isomerase and so may reflect a regional difference in the dependence of these astrocytes on glycolysis.
Our present in vivo results support the hypothesis that transitory changes in astrocyte and microglia expression modulate BBB integrity through changes in pro-/anti-inflammatory cytokine/chemokine expression balance. 3-chloropropanediol administration initially (1–4 days) induced CNS inflammation as shown by microgliosis and astrocytosis. A characteristic feature of CNS inflammation is the release of pro-inflammatory mediators including bradykinin, prostaglandins, serotonin, cytokines (IL-1, IL-6, TNF-α, interferon-γ), growth factors (TGF-β, VEGF), and chemokines (Abbott et al., 2006). Activated microglia produce TNF-α, IL-1β, and reactive oxygen species (including O2*), which are able to modulate the BBB (Sawada et al., 1989; Deli et al., 1995; Didier et al., 2003; Hansson and Ronnback 2003; Anderson et al., 2005). Our study suggests that the microgliosis is responsible for the early secretion of pro-inflammatory cytokines in the inferior colliculus. By 2 and 4 days, microglia had repopulated the lesion, and a significant increase in TNF-α, IL-6, IL-13, and MCP-1 expression (Fig. 1C,D, 2A–D) was seen. Over the same time period (1–4 days), a loss of GFAP-immunoreactivity and decreased anti-inflammatory cytokine IL-4 and IL-10 expression was observed (Fig. 1H–J, 2E,F). Together, this leads to an imbalance between pro-/anti-inflammatory modulator expression, compared to control tissue. We propose that this imbalance, in favor of pro-inflammatory modulators, induces a loss of BBB integrity, as shown previously by leak of fluorescent dextran tracers (4–70 kDa) over this time period (Willis et al., 2004b). Subsequently, by 8 and 14 days, astrocytes proliferate and GFAP-immunoreactivity and anti-inflammatory cytokine IL-10 expression return to near control levels. Expression of TNF-α, IL-6, IL-13, and MCP-1 also returned to levels seen in control tissue. These changes re-establish a pro-/anti- inflammatory cytokine/chemokine balance, that favors restoration of BBB properties as previously shown by vascular integrity to dextran tracers (10–70 kDa) at this time (Willis et al., 2004b).
Since the BBB microenvironment shows dynamic interactions between multiple cellular components, we used a mono-culture of bEnd.3 cells to determine the direct effect of selected inflammatory modulators on vascular endothelial cells. Although bEnd.3 cells show poor transendothelial electrical resistance values, they do express mRNA and protein markers for tight junction proteins and form a barrier to radiolabeled sucrose (Deli et al., 2005; Brown et al., 2007). The use of bEnd.3 cells is also beneficial since they are not contaminated by other cells of the neurovascular unit and do not dedifferentiate when passaged (Brown et al., 2007).
The proposed effect of pro- and anti-inflammatory modulators on the regulation of BBB integrity was supported by in vitro studies. We show that cytokines/chemokines directly modulate expression of the BBB integrity marker, claudin-5. Pro-inflammatory cytokines (TNF-α and IL-6) and chemokine MCP-1 (0.1–10 ng/ml), but not anti-inflammatory cytokine IL-10, induced a loss of paracellular claudin-5 expression in bEnd.3 cells (Figs. 3&4). Other in vitro studies have also shown pro-inflammatory cytokines to increase endothelial and epithelial cell monolayer permeability (Desai et al., 2002; Capaldo and Nusrat, 2009; Cohen et al., 2013). TNF-α impairs the role of tight junction proteins in a number of cell types including human umbilical vascular endothelial cells (HUVEC) and human colonic adenocarcinoma (Caco-2) cells. In uterine epithelial cells, TNF-α decreased permeability (Marano et al., 1998; Ozaki et al., 1999; Grant-Tschudy and Wira, 2005). Likewise, IL-6 increased permeability, with changes in ZO-1 and claudin-2 expression in human umbilical vein cells and intestinal epithelial cells, whereas in Caco-2 cells, IL-6 suppressed paracellular dextran flux (Desai et al., 2002; Wang et al., 2007; Suzuki et al., 2011). These conflicting reports may be due to differences in cell type, intracellular signalling mechanisms, or differences in dose and duration of cytokine treatment. MCP-1, regulates BBB permeability both in vivo and in vitro, through a redistribution of occludin, claudin-5, ZO-1, and ZO-2 proteins (Stamatovic et al., 2005). It will be interesting to determine if adherens junction proteins are altered by these inflammatory modulators in vitro, since it is proposed that tight and adherens junctions are regulated through different mechanisms (Hollande et al., 2003) and we have shown that paracellular expression of VE-cadherin and β-catenin remained intact in vivo, following 3-chloropropanediol administration (Willis et al., 2013).
The cytokine/chemokine intracellular signalling pathways that lead to changes in markers of BBB integrity are poorly understood. We focused on the role of the PI3K/AKT pathway. This signaling pathway is activated by a number of receptors, including integrin, cytokine, G protein–coupled receptors, and intracellular signalling molecules (Gonzalez-Mariscal et al., 2008; Hemmings and Restuccia, 2012). Recently we have shown that 3-chloropropanediol (500 μM) alone induced loss of paracellular claudin-5 expression in bEnd.3 cells through the PI3K/AKT pathway (Camire et al., 2014). Pre-treating bEnd.3 cells with the selective cell-permeable PI3K inhibitor, LY294002 (25 μM), prevented TNF-α- and IL-6-induced loss of paracellular claudin-5 (Fig 6), suggesting their actions were mediated through the PI3K pathway (Fig. 7). In contrast, the chemokine MCP-1-induced loss of claudin-5 expression was not prevented by LY294002, suggesting that MCP-1’s effects are mediated by a non-PI3K dependent pathway (Fig. 7). Studies using intestinal epithelial cells have demonstrated that IL-6-induced changes in claudin-2 expression are mediated by PI3K activity (Suzuki et al., 2011). We speculate that, although TNF-α- and IL-6 bind to different receptors (i.e. Type1 and TNF-R type), there is a convergence at PI3K (Fig. 7) and a common downstream pathway mediates loss of paracellular claudin-5 (Fig. 7). This may include a role for protein kinase-C isoforms since TNF-α and IL-6 have been reported to influence tight junction permeability through PKC (Desai et al., 2002; González-Mariscal et al., 2008; Aveleira et al., 2010). Thus, the morphological changes in claudin-5 immunoreactivity may represent a cellular redistribution of claudin-5 away from paracellular domains, possibly induced by a change in phosphorylation status (Willis et al., 2010).
Figure 7. Schematic representation showing signal transduction for TNF-α, IL-6, MCP-1, and IL-10 modulation of claudin-5 expression in bEnd.3 cells.
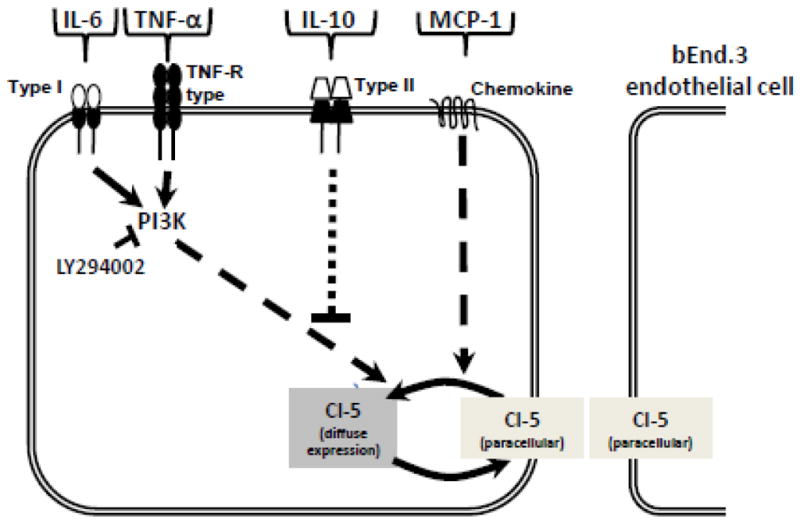
This study shows that the loss of claudin-5 from paracellular domains induced by TNF-α and IL-6 (0.1, 1.0, 10 ng/ml) is mediated through a PI3K dependent pathway, since pharmacological inhibition of PI3K with LY294002 (25 μM) preserved paracellular claudin-5 expression. The chemokine MCP-1 (0.1, 1.0, 10 ng/ml) also induced loss of claudin-5 from paracellular domains, but this is mediated through a PI3K independent pathway as LY294002 did not preserve claudin-5 expression. The anti-inflammatory cytokine IL-10 (0.1, 1.0, 10 ng/ml) had no effect on claudin-5 expression and attenuated the paracellular loss induced by TNF-α and IL-6 (1.0, 10 ng/ml).
Our results show that IL-10 (1–10 ng/ml) treatment had no effect on paracellular claudin-5 expression, which was maintained in bEnd.3 cells, and that IL-10 prevented the TNF-α-induced loss of claudin-5 expression. These results are consistent with other studies that suggest IL-10 opposes the effect of pro-inflammatory cytokines. IL-10 decreases endothelial permeability and prevents pro-inflammatory cytokine-mediated pathogenesis of inflammatory diseases in a variety of models (Oshima et al., 2001; Mazzon et al., 2002). The mechanism of this IL-10 antagonistic effect on TNF-α is unclear, and is the basis for future studies. We speculate that IL-10 treatment inhibited intracellular signalling mechanisms stimulated by TNF-α that result in loss of paracellular claudin-5 expression.
Conclusion
In summary, this study provides a greater understanding of microglia, astrocyte, and endothelial cell interactions during an inflammatory response. In vivo, we propose that BBB integrity homeostasis is maintained through a balance of pro-/anti-inflammatory cytokines/chemokines. A shift in favor of pro-inflammatory mediators is seen when BBB integrity is lost. As the pro-/anti-inflammatory balance is re-addressed, with increased IL-10 expression, BBB integrity is subsequently restored. In vitro, pro-inflammatory mediators TNF-α, IL-6, and MCP-1 induced loss of paracellular claudin-5, while anti-inflammatory IL-10 attenuated TNF-α-induced loss of claudin-5 expression. Further, TNF-α-, and IL-6-, but not MCP-1-induced effects were mediated through the PI3K signalling pathway. These studies represent a powerful new paradigm for understanding many neurological disorders that show changes in BBB integrity and glial pathology such as stroke, traumatic brain injury, and inflammatory disorders including multiple sclerosis and neuromyelitis optica.
Highlights.
Gliotoxin induced imbalance between pro-/anti-inflammatory cytokines/chemokines.
Changes in cytokine/chemokine expression occurred as BBB integrity was lost.
In vitro, TNF-α, IL-6 and MCP-1 induced loss of paracellular claudin-5 expression.
TNF-α and IL-6, effects were mediated through the PI3K pathway.
IL-10 attenuated TNF-α induced loss of claudin-5 expression.
Acknowledgments
This research was supported by the National Institutes of Health National Institute of General Medical Sciences [Grant P20-GM103643] and Westbrook College of Health Professions, University of New England [Research Fellowship]. We would like to thank Jimmy Qian for his technical support and Virginia McLane for her art work.
Abbreviations
- APC
Antigen-presenting cell
- BBB
Blood-brain barrier
- CD
Cluster of differentiation
- CNS
Central nervous system
- GFAP
Glial fibrillary acidic protein
- IL
Interleukin
- LY294002
(2-(4-Morpholinyl)-8-phenyl-4H-1-benzopyran-4-one hydrochloride)
- MCP-1
Monocyte chemoattractant protein-1
- MS
Multiple sclerosis
- PI3K
Phosphoinositide 3-kinase
- PKC
Protein kinase-C
- TNF
Tumor necrosis factor
Footnotes
Competing interests
All authors declare that they have no competing interests.
Publisher's Disclaimer: This is a PDF file of an unedited manuscript that has been accepted for publication. As a service to our customers we are providing this early version of the manuscript. The manuscript will undergo copyediting, typesetting, and review of the resulting proof before it is published in its final citable form. Please note that during the production process errors may be discovered which could affect the content, and all legal disclaimers that apply to the journal pertain.
Contributor Information
Ryan B. Camire, Email: rcamire@une.edu.
Holly J. Beaulac, Email: hbeaulac@une.edu.
Colin L. Willis, Email: clwillis@outlook.com.
References
- Abbott NJ, Patabendige AAK, Dolman DEM, Yusof SR, Begley DJ. Structure and function of the blood-brain barrier. Neurobiol Disease. 2010;37:13–25. doi: 10.1016/j.nbd.2009.07.030. [DOI] [PubMed] [Google Scholar]
- Abbott NJ, Revest PA, Romero IA. Astrocyte endothelial interaction physiology and pathology. Neuropathol Appl Neurobiol. 1992;18:424–433. doi: 10.1111/j.1365-2990.1992.tb00808.x. [DOI] [PubMed] [Google Scholar]
- Abbott NJ, Ronnback L, Hansson E. Astrocyte-endothelial interactions at the blood-brain barrier. Nat Rev. 2006;7:41–53. doi: 10.1038/nrn1824. [DOI] [PubMed] [Google Scholar]
- Andersson A, Ronnback L, Hansson E. Lactate induces tumour necrosis factor-α and interleukin-6 release in microglial and astroglial enriched primary cultures. J Neurochem. 2005;93:1327–1333. doi: 10.1111/j.1471-4159.2005.03132.x. [DOI] [PubMed] [Google Scholar]
- Aveleira CA, Lin CM, Abcouwer SF, Ambrosio AF, Antonetti DA. TNFα signals through the PKCζ/NF-κB to alter the tight junction complex and increase retinal endothelial cell permeability. Diabetes. 2010;59:2872–2882. doi: 10.2337/db09-1606. [DOI] [PMC free article] [PubMed] [Google Scholar]
- Brown RC, Morris AP, O’Neil RG. Tight junction protein expression and barrier properties of immortalized mouse brain microvessel endothelial cells. Brain Res. 2007;1130:17–30. doi: 10.1016/j.brainres.2006.10.083. [DOI] [PMC free article] [PubMed] [Google Scholar]
- Camire RB, Beaulac HJ, Brule SA, McGregor AI, Lauria EE, Willis CL. Biphasic modulation of paracellular claudin-5 expression in mouse brain endothelial cells is mediated through the PI3K/AKT pathway. JPET. 2014;351:654–662. doi: 10.1124/jpet.114.218339. [DOI] [PMC free article] [PubMed] [Google Scholar]
- Capaldo CT, Nusrat A. Cytokine regulation of tight junctions. Biochim Biophys Acta. 2009;1788:864–871. doi: 10.1016/j.bbamem.2008.08.027. [DOI] [PMC free article] [PubMed] [Google Scholar]
- Cohen SS, Min M, Cummings EE, Chen X, Sadowska GB, Sharma S, Stonestreet BS. Effects of interleukin-6 on the expression of tight junction proteins in isolated cerebral microvessels from yearling and adult sheep. Neuroimmunomodulation. 2013;20:264–273. doi: 10.1159/000350470. [DOI] [PMC free article] [PubMed] [Google Scholar]
- Coull JA, Beggs S, Boudreau D, Boivin D, Tsuda M, Inoue K, Gravel C, Salter MW, de Koninck Y. BDNF from microglia causes the shift in neuronal anion gradient underlying neuropathic pain. Nature. 2005;438:1017–1021. doi: 10.1038/nature04223. [DOI] [PubMed] [Google Scholar]
- DeLeo JA, Tanga FY, Tawfik VL. Neuroimmune activation and neuroinflammation in chronic pain and opioid tolerance/hyperalgesia. Neuroscientist. 2004;10:40–52. doi: 10.1177/1073858403259950. [DOI] [PubMed] [Google Scholar]
- Deli MA, Abrahám CS, Kataoka Y, Niwa M. Permeability studies on in vitro blood-brain barrier models: physiology, pathology, and pharmacology. Cell Mol Neurobiol. 2005;25:59–127. doi: 10.1007/s10571-004-1377-8. [DOI] [PMC free article] [PubMed] [Google Scholar]
- Deli MA, Descamps L, Dehouck MP, Cecchelli R, Joo F, Abrahám CS, Torpier G. Exposure of tumor necrosis factor-alpha to luminal membrane of bovine brain capillary endothelial cells cocultured with astrocytes induces a delayed increase of permeability and cytoplasmic stress fiber formation of actin. J Neurosci Res. 1995;41:717–726. doi: 10.1002/jnr.490410602. [DOI] [PubMed] [Google Scholar]
- Desai TR, Leeper NJ, Hynes KL, Gewertz BL. Interleukin-6 causes endothelial barrier dysfunction via the protein kinase C pathway. J Surg Res. 2002;104:118–123. doi: 10.1006/jsre.2002.6415. [DOI] [PubMed] [Google Scholar]
- Didier N, Romero IA, Creminon C, Wijkhuisen A, Grassi J, Mabondzo A. Secretion of interleukin-1β by astrocytes mediates endothelin-1 and tumour necrosis factor-α effects on human brain microvascular endothelial cell permeability. J Neurochem. 2003;86:246–254. doi: 10.1046/j.1471-4159.2003.01829.x. [DOI] [PubMed] [Google Scholar]
- Erikson MA, Dohi K, Banks WA. Neuroinflammation: A common pathway in CNS diseases as mediated at the blood-brain barrier. Neuroimmunomodulation. 2012;19:121–130. doi: 10.1159/000330247. [DOI] [PMC free article] [PubMed] [Google Scholar]
- González-Mariscal L, Tapia R, Chamorro D. Crosstalk of tight junction components with signaling pathways. Biochim Biophys Acta. 2008;1778:729–756. doi: 10.1016/j.bbamem.2007.08.018. [DOI] [PubMed] [Google Scholar]
- Grant-Tschudy KS, Wira CR. Paracrine mediators of mouse uterine epithelial cell transepithelial resistance in culture. J Reprod Immunol. 2003;67:1–12. doi: 10.1016/j.jri.2005.06.001. [DOI] [PubMed] [Google Scholar]
- Hansson E, Ronnback L. Glial neuronal signaling in the central nervous system. FASEB J. 2003;17:341–348. doi: 10.1096/fj.02-0429rev. [DOI] [PubMed] [Google Scholar]
- Hemmings BA, Restuccia DF. PI3K-PKB/Akt pathway. Cold Spring Harb Perspect Biol. 2012;4:a011189. doi: 10.1101/cshperspect.a011189. [DOI] [PMC free article] [PubMed] [Google Scholar]
- Hollande F, Lee DJ, Choquet A, Roche S, Baldwin GS. Adherens junctions and tight junctions are regulated via different pathways by progastrin in epithelial cells. J Cell Sci. 2003;116:1187–1197. doi: 10.1242/jcs.00321. [DOI] [PubMed] [Google Scholar]
- Hurst RD, Fritz IB. Properties of an immortalised vascular endothelial glioma cell co-culture model of the blood-brain barrier. J Cell Physiol. 1996;167:81–88. doi: 10.1002/(SICI)1097-4652(199604)167:1<81::AID-JCP9>3.0.CO;2-8. [DOI] [PubMed] [Google Scholar]
- Inoue K. The function of microglia through purinergic receptors: Neuropathic pain and cytokine release. Pharmacol Ther. 2006;109:210–226. doi: 10.1016/j.pharmthera.2005.07.001. [DOI] [PubMed] [Google Scholar]
- Janzer RC, Raff MC. Astrocytes induce blood-brain barrier properties in endothelial cells. Nature. 1987;325:253–257. doi: 10.1038/325253a0. [DOI] [PubMed] [Google Scholar]
- Krum JM, Kenyon KL, Rosenstein JM. Expression of blood-barrier characteristics following neuronal loss and astroglial damage after administration of anti-thy-1 immunotoxin. Exp Neurol. 1997;146:33–45. doi: 10.1006/exnr.1997.6528. [DOI] [PubMed] [Google Scholar]
- Marano CW, Lewis SA, Garulacan LA, Soler AP, Mullin JM. Tumor necrosis factor-alpha increases sodium and chloride conductance across the tight junction of CACO-2 BBE, a human intestinal epithelial cell line. J Membr Biol. 1998;161:263–274. doi: 10.1007/s002329900333. [DOI] [PubMed] [Google Scholar]
- Mazzon E, Puzzolo D, Caputi AP, Cuzzocrea S. Role of IL-10 in hepatocyte tight junction alteration in mouse model of experimental colitis. Mol Med. 2002;8:353–366. [PMC free article] [PubMed] [Google Scholar]
- McMahon SB, Cafferty WB, Marchand F. Immune and glial cell factors as pain mediators and modulators. Exp Neurol. 2005;192:444–462. doi: 10.1016/j.expneurol.2004.11.001. [DOI] [PubMed] [Google Scholar]
- Milner R, Hung S, Wang X, Berg GI, Spatz M, del Zoppo GJ. Responses of endothelial cell and astrocyte matrix-integrin receptors to ischemia mimic those observed in the neurovascular unit. Stroke. 2008;39:191–197. doi: 10.1161/STROKEAHA.107.486134. [DOI] [PMC free article] [PubMed] [Google Scholar]
- Miron VE, Boyd A, Zhao JW, Yuen TJ, Ruckh JM, Shadrach JL, van Wijngaarden P, Wagers AJ, Williams A, Franklin RJM, ffrench-Constant C. M2 microglia and macrophages drive oligodendrocyte differentiation during CNS remyelination. Nature Neuroscience. 2013;16:1211–1220. doi: 10.1038/nn.3469. [DOI] [PMC free article] [PubMed] [Google Scholar]
- Mori O, Haseba T, Kameyama K, Shimizu H, Kudoh M, Ohaki O, Arai Y, Yamazaki M, Asano G. Histological distribution of class III alcohol dehydrogenase in human brain. Brain Res. 2000;852:186–190. doi: 10.1016/s0006-8993(99)02201-5. [DOI] [PubMed] [Google Scholar]
- Omidi Y, Campbell L, Barar J, Connell D, Akhtar S, Gumbleton M. Evaluation of the immortalised mouse brain capillary endothelial cell line, b. End3, as an in vitro blood brain barrier model for drug uptake and transport studies. Brain Res. 2003;990:95–112. doi: 10.1016/s0006-8993(03)03443-7. [DOI] [PubMed] [Google Scholar]
- Oshima T, Laroux FS, Coe LL, Morise Z, Kawachi S, Bauer P, Grisham MB, Specian RD, Carter P, Jennings S, Granger DN, Joh T, Alexander JS. Interferon-gamma and interleukin-10 reciprocally regulate endothelial junction integrity and barrier function. Microvasc Res. 2001;61:130–143. doi: 10.1006/mvre.2000.2288. [DOI] [PubMed] [Google Scholar]
- Ozaki H, Ishii K, Horiuchi H, Arai H, Kawamoto T, Okawa K, Iwamatsu A, Kita T. Cutting edge: combined treatment of TNF-alpha and IFN-gamma causes redistribution of junctional adhesion molecule in human endothelial cells. J Immunol. 1999;163:553–557. [PubMed] [Google Scholar]
- Pan W, Stone KP, Hsuchou H, Manda VK, Zhang Y. Cytokine signalling modulates blood-brain barrier function. Curr Pharm Des. 2011;17:3729–3740. doi: 10.2174/138161211798220918. [DOI] [PMC free article] [PubMed] [Google Scholar]
- Paxinos G, Wilson C. The rat brain in stereotaxic co-ordinates. 4. San Diego: Academic Press; 1998. [Google Scholar]
- Plumb J, McQuaid S, Mirakhur M, Kirk J. Abnormal endothelial tight junctions in active lesions and normal-appearing white matter in multiple sclerosis. Brain Pathol. 2002;12:154–169. doi: 10.1111/j.1750-3639.2002.tb00430.x. [DOI] [PMC free article] [PubMed] [Google Scholar]
- Prat A, Biernacki K, Wosik K, Antel JP. Glial cell influence on the human blood-brain barrier. Glia. 2001;36:145–155. doi: 10.1002/glia.1104. [DOI] [PubMed] [Google Scholar]
- Rubin LL, Barbu K, Bard F, Cannon C, Hall DE, Horner H, Janatpour M, Liaw C, Manning K, Morales J, Porter S, Tanner L, Tomaselli K, Yednock T. Differentiation of brain endothelial-cells in cell culture. Ann NY Acad Sci. 1991;633:420–425. doi: 10.1111/j.1749-6632.1991.tb15631.x. [DOI] [PubMed] [Google Scholar]
- Sawada M, Kondo N, Suzumura A, Marunouchi T. Production of tumor necrosis factor-alpha by microglia and astrocytes in culture. Brain Res. 1989;491:394–397. doi: 10.1016/0006-8993(89)90078-4. [DOI] [PubMed] [Google Scholar]
- Skamarauskas J, Carter W, Fowler M, Madjd A, Lister T, Mavroudis G, Ray DE. The selective neurotoxicity produced by 3-chloropropanediol in the rat is not a result of energy deprivation. Toxicology. 2007;232:268–276. doi: 10.1016/j.tox.2007.01.013. [DOI] [PubMed] [Google Scholar]
- Sobue K, Yamamoto N, Yoneda K, Hodgson ME, Yamashiro K, Tsuruoka N, Tsuda T, Katsuya H, Miura Y, Asai K, Kato T. Induction of blood-brain barrier properties in immortalized bovine brain endothelial cells by astrocytic factors. Neurosci Res. 1999;35:155–164. doi: 10.1016/s0168-0102(99)00079-6. [DOI] [PubMed] [Google Scholar]
- Stamatovic SM, Shakui P, Keep RF, Moore BB, Kunkel SL, van Rooijen N, Andjelkovic AV. Monocyte chemoattractant protein-1 regulation of blood-brain barrier permeability. JCBFM. 2005;25:593–606. doi: 10.1038/sj.jcbfm.9600055. [DOI] [PubMed] [Google Scholar]
- Suzuki T, Yoshinaga N, Tanabe S. Interleukin-6 (IL-6) regulates claudin-2 expression and tight junction permeability in intestinal epithelium. J Biol Chem. 2011;286:31263–31271. doi: 10.1074/jbc.M111.238147. [DOI] [PMC free article] [PubMed] [Google Scholar]
- Tao-Cheng JH, Nagy Z, Brightman MW. Tight junctions of brain endothelium in vitro are enhanced by astroglia. J Neurosci. 1987;7:3293–3299. doi: 10.1523/JNEUROSCI.07-10-03293.1987. [DOI] [PMC free article] [PubMed] [Google Scholar]
- Wang L, Srinivasan S, Theiss AL, Merlin D, Sitaraman SV. Interleukin-6 induces keratin expression in intestinal epithelial cells: potential role of keratin-8 in interleukin-6-induced barrier function alterations. J Immunol. 2007;171:3194–3201. doi: 10.1074/jbc.M604068200. [DOI] [PubMed] [Google Scholar]
- Willis CL, Brooks TA, Davis TP. Chronic inflammatory pain and the neurovascular unit: A central role for glia in maintaining BBB integrity. Curr Pharm Design. 2008;14:1625–1643. doi: 10.2174/138161208784705414. [DOI] [PubMed] [Google Scholar]
- Willis CL, Camire RB, Brule SA, Ray DE. Partial recovery of the damaged rat blood-brain barrier is mediated by adherens junction complexes, extracellular matrix remodeling, and macrophage infiltration following focal astrocyte loss. Neurosci. 2013;250:773–785. doi: 10.1016/j.neuroscience.2013.06.061. [DOI] [PMC free article] [PubMed] [Google Scholar]
- Willis CL, Leach L, Clarke GJ, Nolan CC, Ray DE. Reversible disruption of tight junction complexes in the rat blood-brain barrier, following transitory focal astrocyte loss. Glia. 2004b;48:1–13. doi: 10.1002/glia.20049. [DOI] [PubMed] [Google Scholar]
- Willis CL, Meske DS, Davis TP. Protein kinase C activation modulates reversible increase in cortical blood brain barrier permeability and tight junction protein expression during hypoxia and posthypoxic reoxygenation. JCBFM. 2010;30:1847–1859. doi: 10.1038/jcbfm.2010.119. [DOI] [PMC free article] [PubMed] [Google Scholar]
- Willis CL, Nolan CC, Reith SN, Lister T, Prior MJW, Guerin CJ, Mavroudis G, Ray DE. Focal astrocyte loss leads to microvascular damage, with subsequent repair of the blood-brain barrier without direct astrocytic contact. Glia. 2004a;45:325–337. doi: 10.1002/glia.10333. [DOI] [PubMed] [Google Scholar]