

Abstract
IMPORTANCE
Heart failure (HF) is commonly referred to as an epidemic posing major clinical and public health challenges. Yet, contemporary data on its magnitude and implications are scarce.
OBJECTIVES
To evaluate recent trends in HF incidence and outcomes, overall and by preserved (HFpEF) or reduced (HFrEF) ejection fraction.
DESIGN, SETTING, PARTICIPANTS, AND MEASUREMENTS
Incidence rates of HF in Olmsted County, Minnesota (population ~140,000), from 2000-2010 were assessed. Patients identified with incident HF (n=2,762; mean age, 76 years; 43% male) were then followed up for all-cause and cause-specific hospitalizations (through December 2012) and death (through March 2014).
RESULTS
The age- and sex-adjusted incidence of HF declined substantially (annual percent change, −4.6), equating to a rate reduction of 37% (95% confidence interval (CI): −30% to −44%) over the last decade. The incidence declined for both HF types, but was greater (P for interaction=0.08) for HFrEF (−45%, 95% CI: −33% to −55%) than HFpEF (−28%; 95% CI: −13% to −40%). Mortality was high (24% and 54% for 60 and 80 year-olds at 5 years of follow-up, respectively), frequently ascribed to non-cardiovascular causes (54%), and did not decline over time. The risk of cardiovascular mortality was lower for HFpEF than HFrEF (multivariable-adjusted hazard ratio 0.76; 95% CI: 0.64-0.90), whereas that of non-cardiovascular mortality was similar (1.07; 95% CI: 0.85-1.33). Hospitalizations were common (mean, 1.34 per person-year; 95% CI: 1.25 to 1.44), particularly among men, and did not differ between HFpEF and HFrEF. The majority of hospitalizations (63%) were due to non-cardiovascular causes. Hospitalization rates for cardiovascular causes did not change over time, whereas those for non-cardiovascular causes increased.
CONCLUSIONS AND RELEVANCE
Over the last decade, the incidence of HF declined substantially, particularly for HFrEF, contrasting with no apparent change in mortality. Non-cardiovascular conditions play an increasing role in hospitalizations and remain the most frequent cause of death. This underscores the need to augment disease-centric management approaches with holistic strategies to reduce the population burden of HF.
Heart failure (HF) is a major clinical and public health problem owing to its high prevalence, mortality, hospitalization, and healthcare expenditures.1 Accordingly, it is commonly referred to as an “epidemic”.2-4 A recent statement from the American Heart Association (AHA) forecasted the prevalence and cost of care of HF to increase markedly in the US over the next decades, reflecting the aging of the population and improving patient survival.5 However, contemporary data on key components of this epidemic are lacking. To this end, estimates of HF incidence and its temporal trends in the population are scarce and inconsistent. Data are frequently derived from hospital discharge records, self-reports or administrative databases1,6-13 and thus cannot accurately distinguish between incident and prevalent cases, have uncertain validity due to evolving coding practices,14-17 and/or cannot fully capture the burden of the disease because of the shift of care toward outpatient settings.9,18 Moreover, as HF is a syndrome and not a disease, its diagnosis is challenging, standardized diagnostic criteria are inconsistently applied, and ejection fraction (EF) is not routinely measured, precluding the study of HF with preserved EF–a major component of the HF burden.19,20 Estimates based on validated cases are now outdated21-25 and do not reflect recent changes in the key determinants of HF such as myocardial infarction and hypertension.26-28 Hence, it should come as no surprise that existing results on temporal changes in HF incidence are conflicting, with reports of increasing,23 plateau-like,22 decreasing7,9,13 or mixed trends.6,21 Most importantly, there is no current report on trends in HF incidence according to EF. This is critical because the determinants of these two conditions are likely different29,30 and might have evolved over time. Indeed, while decreasing mortality rates after HF were reported during the 1990s-early 2000s,7,9,13,22 the change in case mix with a growing proportion of HFpEF, 26,29 for which there is no specific treatment,31 might have attenuated this decline. The change in case mix might also affect hospitalization rates among HF patients, particularly in light of the major role of comorbidity, which is known to be higher in HFpEF.32
To address these gaps in knowledge, this study was designed to assess contemporary trends in the incidence of HF, validated using diagnostic criteria and categorized as HFrEF or HFpEF, and cause-specific hospitalization and mortality after its onset in a geographically defined population.
Methods
Study Setting
This study was conducted in Olmsted County, Minnesota, which has an approximate population of 144,248 according to the 2010 census, 87% of whom are Caucasian and 13% aged 65 years and older. The Olmsted County population is largely middle class, with a higher median household income ($66,252 vs. $53,054) and a lower percentage below poverty line (8.0% vs. 15.4%) than the US total population in 2010; the estimated uninsured rate is 5.0%.33 Olmsted County constitutes a highly suitable setting for epidemiological research because of its relative isolation from other urban centers and because medical care is practically self-contained within the community, with the largest healthcare provider being Mayo Clinic. Medical records from all sources of care for residents are extensively indexed and linked via the Rochester Epidemiology Project.34,35
Study Design
The study was approved by the Mayo Clinic and Olmsted Medical Center Institutional Review Boards and patients were excluded from analysis if they declined to provide Minnesota Research Authorization. The percentage of patients not providing research authorization was low overall (4%) and stable during the study period (P for trend=0.43).
A two-stage design was implemented: initially, a community surveillance study was conducted to estimate the incidence rates of HF between 2000 and 2010 in Olmsted County. Subsequently, incident HF cases enrolled in the first stage were followed up for outcomes, namely mortality and hospitalizations, in a patient-level cohort study.
Case Identification and Validation
Residents diagnosed with HF by International Classification of Diseases-9th Revision (ICD-9) code 428 between 2000 and 2010 were identified. These clinical codes were based on physician diagnoses during outpatient visits or at hospital discharge. From all patients with this code, a subset was randomly selected to undergo case validation and data abstraction (50% from 2000-2006; 100% sample from 2007-2010). Abstractors reviewed records to validate HF using Framingham criteria. These criteria require the presence of at least 2 major criteria, or 1 major criterion in addition to 2 minor criteria, to confirm HF.36 This approach was applied previously, showing minimal missing data and excellent inter-observer agreement.22 ICD-9 codes 425 (cardiomyopathy), 429.3 (cardiomegaly) and 514 (pulmonary congestion) were also reviewed as sources of potential HF cases. For each code, a random sample of 20 patients was selected and records were reviewed to validate HF using Framingham criteria. One case of validated HF was found in the cardiomyopathy and pulmonary congestion samples and no cases were found in the cardiomegaly sample, thus confirming the appropriateness of using only ICD-9 code 428 to construct the HF cohort. Patients with validated HF prior to the study period were excluded, as were nonresidents of Olmsted County.22,37
EF was measured using an approach that was recently described.38 Briefly, all echocardiograms in Olmsted County during the study period were performed at the Mayo Clinic; no other providers offered these services. The assessment of EF is based on the echocardiographer’s combination of multiple methods (M-mode or 2-dimensional echocardiography using the Quinones formula from the parasternal views or by the quantitative 2-dimensional biplane volumetric Simpson method from 4- and 2-chamber views) into an EF assessment quoted in the final impressions. The EF measurement that was closest to the HF diagnosis (applying a predefined maximum period of 90 days) was recorded for each participant. The cutoff of 50% was used to define preserved (≥50%) or reduced (<50%) EF according to the guidelines.39
Outcome Measures
Mortality
Follow-up was performed through March 2014 using the medical record. In addition to death notes in clinical care, the Mayo Clinic registration office records obituaries and local death notices, and death data are obtained quarterly from the State of Minnesota Department of Vital and Health Statistics. Information on the date of death and its underlying cause was obtained, through which deaths were classified as cardiovascular (ICD-9 390-459) and non-cardiovascular.40
Hospitalizations
Data on all-cause hospitalizations occurring after incident HF through December 2012 were obtained through the Rochester Epidemiology Project. The principal discharge diagnosis for each hospitalization was assessed using the primary ICD-9 code, which was assigned by clinical personnel after discharge and reflects the main reason for admission. The primary reason for hospitalization was divided into cardiovascular (ICD-9 390-459) and non-cardiovascular.
Patient-level Data
Baseline characteristics were abstracted from medical and administrative records. Cigarette smoking was classified as current, prior or never. Body mass index (measured as weight [kg]/height [m)]2) was calculated using the current weight and earliest available adult height measurement. Clinical definitions were used to assess whether patients had prior myocardial infarction, hypertension or hyperlipidemia. Diabetes mellitus was defined according to the American Diabetes Association or use of diabetic medications; overall comorbidity burden was assessed by the Charlson index.
Statistical Analysis
Sampling was accounted for in the analysis through weighting. Characteristics of patients with validated HF are presented as frequencies or mean values with standard deviations (SDs). Age-, sex-, and year-specific incidence rates of validated HF were calculated. The counts of validated cases, overall and by HFrEF or HFpEF, were used as the numerators, and the denominators were the Olmsted County population aged ≥20 years, as determined by census data for 2000 and 2010, with linear interpolation for the inter-census years.22 The rates were directly standardized to the age and sex distribution of the 2010 US total population. Poisson regression models were used to examine overall and category-specific average annual percentage changes and temporal trends –using 2-way interaction terms–in HF incidence rates. Based on these models, the percent changes during the entire period from 2000 to 2010 and corresponding 95% confidence intervals (CIs) were estimated. Age (as a continuous variable) and sex (when applicable) were adjusted for in the models.
Trends over time in the distribution of cardiovascular risk factors and HF characteristics were assessed with logistic regression or linear regression, as appropriate. Proportional hazards modeling was used to examine the associations of year of HF and other baseline characteristics with all-cause and cause-specific (i.e., cardiovascular and non-cardiovascular) mortality. Age-adjusted (using the following age categorization: ≤65, 66-75, 76-85, and >85 years) and multivariable-adjusted hazard ratios (HRs) for death are reported for each variable with respective 95% CIs. Age-specific 1-year and 5-year mortality rates were estimated from the proportional hazards regression models. For the latter purpose, age was modeled with both linear and quadratic terms due to its nonlinear effect on mortality.
Overall and year-specific hospitalization rates within 2 years of follow-up (last follow-up, December 2012) were estimated using negative binomial regression. Rates were estimated for all-cause and cause-specific (i.e., cardiovascular and non-cardiovascular) hospitalizations and are presented for patients 76 years of age, the mean age of this cohort. Temporal trends in hospitalization rates were examined with year as a continuous variable, after adjusting for age (as a continuous variable) and sex.
Data on EF were missing in 21% of the cases. A multiple imputation analysis was performed to impute missing EF values. Five datasets were created, with missing values replaced by imputed values based on a model that incorporated various demographic and clinical variables. The latter model included variables previously recognized as predictors of missing EF in HF41 and others identified in the present analysis. The results of these datasets were then combined using Rubin’s rules.42
Analyses were performed using SAS statistical software, version 9.3 (SAS Institute Inc., Cary, North Carolina).
Results
Between January 2000 and December 2010, 2,762 incident HF cases were estimated in the population. The mean (SD) age of the cohort was 76.4 (13.4) years and 43% were men. The proportion of subjects diagnosed as outpatients was 32%, and 53% were categorized as HFpEF.
Over time, the proportion of cases with HFpEF increased (48% in 2000-2003, 57% in 2004-2007, 52% in 2008-2010; P=0.06). The proportion of men and the prevalence of hypertension at the time of HF increased in patients with HFrEF (Table 1). Among patients with HFpEF, the prevalence of hypertension, diabetes mellitus and hyperlipidemia at the time of HF increased as did the burden of comorbid conditions.
Table 1. Characteristics of Validated Cases of Heart Failure by EFa and Year Categories, Olmsted County, Minnesota, 2000-2010.
| Reduced EF (N=985) |
Preserved EF (N=1089) |
|||||||
|---|---|---|---|---|---|---|---|---|
| Characteristic | 2000-2003 (N=377) |
2004-2007 (N=343) |
2008-2010 (N=265) |
P-valueb | 2000-2003 (N=345) |
2004-2007 (N=453) |
2008-2010 (N=291) |
P-valueb |
| Age, mean (SD), years | 72.7 (18.5) | 73.2 (20.4) | 71.7 (16.2) | 0.536 | 76.9 (16.4) | 78.5 (15.6) | 77.7 (11.5) | 0.431 |
| Male sex | 191 (50.7) | 217 (63.3) | 152 (57.4) | 0.047 | 130 (37.7) | 151 (33.3) | 107 (36.8) | 0.755 |
| White | 347 (92.0) | 329 (95.9) | 250 (94.3) | 0.164 | 315 (91.3) | 435 (96.5) | 276 (95.5) | 0.014 |
| Hypertension | 250 (66.3) | 234 (68.2) | 195 (73.6) | 0.056 | 261 (75.7) | 393 (86.8) | 260 (89.4) | <0.001 |
| Diabetes mellitus | 112 (29.7) | 88 (25.7) | 74 (27.9) | 0.543 | 66 (19.1) | 145 (32.0) | 92 (31.6) | <0.001 |
| Body mass index, mean (SD), kg/m2 | 29.5 (9.9) | 28.6 (8.9) | 29.2 (6.9) | 0.531 | 30.0 (10.9) | 30.8 (10.0) | 30.5 (8.2) | 0.432 |
| Hyperlipidemia | 248 (65.8) | 234 (68.4) | 180 (69.8) | 0.278 | 200 (58.3) | 320 (71.1) | 226 (78.2) | <0.001 |
| Smoking | 0.125 | 0.999 | ||||||
| None | 131 (34.8) | 118 (34.4) | 110 (41.5) | 161 (46.7) | 248 (54.8) | 132 (45.4) | ||
| Past | 181 (48.0) | 171 (49.9) | 113 (42.6) | 156 (45.2) | 174 (38.4) | 131 (45.0) | ||
| Current | 65 (17.2) | 54 (15.7) | 42 (15.9) | 28 (8.1) | 31 (6.8) | 28 (9.6) | ||
| Prior myocardial infarction | 94 (24.9) | 97 (28.3) | 49 (18.5) | 0.100 | 58 (16.8) | 71 (15.7) | 52 (17.9) | 0.751 |
| Prior ischemic heart disease | 150 (39.8) | 136 (39.7) | 78 (29.4) | 0.012 | 100 (29.0) | 115 (25.4) | 95 (32.7) | 0.361 |
| Charlson comorbidity index score | 0.128 | 0.002 | ||||||
| 0 | 117 (31.0) | 99 (28.9) | 75 (28.3) | 88 (25.5) | 118 (26.0) | 65 (22.3) | ||
| 1-2 | 138 (36.6) | 120 (35.0) | 86 (32.5) | 154 (44.6) | 168 (37.1) | 91 (31.3) | ||
| ≥3 | 122 (32.4) | 124 (36.2) | 104 (39.3) | 103 (29.9) | 167 (36.9) | 135 (46.4) | ||
| Outpatient diagnosis | 92 (24.4) | 76 (22.2) | 70 (26.4) | 0.638 | 88 (25.5) | 115 (25.4) | 92 (31.6) | 0.096 |
Among patients with available EF measurement
P for trend by year category.
The figures represent n (%), unless otherwise specified.
HF Incidence
The age- and sex-adjusted incidence rates of HF declined substantially over time both in absolute (Figure 1) and relative (Figure 2) terms. The overall average annual percent change was −4.6 (95% CI: −3.5 to −5.7), equating to a 37% decline over the last decade (95% CI: −30% to −44%). This decline applied to both men and women and for both HFrEF and HFpEF (Figure 1 and Figure 2). However, the magnitude of the trends differed by sex and EF. Women (overall rate change, −43%) experienced a greater decline (P for interaction=0.059) than men (−29%), and the rates of HFrEF (−45%) decreased more sharply (P for interaction=0.080) than those of HFpEF (−28%) from 2000 to 2010. The heterogeneity by EF was largely limited to women, who exhibited a markedly larger decline in incidence of HFrEF than HFpEF (−61% vs. −27%, P for interaction=0.001), compared with men (−29% vs. −27%, P for interaction=0.91), respectively (Figure 2).
Figure 1.
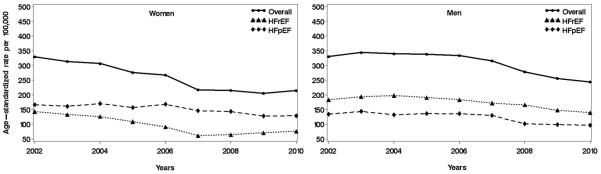
Temporal trends in heart failure incidence rates, overall and by reduced/preserved ejection fraction among women (left panel) and men (right panel) in Olmsted County, Minnesota, 2000 to 2010. Yearly rates (smoothed using 3-year moving average) per 100,000 persons have been standardized by the direct method to the age distribution of the US population in 2010.
HFrEF, heart failure with reduced ejection fraction; HFpEF, heart failure with preserved ejection fraction.
Figure 2.
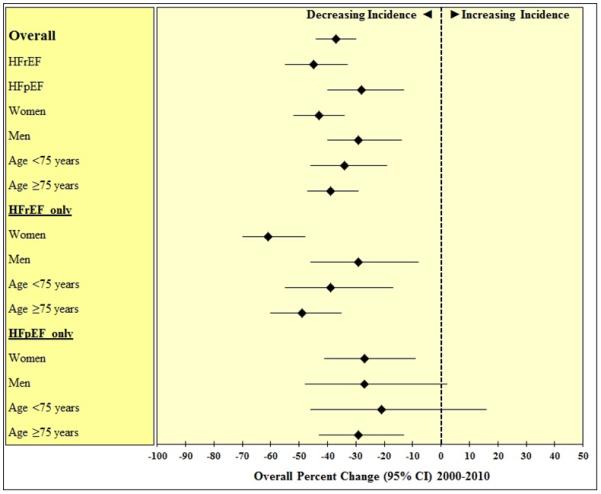
Estimated percent changes in heart failure incidence from 2000-2010 in Olmsted County, MN, overall and across specific demographic groups and heart failure types. The estimates are adjusted for age and sex (when applicable) and presented with 95% confidence intervals.
HFrEF, heart failure with reduced ejection fraction; HFpEF, heart failure with preserved ejection fraction; CI, confidence interval.
Outcomes after HF Diagnosis
Among the incident HF cases, 2,644 cases had follow-up data available for analysis. Mortality: After an average of 4.5 (SD 3.5) years of follow up, 1793 deaths were enumerated. This equated to mortality rates of 20% (95% CI 19-22%) and 53% (95% CI 51-55%) at 1 and 5 years after diagnosis, respectively. Mortality rates increased with age: for 60 year-olds the rates were 7% and 24% and for 80 years-olds they were 20% and 54% at 1 and 5 years, respectively (P<0.001). Mortality was frequently (54%) ascribed to non-cardiovascular causes. The top three categories of non-cardiovascular causes of death were respiratory (n=241[14.2% of all deaths]), neoplasm (n=215 [12.7%]) and mental/behavioral health (n=121 [7.1%]). Among those with EF measured, the top three categories for those with HFrEF were neoplasm (n=76 [12.8%]), respiratory (n=57 [9.6%]) and mental/behavioral health (n=29 [4.9%]) while for HFpEF they were respiratory (n=104 [15.6%]), neoplasm (n=83 [12.4%]) and mental/behavioral health (n=44 [6.6%]). The HRs for all-cause and cause-specific mortality associated with patient characteristics at the time of HF diagnosis are presented in Table 2. In addition to age, factors positively associated with all-cause death were diabetes mellitus, smoking, and increasing number of comorbidities. Body mass index, hyperlipidemia, HFpEF (borderline significance) and HF diagnosis at an outpatient visit showed an inverse association. In the cause-specific analysis, smoking and the comorbidity index were more strongly associated with non-cardiovascular than with cardiovascular death. Conversely, age and prior myocardial infarction were more strongly associated with cardiovascular than with non-cardiovascular death. HFpEF was inversely associated with cardiovascular death, with no apparent association with non-cardiovascular death. Outpatient diagnosis was inversely associated with both cardiovascular and non-cardiovascular mortality. No temporal trends in mortality were detected in either all-cause or cause-specific analysis.
Table 2. Hazard Ratios for Mortalitya Associated With Baseline Characteristics at the Time of Incident Heart Failure Diagnosis.
| Age-adjusted HR (95% CI) | Multivariable-adjusted HR (95% CI) | |||||
|---|---|---|---|---|---|---|
|
|
||||||
| Characteristic | All-cause death | CVD death | Non-CVD death | All-cause death | CVD death | Non-CVD death |
| Age | ||||||
| ≤65 years | 1 | 1 | 1 | 1 | 1 | 1 |
| 66-75 years | 2.07 (1.71-2.50) | 2.12 (1.55-2.90) | 2.15 (1.67-2.78) | 1.92 (1.58-2.34) | 2.09 (1.51-2.89) | 1.88 (1.44-2.46) |
| 76-85 years | 3.49 (2.95-4.14) | 4.20 (3.18-5.55) | 3.32 (2.63-4.17) | 3.20 (2.65-3.86) | 4.36 (3.22-5.90) | 2.76 (2.14-3.56) |
| <85 years | 6.56 (5.51-7.81) | 8.91 (6.73-11.80) | 5.59 (4.41-7.10) | 6.25 (5.12-7.63) | 9.97 (7.25-13.71) | 4.73 (3.61-6.22) |
| Male sex | 1.09 (0.99-1.20) | 1.19 (1.03-1.37) | 1.00 (0.88-1.15) | 1.02 (0.92-1.13) | 1.14 (0.98-1.32) | 0.95 (0.82-1.09) |
| Calendar year | ||||||
| 2000-2003 | 1 | 1 | 1 | 1 | 1 | 1 |
| 2004-2007 | 1.00 (0.90-1.11) | 1.01 (0.87-1.19) | 0.92 (0.79-1.06) | 1.04 (0.94-1.16) | 1.01 (0.86-1.19) | 0.98 (0.84-1.13) |
| 2008-2010 | 1.05 (0.91-1.20) | 0.92 (0.75-1.15) | 0.96 (0.79-1.16) | 1.07 (0.93-1.24) | 0.92 (0.74-1.15) | 1.02 (0.84-1.24) |
| Hypertension | 1.12 (0.99-1.26) | 1.12 (0.93-1.34) | 1.09 (0.92-1.28) | 1.10 (0.97-1.25) | 1.12 (0.92-1.36) | 1.04 (0.87-1.24) |
| Diabetes mellitus | 1.25 (1.12-1.39) | 1.35 (1.15-1.58) | 1.14 (0.98-1.32) | 1.13 (1.00-1.28) | 1.20 (1.00-1.45) | 1.06 (0.90-1.26) |
| BMI, 1 kg/m2 | 0.98 (0.97-0.98) | 0.99 (0.98-1.00) | 0.96 (0.95-0.97) | 0.98 (0.97-0.99) | 0.99 (0.98-1.01) | 0.97 (0.96-0.98) |
| Hyperlipidemia | 0.80 (0.72-0.88) | 0.98 (0.84-1.14) | 0.68 (0.59-0.77) | 0.71 (0.64-0.79) | 0.86 (0.73-1.02) | 0.61 (0.53-0.71) |
| Smoking | ||||||
| None | 1 | 1 | 1 | 1 | 1 | 1 |
| Past | 1.12 (1.02-1.24) | 0.96 (0.83-1.11) | 1.29 (1.12-1.48) | 1.08 (0.98-1.20) | 0.91 (0.78-1.06) | 1.28 (1.11-1.48) |
| Current | 1.37 (1.14-1.64) | 1.16 (0.86-1.56) | 1.55 (1.21-1.98) | 1.26 (1.04-1.51) | 1.12 (0.82-1.51) | 1.41 (1.09-1.82) |
| Prior MI | 1.24 (1.11-1.39) | 1.42 (1.19-1.68) | 1.21 (1.03-1.43) | 1.07 (0.95-1.21) | 1.26 (1.04-1.51) | 1.03 (0.87-1.22) |
| Charlson index | ||||||
| No comorbidity | 1 | 1 | 1 | 1 | 1 | 1 |
| Mild comorbidity | 1.34 (1.18-1.52) | 1.08 (0.90-1.31) | 1.76 (1.46-2.13) | 1.34 (1.17-1.54) | 0.99 (0.81-1.21) | 1.86 (1.53-2.27) |
| Severe comorbidity | 2.00 (1.76-2.27) | 1.71 (1.42-2.05) | 2.45 (2.03-2.96) | 1.97 (1.70-2.28) | 1.49 (1.20-1.85) | 2.64 (2.14-3.26) |
| HFpEF | 0.86 (0.77-0.97) | 0.73 (0.62-0.86) | 1.00 (0.80-1.24) | 0.89 (0.79-1.01) | 0.76 (0.64-0.90) | 1.07 (0.85-1.33) |
| Outpatient diagnosis | 0.84 (0.76-0.93) | 0.83 (0.71-0.96) | 0.80 (0.70-0.92) | 0.83 (0.75-0.92) | 0.84 (0.72-0.98) | 0.78 (0.67-0.90) |
Based on 1,793 deaths; 777 CVD and 923 non-CVD (93 were undetermined).
HR, hazard ratio; CI, confidence interval; CVD, cardiovascular disease; BMI, body mass index; MI, myocardial infarction; HFpEF, hazard ratio with preserved ejection fraction.
Hospitalizations
Overall, 4631 hospitalizations occurred during the first two years of follow-up. Hospitalizations were common (mean, 1.34 per person-year; 95% CI: 1.25 to 1.44) and the majority (63%) were due to non-cardiovascular causes. The top three causes of non-cardiovascular causes of hospitalization were categorized as respiratory (n=655[14.1% of all hospitalizations]), other symptoms, signs, abnormal findings including but not limited to alteration of consciousness, convulsions, and fever and other physiologic disturbances (n=437 [9.4%]) and injury, poisoning and other consequences of external causes (n=351 [7.6%]). For those with HFrEF, the top three causes were categorized as respiratory (n=201[11.8%]), symptoms, signs, abnormal findings (n=176 [10.4%]) and infectious and parasitic diseases (n=103 [6.1%]) while for HFpEF, they were respiratory (n=277 [13.3%]), symptoms, signs, abnormal findings (n=194 [9.3%]) and injury, poisoning and other consequences of external causes (n=186 [9.0%]). Total and cause-specific hospitalization rate estimates are presented in Table 3. A higher overall hospitalization rate was associated with male sex (particularly for non-cardiovascular causes), while age showed little association (P=0.15) (not shown). Total hospitalization rates were similar regardless of EF, with some evidence of a higher rate of cardiovascular hospitalizations among HFrEF offset by a higher rate of non-cardiovascular hospitalizations among HFpEF. Hospitalization rates did not change significantly during the study period as a result of an increase in non-cardiovascular hospitalizations combined with a small, non-significant decrease in cardiovascular hospitalizations (particularly among HFrEF cases).
Table 3. Hospitalization Rate Estimates after Heart Failure Diagnosis by Year Category Among Patients Aged 76 Yearsa.
| Rate (95% confidence interval) per person-year |
|||||
|---|---|---|---|---|---|
| Overall | 2000-2003 | 2004-2007 | 2008-2010 | P trend | |
| Total hospitalization | |||||
| Altogether | 1.34 (1.25-1.44) | 1.29 (1.14-1.46) | 1.38 (1.23-1.55) | 1.40 (1.24-1.58) | 0.27 |
| Men | 1.47 (1.31-1.65) | 1.40 (1.15-1.70) | 1.47 (1.23-1.76) | 1.67 (1.38-2.02) | 0.34 |
| Women | 1.26 (1.15-1.39) | 1.21 (1.03-1.42) | 1.34 (1.15-1.57) | 1.22 (1.05-1.42) | 0.62 |
| HFrEF | 1.38 (1.22-1.56) | 1.42 (1.16-1.73) | 1.27 (1.05-1.53) | 1.47 (1.19-1.82) | 0.91 |
| HFpEF | 1.39 (1.25-1.54) | 1.19 (0.99-1.42) | 1.57 (1.34-1.83) | 1.44 (1.22-1.70) | 0.08 |
| Cardiovascular hospitalization | |||||
| Altogether | 0.47 (0.42-0.52) | 0.49 (0.41-0.58) | 0.47 (0.40-0.55) | 0.42 (0.36-0.49) | 0.28 |
| Men | 0.49 (0.43-0.57) | 0.53 (0.41-0.68) | 0.49 (0.39-0.61) | 0.44 (0.35-0.54) | 0.44 |
| Women | 0.44 (0.38 (0.51) | 0.46 (0.37-0.58) | 0.44 (0.35-0.55) | 0.40 (0.33-0.50) | 0.40 |
| HFrEF | 0.57 (0.48-0.67) | 0.65 (0.51-0.83) | 0.51 (0.40-0.65) | 0.46 (0.38-0.57) | 0.04 |
| HFpEF | 0.46 (0.40-0.53) | 0.41 (0.32-0.51) | 0.51 (0.40-0.64) | 0.46 (0.37-0.56) | 0.45 |
| Non-cardiovascular hospitalization | |||||
| Altogether | 0.82 (0.75-0.89) | 0.75 (0.65-0.86) | 0.86 (0.75-0.98) | 0.90 (0.78-1.04) | 0.04 |
| Men | 0.90 (0.79-1.03) | 0.81 (0.65-1.01) | 0.89 (0.72-1.10) | 1.17 (0.93-1.48) | 0.12 |
| Women | 0.78 (0.70-0.87) | 0.71 (0.60-0.86) | 0.86 (0.73-1.03) | 0.75 (0.63-0.89) | 0.24 |
| HFrEF | 0.79 (0.69-0.91) | 0.77 (0.62-0.95) | 0.75 (0.58-0.97) | 0.94 (0.74-1.19) | 0.13 |
| HFpEF | 0.88 (0.78-1.00) | 0.75 (0.61-0.92) | 1.01 (0.84-1.20) | 0.91 (0.75-1.10) | 0.15 |
The mean age of this cohort.
HFrEF, heart failure with reduced ejection fraction; HFpEF, heart failure with preserved ejection fraction.
Ancillary Analyses
Several ancillary analyses were performed to assess the robustness of our results. To determine the impact of using 50% as a cutoff for defining HFrEF on the results, analyses were repeated using a cutoff of 40%. Similar trends were observed. In addition, a complete case analysis was performed where subjects with missing EF were excluded. Similar results were obtained compared to the multiple imputation analysis. HF specific hospitalizations, defined as ICD-9 code 428, were analyzed as a separate outcome. Overall, rates of HF hospitalizations over the study period remained constant (P=0.54) with no change in HFrEF (P=0.64) or HFpEF (P=0.99).
Comment
Herein, we report major changes in the epidemiology of HF in the past decade, with a large decrease in incidence and a shift toward HFpEF for which there is no specific treatment. Mortality did not change during the study period, nor did hospitalization rates, but the cause of hospitalization transitioned toward non-cardiovascular causes, likely reflecting the increasing comorbidity burden in this elderly population of patients.
Trends in Incidence
Few studies have examined trends in the incidence of HF and a recent systematic review found no evidence of any clear or consistent change in rates over time.43 Outside the US, some,7,9,13 though not all,44 studies suggested a recent decline in HF incidence in specific populations. In the US, HF hospitalizations had increased from 1979 to 2004 among patients 65 years and older,12 however more recently, a substantial decline in HF-related hospitalization rates was reported among fee-for-service Medicare beneficiaries in the US.11 Hospitalizations do not reflect incidence. Indeed, as previously reviewed,19,20 most of these data were derived from hospital discharge records or administrative databases. In these situations, standardized diagnostic criteria are not used, and case ascertainment is often affected by shifts in coding due to reimbursement incentives.14,15 The studies tend to be event based, not person based, with multiple hospitalizations counted per person.11,12 Furthermore, inpatient data, the sole information source in many reports, do not capture all cases of HF because care is increasingly delivered in the outpatient setting.9,18 Additionally, published data were frequently based on a limited run-in (“look-back”) period to distinguish incident from prevalent HF.7,13 Employing a run-in period can substantially overestimate the incidence rate if data covering a sufficient duration of time are unavailable.45 These inherent drawbacks underscore the importance of conducting population-based studies applying standardized case validation procedures in the framework of ongoing surveillance of all residents in a defined community. The few such studies available did not detect a decline in HF incidence in the past; both in the Framingham Heart Study21 and in Olmsted County22 the incidence of HF had been stable from the 1970s to the 1990s. The incidence increased only among the elderly in a study of Kaiser Permanente health plan members over that time period.23
Thus, the present findings of a major decline in HF incidence over the last decade represent a large departure from previous reports, including from our group. Although decreased incidence over the last decade occurred in all demographic groups, a less pronounced decline was observed in men compared with women. Moreover, the present study provides one of the first longitudinal reports of the trends in HF by type, information that was lacking in previous publications.19,20 We found a substantial decline over time in both HF types, yet the decline was greater for HFrEF. This in turn resulted in a change in the case mix, with a growing proportion of HFpEF for which there is no specific treatment. As it is often assumed that patients with HF and underlying coronary disease are more likely to present with reduced EF,46 the change in case mix may reflect the recent decrease in the incidence of myocardial infarction in the population,47,48 the increasing use of timely reperfusion in acute myocardial infarction and the reduced risk of HF after myocardial infarction.26 The role of changes in cardiovascular risk factors in the genesis of HF, while complex, is also important to consider. Although the prevalence of hypertension and diabetes mellitus have increased over time,1 so have the diagnostic criteria which may have resulted in detection at earlier stages. The management of these conditions has improved, leading to better outcomes as recently shown, in particular, for diabetes.49
Outcomes after HF Diagnosis
The survival of HF improved substantially during the early 1990s and early-to-mid 2000s,6,7,9,13,22 likely reflecting increased utilization of evidence-based medications (e.g., beta-blockers, angiotensin converting enzyme inhibitors, and angiotensin receptor blockers). Thereafter, as shown herein, survival after HF diagnosis seemingly leveled off, possibly reflecting the transition from HFrEF to HFpEF and the increasing comorbidity burden in HF. The increasing proportion of non-cardiovascular causes of death (neoplasm and respiratory condition) supports this hypothesis. 50
Data on the cause of hospitalization among HF patients suggest that cardiovascular hospitalizations may be noticeably less common than non-cardiovascular hospitalizations.10,37 In our study, the latter were responsible for 63% of all hospitalizations in HF. While hospitalization rates for cardiovascular causes did not change over time, the rates for non-cardiovascular causes increased, and while the range of non-cardiovascular causes is extensive, the role of respiratory conditions and symptoms is noteworthy. This shift in the distribution of the cause of hospitalizations toward non-cardiovascular causes is congruent with the major burden of comorbid conditions in HF and is critical to manage HF and interpret its outcomes. Indeed, current therapies (medications, devices, etc.) are intrinsically disease-centric and directed at reducing HF exacerbation. Thus, HF-specific hospitalizations are a key indicator of the effectiveness of HF-specific treatments, but disease-specific interventions cannot be expected to reduce all hospitalizations appreciably among persons living with HF, given the high prevalence of comorbidity in these patients. Our results support this hypothesis as cardiovascular hospitalizations declined over time among HFrEF cases, but overall hospitalization rates did not decline and non-cardiovascular hospitalizations even increased. Within this context, it is important to distinguish hospitalizations due to HF11 from all hospitalizations experienced by patients living with HF. Our study captures all hospitalizations occurring among an incidence cohort of patients living with HF and allows partitioning the cause of hospitalization. Therefore we are able to report on a trend not previously documented.
Limitations, Strengths and Implications
Some limitations should be acknowledged in interpreting these data. These results emanate from a single community, predominantly Caucasian. As in any study, the racial and ethnic composition of the population may limit the generalizability to groups underrepresented in the population. However, the population of Olmsted County, Minnesota, is representative of the state of Minnesota and the Upper Midwest region of the US.51 Furthermore, age- and sex-specific mortality rates are similar for Olmsted County, the state of Minnesota and the entire United States and broad disease trends in Olmsted County are commensurate to national trends supporting the broad relevance of our data.51 Finally, the age of our patients is representative of the broad clinical experience of patients with HF as shown, for example, in the OPTIMIZE-HF registry.52 We cannot rule out an impact of the use of tests (BNP and others) in practice on temporal trends in HF incidence. The use of tests can however operate in both directions: increasing incidence by diagnosing individuals as HF that would have been otherwise classified as non-cardiac dyspnea or ruling out HF and decreasing incidence. The study has several notable strengths. The data are recent, thus reflecting the current burden of HF in a defined community, and are comprehensive, including both inpatient and outpatient data. This is important because approximately one third of the patients in our community cohort were diagnosed in the outpatient setting. Echocardiographic data allowed examining the respective contributions of HFpEF and HFrEF to the burden of HF, which is important to understand the HF syndrome.32
Our findings document a major change in the epidemiology of HF, which is consistent with the recent changes in the epidemiology of acute coronary syndromes.47,48 The changes in heart disease over the past decades have important implications for the planning of health care delivery and utilization in communities. Indeed, further reductions in mortality and hospitalizations among patients living with HF will require concerted efforts to address multimorbidity, augmenting disease-centric therapeutic guidelines with the deployment of holistic care models. While the rationale for such strategy has been envisioned,53 the present data provide definite evidence to support a call for action in this regard.
Conclusion
We report major changes in the epidemiology of HF over the past decade with a large decrease in incidence and a change in case mix toward HFpEF for which there is no specific treatment. Mortality and hospitalizations rates remained stable while the cause of hospitalization changed with an increase in non-cardiovascular causes, likely reflecting the increasing comorbidity burden in these elderly patients. These findings have important implications to designing effective strategies to optimize the care of patients living with HF.
Acknowledgments
Dr. Roger had full access to all the data in the study and takes responsibility for the integrity of the data and the accuracy of the data analysis.
Funding/Support: This study was supported by the National Institutes of Health (R01 HL59205, R01 HL72435, and R01 HL120957), and made possible by the Rochester Epidemiology Project (R01 AG034676 from the National Institute on Aging) and the Mayo Clinic CTSA through grant number UL1 TR000135 from the National Center for Advancing Translational Sciences (NCATS), a component of the National Institutes of Health.
Role of the Sponsor: The funding source played no role in the design and conduct of the study; collection, management, analysis, and interpretation of the data; preparation, review or approval of the manuscript; and decision to submit the manuscript for publication.
Footnotes
Author Contributions:
Study concept and design: Gerber, Weston, and Roger.
Drafting of the manuscript: Gerber, Weston, Redfield, Chamberlain, Manemann, and Roger. Critical revision of the manuscript for important intellectual content: Gerber, Weston, Redfield, Chamberlain, Manemann, and Roger. Statistical analysis: Gerber, Weston, Jiang, and Killian. Obtained funding: Roger. Administrative, technical, or material support: Roger. Study supervision: Gerber, Roger.
Conflict of Interest Disclosures: The authors have no financial or other relationships that could lead to a conflict of interest.
References
- 1.Go AS, Mozaffarian D, Roger VL, et al. Heart disease and stroke statistics--2014 update: a report from the American Heart Association. Circulation. 2014;129(3):e28–e292. doi: 10.1161/01.cir.0000441139.02102.80. [DOI] [PMC free article] [PubMed] [Google Scholar]
- 2.Braunwald E. Shattuck lecture--cardiovascular medicine at the turn of the millennium: triumphs, concerns, and opportunities. N Engl J Med. 1997;337(19):1360–1369. doi: 10.1056/NEJM199711063371906. [DOI] [PubMed] [Google Scholar]
- 3.Bleumink GS, Knetsch AM, Sturkenboom MC, et al. Quantifying the heart failure epidemic: prevalence, incidence rate, lifetime risk and prognosis of heart failure The Rotterdam Study. Eur Heart J. 2004;25(18):1614–1619. doi: 10.1016/j.ehj.2004.06.038. [DOI] [PubMed] [Google Scholar]
- 4.McCullough PA, Philbin EF, Spertus JA, Kaatz S, Sandberg KR, Weaver WD. Confirmation of a heart failure epidemic: findings from the Resource Utilization Among Congestive Heart Failure (REACH) study. J Am Coll Cardiol. 2002;39(1):60–69. doi: 10.1016/s0735-1097(01)01700-4. [DOI] [PubMed] [Google Scholar]
- 5.Heidenreich PA, Albert NM, Allen LA, et al. Forecasting the impact of heart failure in the United States: a policy statement from the American Heart Association. Circ Heart Fail. 2013;6(3):606–619. doi: 10.1161/HHF.0b013e318291329a. [DOI] [PMC free article] [PubMed] [Google Scholar]
- 6.Curtis LH, Whellan DJ, Hammill BG, et al. Incidence and prevalence of heart failure in elderly persons, 1994-2003. Arch Intern Med. 2008;168(4):418–424. doi: 10.1001/archinternmed.2007.80. [DOI] [PubMed] [Google Scholar]
- 7.Jhund PS, Macintyre K, Simpson CR, et al. Long-term trends in first hospitalization for heart failure and subsequent survival between 1986 and 2003: a population study of 5.1 million people. Circulation. 2009;119(4):515–523. doi: 10.1161/CIRCULATIONAHA.108.812172. [DOI] [PubMed] [Google Scholar]
- 8.Loehr LR, Rosamond WD, Chang PP, Folsom AR, Chambless LE. Heart failure incidence and survival (from the Atherosclerosis Risk in Communities study) Am J Cardiol. 2008;101(7):1016–1022. doi: 10.1016/j.amjcard.2007.11.061. [DOI] [PubMed] [Google Scholar]
- 9.Yeung DF, Boom NK, Guo H, Lee DS, Schultz SE, Tu JV. Trends in the incidence and outcomes of heart failure in Ontario, Canada: 1997 to 2007. CMAJ. 2012;184(14):E765–773. doi: 10.1503/cmaj.111958. [DOI] [PMC free article] [PubMed] [Google Scholar]
- 10.Blecker S, Paul M, Taksler G, Ogedegbe G, Katz S. Heart failure associated hospitalizations in the United States. J Am Coll Cardiol. 2013;61(12):1259–1267. doi: 10.1016/j.jacc.2012.12.038. [DOI] [PMC free article] [PubMed] [Google Scholar]
- 11.Chen J, Normand SL, Wang Y, Krumholz HM. National and regional trends in heart failure hospitalization and mortality rates for Medicare beneficiaries, 1998-2008. JAMA. 2011;306(15):1669–1678. doi: 10.1001/jama.2011.1474. [DOI] [PMC free article] [PubMed] [Google Scholar]
- 12.Fang J, Mensah GA, Croft JB, Keenan NL. Heart failure-related hospitalization in the U.S., 1979 to 2004. J Am Coll Cardiol. 2008;52(6):428–434. doi: 10.1016/j.jacc.2008.03.061. [DOI] [PubMed] [Google Scholar]
- 13.Teng TH, Finn J, Hobbs M, Hung J. Heart failure: incidence, case fatality, and hospitalization rates in Western Australia between 1990 and 2005. Circ Heart Fail. 2010;3(2):236–243. doi: 10.1161/CIRCHEARTFAILURE.109.879239. [DOI] [PubMed] [Google Scholar]
- 14.Assaf AR, Lapane KL, McKenney JL, Carleton RA. Possible influence of the prospective payment system on the assignment of discharge diagnoses for coronary heart disease. N Engl J Med. 1993;329(13):931–935. doi: 10.1056/NEJM199309233291307. [DOI] [PubMed] [Google Scholar]
- 15.Jollis JG, Ancukiewicz M, DeLong ER, Pryor DB, Muhlbaier LH, Mark DB. Discordance of databases designed for claims payment versus clinical information systems. Implications for outcomes research. Ann Intern Med. 1993;119(8):844–850. doi: 10.7326/0003-4819-119-8-199310150-00011. [DOI] [PubMed] [Google Scholar]
- 16.Psaty BM, Boineau R, Kuller LH, Luepker RV. The potential costs of upcoding for heart failure in the United States. Am J Cardiol. 1999;84(1):108–109. A109. doi: 10.1016/s0002-9149(99)00205-2. [DOI] [PubMed] [Google Scholar]
- 17.Quach S, Blais C, Quan H. Administrative data have high variation in validity for recording heart failure. Can J Cardiol. 2010;26(8):306–312. doi: 10.1016/s0828-282x(10)70438-4. [DOI] [PMC free article] [PubMed] [Google Scholar]
- 18.Ezekowitz JA, Kaul P, Bakal JA, Quan H, McAlister FA. Trends in heart failure care: has the incident diagnosis of heart failure shifted from the hospital to the emergency department and outpatient clinics? Eur J Heart Fail. 2011;13(2):142–147. doi: 10.1093/eurjhf/hfq185. [DOI] [PubMed] [Google Scholar]
- 19.Roger VL. Epidemiology of heart failure. Circ Res. 2013;113(6):646–659. doi: 10.1161/CIRCRESAHA.113.300268. [DOI] [PMC free article] [PubMed] [Google Scholar]
- 20.Bui AL, Horwich TB, Fonarow GC. Epidemiology and risk profile of heart failure. Nat Rev Cardiol. 2011;8(1):30–41. doi: 10.1038/nrcardio.2010.165. [DOI] [PMC free article] [PubMed] [Google Scholar]
- 21.Levy D, Kenchaiah S, Larson MG, et al. Long-term trends in the incidence of and survival with heart failure. N Engl J Med. 2002;347(18):1397–1402. doi: 10.1056/NEJMoa020265. [DOI] [PubMed] [Google Scholar]
- 22.Roger VL, Weston SA, Redfield MM, et al. Trends in heart failure incidence and survival in a community-based population. JAMA. 2004;292(3):344–350. doi: 10.1001/jama.292.3.344. [DOI] [PubMed] [Google Scholar]
- 23.Barker WH, Mullooly JP, Getchell W. Changing incidence and survival for heart failure in a well-defined older population, 1970-1974 and 1990-1994. Circulation. 2006;113(6):799–805. doi: 10.1161/CIRCULATIONAHA.104.492033. [DOI] [PubMed] [Google Scholar]
- 24.Bahrami H, Kronmal R, Bluemke DA, et al. Differences in the incidence of congestive heart failure by ethnicity: the multi-ethnic study of atherosclerosis. Arch Intern Med. 2008;168(19):2138–2145. doi: 10.1001/archinte.168.19.2138. [DOI] [PMC free article] [PubMed] [Google Scholar]
- 25.Goldberg RJ, Spencer FA, Farmer C, Meyer TE, Pezzella S. Incidence and hospital death rates associated with heart failure: a community-wide perspective. Am J Med. 2005;118(7):728–734. doi: 10.1016/j.amjmed.2005.04.013. [DOI] [PubMed] [Google Scholar]
- 26.Gerber Y, Weston SA, Berardi C, et al. Contemporary trends in heart failure with reduced and preserved ejection fraction after myocardial infarction: a community study. Am J Epidemiol. 2013;178(8):1272–1280. doi: 10.1093/aje/kwt109. [DOI] [PMC free article] [PubMed] [Google Scholar]
- 27.He J, Ogden LG, Bazzano LA, Vupputuri S, Loria C, Whelton PK. Risk factors for congestive heart failure in US men and women: NHANES I epidemiologic follow-up study. Arch Intern Med. 2001;161(7):996–1002. doi: 10.1001/archinte.161.7.996. [DOI] [PubMed] [Google Scholar]
- 28.Dunlay SM, Weston SA, Jacobsen SJ, Roger VL. Risk factors for heart failure: a population-based case-control study. Am J Med. 2009;122(11):1023–1028. doi: 10.1016/j.amjmed.2009.04.022. [DOI] [PMC free article] [PubMed] [Google Scholar]
- 29.Owan TE, Hodge DO, Herges RM, Jacobsen SJ, Roger VL, Redfield MM. Trends in prevalence and outcome of heart failure with preserved ejection fraction. N Engl J Med. 2006;355(3):251–259. doi: 10.1056/NEJMoa052256. [DOI] [PubMed] [Google Scholar]
- 30.Bhatia RS, Tu JV, Lee DS, et al. Outcome of heart failure with preserved ejection fraction in a population-based study. N Engl J Med. 2006;355(3):260–269. doi: 10.1056/NEJMoa051530. [DOI] [PubMed] [Google Scholar]
- 31.Borlaug BA, Paulus WJ. Heart failure with preserved ejection fraction: pathophysiology, diagnosis, and treatment. Eur Heart J. 2011;32(6):670–679. doi: 10.1093/eurheartj/ehq426. [DOI] [PMC free article] [PubMed] [Google Scholar]
- 32.Fonarow GC, Stough WG, Abraham WT, et al. Characteristics, treatments, and outcomes of patients with preserved systolic function hospitalized for heart failure: a report from the OPTIMIZE-HF Registry. J Am Coll Cardiol. 2007;50(8):768–777. doi: 10.1016/j.jacc.2007.04.064. [DOI] [PubMed] [Google Scholar]
- 33.United States Census Bureau [Accessed December 11, 2014];American Fact Finder. http://factfinder.census.gov/faces/nav/jsf/pages/community_facts.xhtml
- 34.Melton LJ., 3rd. History of the Rochester Epidemiology Project. Mayo Clin Proc. 1996;71(3):266–274. doi: 10.4065/71.3.266. [DOI] [PubMed] [Google Scholar]
- 35.Rocca WA, Yawn BP, St Sauver JL, Grossardt BR, Melton LJ. History of the Rochester Epidemiology Project: Half a Century of Medical Records Linkage in a US Population. Mayo Clin Proc. 2012;87(12):1202–1213. doi: 10.1016/j.mayocp.2012.08.012. [DOI] [PMC free article] [PubMed] [Google Scholar]
- 36.McKee PA, Castelli WP, McNamara PM, Kannel WB. The natural history of congestive heart failure: the Framingham study. N Engl J Med. 1971;285(26):1441–1446. doi: 10.1056/NEJM197112232852601. [DOI] [PubMed] [Google Scholar]
- 37.Dunlay SM, Redfield MM, Weston SA, et al. Hospitalizations after heart failure diagnosis a community perspective. J Am Coll Cardiol. 2009;54(18):1695–1702. doi: 10.1016/j.jacc.2009.08.019. [DOI] [PMC free article] [PubMed] [Google Scholar]
- 38.Dunlay SM, Roger VL, Weston SA, Jiang R, Redfield MM. Longitudinal changes in ejection fraction in heart failure patients with preserved and reduced ejection fraction. Circ Heart Fail. 2012;5(6):720–726. doi: 10.1161/CIRCHEARTFAILURE.111.966366. [DOI] [PMC free article] [PubMed] [Google Scholar]
- 39.Yancy CW, Jessup M, Bozkurt B, et al. 2013 ACCF/AHA guideline for the management of heart failure: a report of the American College of Cardiology Foundation/American Heart Association Task Force on practice guidelines. Circulation. 2013;128(16):e240–327. doi: 10.1161/CIR.0b013e31829e8776. [DOI] [PubMed] [Google Scholar]
- 40.Gerber Y, Jacobsen SJ, Frye RL, Weston SA, Killian JM, Roger VL. Secular trends in deaths from cardiovascular diseases: a 25-year community study. Circulation. 2006;113(19):2285–2292. doi: 10.1161/CIRCULATIONAHA.105.590463. [DOI] [PubMed] [Google Scholar]
- 41.Kurtz CE, Gerber Y, Weston SA, Redfield MM, Jacobsen SJ, Roger VL. Use of ejection fraction tests and coronary angiography in patients with heart failure. Mayo Clin Proc. 2006;81(7):906–913. doi: 10.4065/81.7.906. [DOI] [PubMed] [Google Scholar]
- 42.Rubin DB. Multiple Imputation for Nonresponse in Surveys. J. Wiley & Sons; New York: 1987. [Google Scholar]
- 43.Najafi F, Jamrozik K, Dobson AJ. Understanding the ‘epidemic of heart failure’: a systematic review of trends in determinants of heart failure. Eur J Heart Fail. 2009;11(5):472–479. doi: 10.1093/eurjhf/hfp029. [DOI] [PubMed] [Google Scholar]
- 44.Mehta PA, Dubrey SW, McIntyre HF, et al. Improving survival in the 6 months after diagnosis of heart failure in the past decade: population-based data from the UK. Heart. 2009;95(22):1851–1856. doi: 10.1136/hrt.2008.156034. [DOI] [PubMed] [Google Scholar]
- 45.Brameld KJ, Holman CD, Lawrence DM, Hobbs MS. Improved methods for estimating incidence from linked hospital morbidity data. Int J Epidemiol. 2003;32(4):617–624. doi: 10.1093/ije/dyg191. [DOI] [PubMed] [Google Scholar]
- 46.Sutton MG, Sharpe N. Left ventricular remodeling after myocardial infarction: pathophysiology and therapy. Circulation. 2000;101(25):2981–2988. doi: 10.1161/01.cir.101.25.2981. [DOI] [PubMed] [Google Scholar]
- 47.Yeh RW, Sidney S, Chandra M, Sorel M, Selby JV, Go AS. Population trends in the incidence and outcomes of acute myocardial infarction. N Engl J Med. 2010;362(23):2155–2165. doi: 10.1056/NEJMoa0908610. [DOI] [PubMed] [Google Scholar]
- 48.Roger VL, Weston SA, Gerber Y, et al. Trends in incidence, severity, and outcome of hospitalized myocardial infarction. Circulation. 2010;121(7):863–869. doi: 10.1161/CIRCULATIONAHA.109.897249. [DOI] [PMC free article] [PubMed] [Google Scholar]
- 49.Gregg EW, Li Y, Wang J, et al. Changes in diabetes-related complications in the United States, 1990-2010. N Engl J Med. 2014;370(16):1514–1523. doi: 10.1056/NEJMoa1310799. [DOI] [PubMed] [Google Scholar]
- 50.Henkel DM, Redfield MM, Weston SA, Gerber Y, Roger VL. Death in heart failure: a community perspective. Circ Heart Fail. 2008;1(2):91–97. doi: 10.1161/CIRCHEARTFAILURE.107.743146. [DOI] [PMC free article] [PubMed] [Google Scholar]
- 51.St Sauver JL, Grossardt BR, Leibson CL, Yawn BP, Melton LJ, 3rd, Rocca WA. Generalizability of epidemiological findings and public health decisions: an illustration from The Rochester Epidemiology Project. Mayo Clin Proc. 2012;87(2):151–160. doi: 10.1016/j.mayocp.2011.11.009. [DOI] [PMC free article] [PubMed] [Google Scholar]
- 52.Abraham WT, Fonarow GC, Albert NM, et al. Predictors of in-hospital mortality in patients hospitalized for heart failure: insights from the Organized Program to Initiate Lifesaving Treatment in Hospitalized Patients with Heart Failure (OPTIMIZE-HF) J Am Coll Cardiol. 2008;52(5):347–356. doi: 10.1016/j.jacc.2008.04.028. [DOI] [PubMed] [Google Scholar]
- 53.Sochalski J, Jaarsma T, Krumholz HM, et al. What works in chronic care management: the case of heart failure. Health Aff (Millwood) 2009;28(1):179–189. doi: 10.1377/hlthaff.28.1.179. [DOI] [PubMed] [Google Scholar]