

Abstract
Rationale: Hypoxia promotes dormancy by causing physiologic changes to actively replicating Mycobacterium tuberculosis. DosR controls the response of M. tuberculosis to hypoxia.
Objectives: To understand DosR's contribution in the persistence of M. tuberculosis, we compared the phenotype of various DosR regulon mutants and a complemented strain to M. tuberculosis in macaques, which faithfully model M. tuberculosis infection.
Methods: We measured clinical and microbiologic correlates of infection with M. tuberculosis relative to mutant/complemented strains in the DosR regulon, studied lung pathology and hypoxia, and compared immune responses in lung using transcriptomics and flow cytometry.
Measurements and Main Results: Despite being able to replicate initially, mutants in DosR regulon failed to persist or cause disease. On the contrary, M. tuberculosis and a complemented strain were able to establish infection and tuberculosis. The attenuation of pathogenesis in animals infected with the mutants coincided with the appearance of a Th1 response and organization of hypoxic lesions wherein M. tuberculosis expressed dosR. The lungs of animals infected with the mutants (but not the complemented strain) exhibited early transcriptional signatures of T-cell recruitment, activation, and proliferation associated with an increase of T cells expressing homing and proliferation markers.
Conclusions: Delayed adaptive responses, a hallmark of M. tuberculosis infection, not only lead to persistence but also interfere with the development of effective antituberculosis vaccines. The DosR regulon therefore modulates both the magnitude and the timing of adaptive immune responses in response to hypoxia in vivo, resulting in persistent infection. Hence, DosR regulates key aspects of the M. tuberculosis life cycle and limits lung pathology.
Keywords: tuberculosis, hypoxia, modulation, T-cell response, nonhuman primate
At a Glance Commentary
Scientific Knowledge on the Subject
Mycobacterium tuberculosis induces the DosR regulon to cope with hypoxia to persist within pulmonary caseous granulomas. Mutants in the regulon are essential for the long-term persistence but not the initial survival of the pathogen in human-like infection. This persistence defect coincides with the advent of a T-cell response and with granuloma formation.
What This Study Adds to the Field
We show a previously unappreciated role for DosR in modulating host T-cell responses against M. tuberculosis infection, allowing it to persist.
Mycobacterium tuberculosis infection leads to active tuberculosis (ATB) in a subset of infected individuals, whereas most exhibit latent TB infection (LTBI) (1), which coincides with a physiologic shift of replicating bacilli toward dormancy (latency) characterized by bacterial persistence (2). TB granulomas are hypoxic and this is a key signal for dormancy. M. tuberculosis responds to hypoxia through the DosR regulon (2–7), which is activated by kinases DosS and DosT (8–10). It is believed that this regulon is crucial for M. tuberculosis to persist in lung lesions (11). However, in both SCID (12) and C57Bl/6 (2) mice, the Δ-dosR mutant did not exhibit reduced virulence, suggesting that this is caused by lack of hypoxia in these mice (13). In guinea pigs and rabbits, where lesions are hypoxic, mutants in DosR exhibited reduced infection levels (14–16). Because macaques are arguably the most humanlike of all experimental models (17), we conducted a conclusive assessment of the role played by the DosR regulon (18–22). We suggest a previously unappreciated role for DosR in modulating adaptive immune responses to M. tuberculosis.
Methods
Animals
Naive Indian rhesus macaques free of mycobacterial infection (17–23) were exposed to wild-type (WT) M. tuberculosis (H37Rv) (n = 6), the Δ-dosS/Δ-dosT double mutant (n = 6), and the Δ-dosS (n = 5), Δ-dosT (n = 5), and Δ-dosR (n = 5) mutants as well as a Δ-dosR-complemented strain (Comp) (n = 5) (8) via aerosol such that approximately 50–100 CFU were deposited into the lungs of each animal. Clinical procedures have been described (17–22, 24). Tuberculin skin test (TST) was performed before (Week 2) and after (Weeks 3 and 7) infection. Blood was drawn weekly for complete blood count and chemistry, and bronchoalveolar lavage (BAL) was obtained at Weeks 3, 7, 10, and 15 as described previously (17–22). Chest radiographs (CXRs) were obtained at Weeks 7 and 15 postinfection and analyzed as previously described (21). Animals were killed due to signs of TB as previously described (21).
Laboratory Procedures
Bacterial load was measured in BAL over time and tissues at necropsy (17–22, 24, 25). Pathologic examination of lesions in lungs and other tissues was performed (17–23), using unbiased stereologic sampling (26, 27). Hypoxia was assessed in tissues by intravenously injecting 20 mg/kg Hypoxyprobe-1 (pimidazole hydrochloride [PIMO]; coupled to Daylight Red; Hypoxyprobe Inc., Burlington, MA) (28) into the animals 24 hours before they were killed (14). RNA amplified from dissected paraffin-embedded lung sections (29) was subjected to M. tuberculosis microarray analysis (30). In situ hybridizations (ISH), designed to detect M. tuberculosis–specific transcripts within lesions (31), used probes (32) specific for dosS and dosR. Host transcriptomics was performed on BAL obtained 3 weeks after infection from three animals each, infected with WT M. tuberculosis, M. tuberculosis:Δ-dosS, M. tuberculosis:Δ-dosT, and Comp strains, relative to preinfection samples, to correlate immune responses in the lungs of infected macaques (19, 21, 22, 33, 34). Enrichment analysis using DAVID (Database for Annotation, Visualization, and Integrated Discovery) (35) and Ingenuity Pathway Analysis (IPA) (22) identified categories perturbed at significantly higher frequency (25). Quantitative reverse-transcriptase polymerase chain reaction was performed on BAL-derived cDNA (36). Flow cytometry was performed using blood, BAL, and lung (22, 37–39). Statistical comparisons used analysis of variance with Sidak correction for multiple correction.
Results
Clinical Correlates
All animals were successfully infected, as judged by positive TST reaction (see Figure E1 in the online supplement). Most of the M. tuberculosis–infected macaques slowly developed pulmonary TB. Thus, four of six animals in this group experienced increased body temperatures, such that by Week 16 postinfection, these animals had pyrexia relative to baseline (>2°F) (Figure 1A). The same animals also experienced progressive weight loss such that by Week 16, M. tuberculosis infection resulted in the loss of approximately 10% of body-weight (Figure 1B). In contrast, loss of DosR-pathway abrogated clinical signs of TB (Figures 1A and 1B). At Week 16, the elevated temperature and the decrease in body weight in the WT M. tuberculosis–infected group was statistically significant, when compared with any of the mutant-infected groups (Figures 1A and 1B). Furthermore, the differences in both the body temperature (P = 0.0190) and body weight (P = 0.0027) at Week 16 in the WT M. tuberculosis–infected group, but not in animals infected with any of the mutant strains, were statistically significant relative to preinfection values (Figures 1A and 1B).
Figure 1.

Clinical correlates of infection. Changes in body temperature (in degrees Fahrenheit) relative to preinfection values (A), in body weight as a percentage of the last preinfection body weight (B), and changes in serum C-reactive protein (CRP) (mg/ml) (C) levels are shown for groups of macaques infected with wild-type (WT) Mycobacterium tuberculosis (red) (n = 6), M. tuberculosis:Δ-dosR (black) (n = 5), M. tuberculosis:Δ-dosS (blue) (n = 5), M. tuberculosis:Δ-dosT (green) (n = 5), M. tuberculosis:Δ-dosS/Δ-dosT (pink) (n = 6), and M. tuberculosis:Δ-dosR(Comp) (magenta) (n = 5) at 3, 7, 11, and 15 weeks postinfection. (A) At Week 16, the differences between the WT M. tuberculosis–infected group and the mutant-infected groups were statistically significant for body temperatures, with multiple comparison adjusted P values of 0.0362 (Δ-dosR), 0.0126 (Δ-dosS), 0.0362 (Δ-dosT), and 0.0107 (Δ-dosS/Δ-dosT). However, the difference between the WT M. tuberculosis–infected and the Comp-infected group was not significant (P = 0.8592). (B) At Week 16, the differences between the M. tuberculosis–infected group and the mutant-infected groups were also statistically significant for change in body weight percentages, with multiple comparison adjusted P values of 0.0005 (Δ-dosR), 0.0193 (Δ-dosS), 0.0171 (Δ-dosT), and 0.0209 (Δ-dosS/Δ-dosT). Again, however, the difference between the WT M. tuberculosis– and the Comp-infected group was not significant (P = 0.9284). (C) At Week 16, the differences between the WT M. tuberculosis–infected group and the mutant-infected groups were also statistically significant for serum CRP levels, with multiple comparison adjusted P < 0.0001 for the following comparisons: Δ-dosR, Δ-dosS, Δ-dosT, and Δ-dosS/Δ-dosT. Again, however, the difference between the WT M. tuberculosis– and the Comp-infected group was not significant (P = 0.8728). The difference in the levels of CRP at Week 16 in the WT M. tuberculosis group was also significant to baseline (P = 0.0141). (D) Chest radiograph (CXR) scores (range, 0–4) are shown for 7 and 15 weeks postinfection for the same groups of animals. CXR scores were obtained in a blinded fashion by a group of veterinarians who scored these based on the extent of involvement on radiographs. Thus, a score of 0 represents no involvement; 1, minimal involvement; 2, moderate; 3, severe; and 4, miliary presentation. At the later time point, the differences between the WT M. tuberculosis–infected group and the mutant-infected groups were also statistically significant for CXR, with multiple arison adjusted P values: 0.0436 for Δ-dosR, Δ-dosS, and Δ-dosT; 0.0335 for Δ-dosS/Δ-dosT. Again, however, the difference between the WT M. tuberculosis– and the Comp-infected group was not significant (P = 0.1067). Statistical significance was obtained using a one-way analysis of variance with Sidak correction. (E) Survival proportions for the various groups of macaques (infected with WT M. tuberculosis [red], M. tuberculosis:Δ-dosR [black], M. tuberculosis:Δ-dosS [blue], M. tuberculosis:Δ-dosT [green], M. tuberculosis:Δ-dosS/Δ-dosT [pink], and M. tuberculosis:Δ-dosR(Comp) [magenta]) are shown as a Kaplan-Meier plot. Humane killing was performed because of a combination of predefined conditions associated with tuberculosis (TB). No killing was necessary for any of the animals in the groups apart from those infected with M. tuberculosis, where four out of six animals were killed because of TB disease progression during the 6-month protocol. *P < 0.05; **P < 0.005; ***P < 0.0005; ****P < 0.00005; ns = not significant.
Complementation of mutations in DosR regulon reversed the lack of disease features. Thus, in four of five animals infected with Δ-dosR(Comp), higher temperature and greater weight loss were observed. The differences between this and the M. tuberculosis–infected group were not significant (Figures 1A and 1B). Four of six WT M. tuberculosis– and four of five Δ-dosR(Comp)–infected animals also exhibited increased serum C-reactive protein (CRP) values compared with preinfection beginning at 7 weeks after infection (Figure 1C). At Week 15 (or endpoint if it occurred earlier) the elevated CRP levels in the WT M. tuberculosis–infected nonhuman primates (NHPs) relative to baseline was statistically significant (P < 0.05). In contrast, animals infected with the mutants in the DosR pathway exhibited baseline levels of serum CRP throughout the study, and the difference between CRP levels in any of the mutant-infected groups was not statistically significant at any time points.
Differences in CRP levels in the serum of M. tuberculosis–infected animals was statistically significant at Week 15/endpoint relative to infection with each of the mutant strains (P < 0.00005), but not when compared with the Δ-dosR(Comp)–infected group (P = 0.8728) (Figure 1C). CXRs were obtained at Weeks 7 and 15/endpoint (Figure 1D). Relative to baseline, four of six WT M. tuberculosis–infected animals exhibited mild radiographic lesions at Week 7 and three of these animals had moderate to severe radiographic lesions by Week 15. In contrast only one animal in any mutant-infected group had any radiographic lesions at Week 7, which resolved by Week 15. The difference in CXR scores between animals infected with WT M. tuberculosis and the Δ-dosR, Δ-dosS, and Δ-dosS/Δ-dosT strains was statistically significant at Week 7 (P < 0.05) and Week 15 (P < 0.005) (Figure 1D). Animals infected with the Comp strain also exhibited CXR scores comparable with M. tuberculosis infection (Figure 1D) and differences between these groups were statistically insignificant.
Four WT M. tuberculosis–infected animals, which exhibited clinical signs of TB, needed to be killed at Days 117, 128, 132, and 175 (Figure 1E; see Figure E1). Two animals in this group maintained LTBI, with TST positivity without any clinical evidence of TB. None of the animals infected with any of the mutants, however, developed clinical disease. Of the five animals infected with the Δ-dosR(Comp) strain, two developed early TB, being killed at 65 and 74 days, respectively, whereas two more animals succumbed to disease at 113 and 145 days, respectively. One animal maintained asymptomatic LTBI throughout (Figure 1E; see Figure E1). Thus, survival differences between the M. tuberculosis–infected group and the groups infected with the mutants in the DosR regulon, together, were statistically significant (P = 0.0002, Wilcoxon; P = 0.0005, log-rank). The difference between the survival of the WT M. tuberculosis–infected and the Δ-dosS/Δ-dosT–infected macaques was significant (P = 0.03), whereas the differences between M. tuberculosis–infected animals and remaining groups individually approached significance (P = 0.08). The difference between the WT M. tuberculosis– and the Comp-infected groups, however, was insignificant (P = 0.21).
Bacterial Burdens
Bacterial loads were analyzed in the BAL at Weeks 3, 7, and 10 (Figure 2A). At the earliest time point, Δ-dosR, Δ-dosS, and Δ-dosT mutants as well as the Δ-dosR(Comp) strain were detected at a comparable level relative to M. tuberculosis, indicating successful replication by these strains. However, at the two latter time points, higher replication of M. tuberculosis relative to all of the mutant strains was observed and at Week 11, differences between the M. tuberculosis– and each of the individual mutant-infected groups were statistically significant (P < 0.005 in each case). On the contrary, the higher levels of replication of the complemented strain were observed in BAL throughout, such that at Week 11, BAL CFUs in this group were essentially similar to the WT M. tuberculosis group (P = 0.9653) (Figure 2A).
Figure 2.

Bacterial burden. (A) Total bacterial burdens in the bronchoalveolar lavage (BAL) of animals infected with wild-type Mycobacterium tuberculosis (red), M. tuberculosis:Δ-dosR (black), M. tuberculosis:Δ-dosS (blue), M. tuberculosis:Δ-dosT (green), M. tuberculosis:Δ-dosS/Δ-dosT (pink), and M. tuberculosis:Δ-dosR(Comp) (magenta) over the course of time. Numbers on the x-axis denote weeks postinfection. (B) Bacterial burden per gram of lung tissue in different groups was analyzed for four random sample pools for each animal at the time of killing. Numbers on the x-axis denote weeks postinfection. (C) Bacterial burden per gram of bronchial lymph node tissue in different groups was analyzed for two samples for each animal at the time of killing. *P < 0.05; ****P < 0.00005. ns = not significant.
At necropsy, the total bacterial burdens were also studied for each of the animals in the lungs (21). Statistically significant differences (P < 0.05) existed between the bacterial burden of WT M. tuberculosis– and mutant-infected groups in the lungs and lymph nodes (Figures 2B and 2C). The average lung burden of 10E4–10E5 CFU/g in WT M. tuberculosis– and Comp-infected animals was at least 100-fold in excess of the burdens in animals infected with any of the mutant strains. Thus, bacterial burden in the tissues of animals infected with Comp was indistinguishable from that of M. tuberculosis–infected animals (Figures 2B and 2C). For the mutant strains, the highest bacterial was observed in the lungs of animals infected with the Δ-dosR mutant, followed by the Δ-dosT, Δ-dosS, and Δ-dosS/Δ-dosT (Figure 2B), although these differences were not statistically significant. In the bronchial lymph nodes (Figure 2C), a load comparable with lungs (>10E4 CFU/g) was present in WT M. tuberculosis– and Comp-infected animals, whereas no bacilli could be detected at necropsy of macaques infected with any of the mutants. Although a low level of dissemination to spleen, liver, and kidney was observed in animals infected with M. tuberculosis as well as Δ-dosR(Comp), no dissemination occurred following infection with any of the dos-mutant strains (see Figure E2).
Pulmonary Pathology
Granulomatous pathology correlated highly with clinical disease and bacterial burden. Grossly, WT M. tuberculosis–infected animals exhibited two different outcomes: in animals with ATB we observed extensive multilobe consolidation and tuberculous pathology characterized by the presence of numerous coalescing lesions in each lobe that were 3–6 mm in diameter (Figure 3A), whereas in the animals with LTBI we observed minimal pathology characterized by occasional, scattered approximately 1-mm diameter granulomas (Figure 3B). In contrast, in animals infected with Δ-dosR (Figure 3C), Δ-dosT (Figure 3D), or Δ-dosS (not shown), little or no evidence of TB-related pathology was present. However, granulomatous inflammation comparable with M. tuberculosis infection was observed in the lungs of animals infected with the complemented strain (Figure 3E). These animals largely exhibited the presence of classical, centrally necrotic lesions measuring 3–6 mm in diameter.
Figure 3.
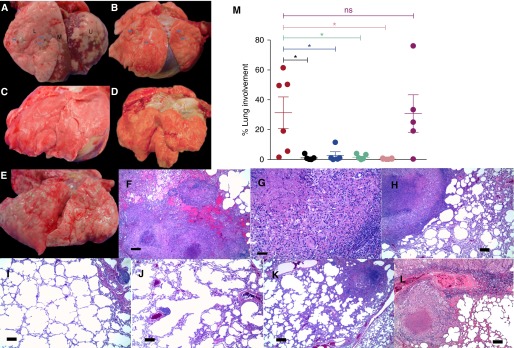
(A–E) Gross pathology. Infection with wild-type (WT) Mycobacterium tuberculosis resulted in two different pathologic outcomes that were grossly visible. For the animals with high bacterial burden, we observed large areas of granulomatous pathology (arrows) resulting in lung consolidation (A), whereas for the animals that exhibited latent tuberculosis infection, we observed several focal lesions (arrows) in the lung (B). Animals infected with Δ-dosR (C), Δ-dosT (D), Δ-dosS (not shown), and Δ-dosS/Δ-dosT exhibited minimal to no pathologic changes. Significant gross pathology could be observed for animals infected with the Δ-dosR(Comp) strain (E). (F–M) Histopathology. The lungs of WT M. tuberculosis–infected animals with active tuberculosis contained numerous granulomas each >5 mm in size that in some areas were coalescing (F and G). In contrast, animals that controlled M. tuberculosis infection well exhibited discrete, centrally caseous granulomas with distinct macrophage and lymphocyte-enriched layers (H). Conversely, animals infected with Δ-dosS (I), Δ-dosR (J), and Δ-dosT (K) exhibited largely normal lung architecture with rare organization of lymphoid hyperplasia and small, noncaseous granulomas <1 mm in size. On the contrary, animals infected with the Comp strain developed lung pathology indistinguishable from those with WT M. tuberculosis infection. The lungs of these animals largely harbored numerous classical lesions with central necrosis (L). As described in the Methods section, the percentage of the lung with histopathologic abnormalities including granulomatous inflammation, necrosis, hemorrhage, and edema was quantified for every animal (M). Coloring scheme in M is identical to the previous figures. *P < 0.05. Scale bars = 100 μm. L = lower lung lobe; M = middle lung lobe; ns = not significant; U = upper lung lobe.
Histopathologic analyses revealed that the lungs of WT M. tuberculosis–infected (four of six) and Comp-infected (four of five) animals with ATB contained numerous granulomas, including many that coalesced (Figures 3F and 3G) and had central zones of necrosis. In contrast, the lungs of M. tuberculosis–infected (two of six) and Comp-infected (one of five) animals with LTBI contained fewer granulomas (Figure 3H). Lungs of animals infected with the mutants showed virtually no granulomatous reaction. The lungs of animals infected with Δ-dosS (Figure 3I), Δ-dosR (Figure 3J), Δ-dosT (Figure 3K), or Δ-dosS/dosT (not shown) contained rare tiny granulomatous foci and typically, widely scattered foci of peribrochiolar lymphoid hyperplasia. Rare small focal granulomas were observed in less than half of the animals infected with each of the mutant strains (Figure 3L). Four out of six M. tuberculosis–infected animals, but none of the animals infected with any of the mutants, developed pulmonary lesions involving 20% or more of the lung, which was significantly greater than in any of the dos-mutant groups but was not significantly different to pathology scores from the Comp-infected group (Figure 3M).
Lesion Hypoxia
TB lung lesions in WT M. tuberculosis–infected macaques were positive for PIMO, indicating hypoxia (Figure 4A). In contrast, evidence of hypoxia was not found in the lungs of macaques infected with any of the mutants (Figure 4B). PIMO signal was enumerated as a fraction of lung area in each of the animals in the various groups (Figure 4C). The highest levels of PIMO signal were observed in the lungs of animals infected with M. tuberculosis that progressed to ATB.
Figure 4.

Detection of hypoxia and expression of Mycobacterium tuberculosis dosR transcript in lungs. Twenty-four hours before being killed, the animals were injected with Hypoxyprobe (pimidazole hydrochloride [PIMO]) conjugated with Daylight-546 (red). Fixed lung tissue was then used to visualize the levels of PIMO as a measure of hypoxia. Four random samples were obtained from each animal. The lungs of M. tuberculosis–infected animals mainly exhibited high levels of PIMO in the inner ring of lung lesions (A), whereas virtually no signal was obtained from the lungs of animals infected with Δ-dosR (B) or Δ-dosS, Δ-dosT, or Δ-dosS/Δ-dosT (not shown). Nuclear stain Bopro1 was used to stain all cells (green). Numeric data from the individual animals in each of the groups is shown as a dot plot, with coloring scheme identical to the previous figures (C). Expression of dosR gene was significantly higher in the lesions of animals with active tuberculosis, relative to the sigA gene, whose expression was repressed in vivo (D). Formalin-fixed, paraffin-embedded lung granuloma sections were captured using a mesodissection technique, which uses a milling rather than a laser-based microdissection approach (29). In situ hybridization using Riboprobe confirmed the expression of dosR (E and F) and dosS (G and H) in bacilli present in the peripheral regions of lung granulomas from animals infected with M. tuberculosis. The arrows point to macrophages with M. tuberculosis with high levels of M. tuberculosis–specific probe reactivity. *P < 0.05; ****P < 0.00005.
Detection of DosR Transcripts in Lungs
We next assessed if bacilli in hypoxic NHP lesions expressed dosR, using two independent techniques: bacterial transcriptomics in granulomas via microdissection (29) and ISH. RNA from microdissected lung lesions of M. tuberculosis–infected NHPs expressed higher levels of dosR, relative to aerobically grown, log-phase cultures (Figure 4D). In contrast, the intragranulomatous expression of housekeeping marker sigA was reduced more than fivefold, relative to in vitro aerobic culture samples. ISH detected dosR (Figures 4E and 4F) and dosS (Figures 4G and 4H) transcripts in lesion rings, suggesting the presence of transcriptionally active bacilli in these regions. These results conclusively demonstrate that the DosR regulon is expressed at high levels in primate lung TB granulomas.
Global Lung Responses to Infection
We compared responses in the BAL at Week 3 as a surrogate for lung (bacterial burdens in all groups were comparable at this time). Animals infected with the different mutants, relative to either WT M. tuberculosis or Comp, exhibited lung expression profiles with high degree of significance for the following gene categories: T-cell activation, lymphocyte activation, leukocyte activation, hemopoeisis, T-cell differentiation, and T-cell selection (Figure 5A). Using IPA, the various biologic functions with the most statistically significant differential enrichment levels between WT M. tuberculosis and Comp strains on one hand and the mutant strains on the other again related to lymphocyte recruitment and function (e.g., quantity of lymphocytes, function of lymphocytes, growth of lymphatic system, lymphocyte migration, and so forth) (Figure 5B). Genes contained within the functional category Quantity of Lymphocytes had two profile types: largely higher (Figure 5C) or largely lower (Figure 5D) expression levels in animals infected with the mutants relative to M. tuberculosis and Comp.
Figure 5.

Comparison of bronchoalveolar lavage (BAL) transcriptome responses 3 weeks postinfection. Using rhesus macaque–specific microarrays, the host response to infection with the various strains (wild-type [WT] Mycobacterium tuberculosis [Mtb], Δ-dosS, Δ-dosT, or Δ-dosR [Comp]) was determined in the lungs of various animals using BAL as a surrogate. Because of its importance, the time point at early Week 3 was studied. Genes with significant perturbation in each of the biologic replicate samples relative to preinfection BAL from the same animals were analyzed using DAVID (Database for Annotation, Visualization, and Integrated Discovery) (A) and Ingenuity Pathway Analysis (IPA) (B). Annotations that were specifically enriched in each of the data sets based on false discovery rate–corrected P values were obtained. Annotations with differential level of enrichment included several categories related to lymphocytes (e.g., T-cell activation, lymphocyte activation, and so forth). Relative differences in significance were plotted as negative logarithms (to the base 10) of P values with cells in blue indicating a lower and cells in orange indicating a higher significance. Thus, a P value of 10 × 10−7 corresponds to a value of 7 on these heat maps (A and B). Genes with significant perturbation in each of the biologic replicate samples relative to preinfection BAL from the same animals were analyzed using IPA, and annotations specifically enriched in each of the data sets based on false discovery rate–corrected P values were obtained. Relative differences in significance were plotted as negative logarithms (to the base 10) of P values with cells in blue indicating a lower and cells in orange indicating a higher significance. (C) A cluster of genes within the quantity of lymphocytes functional category, which exhibit enhanced expression in the Week 3 BAL of nonhuman primates infected with Δ-dosS and Δ-dosT, relative to WT M. tuberculosis and Δ-dosR(Comp). The average magnitude of log2 fold change from technical replicates within every array and from three biologic replicates for each of the three infectious agents was z scored relative to M. tuberculosis. (D) A cluster of genes within the quantity of lymphocytes functional category, which exhibit reduced expression in the Week 3 BAL of nonhuman primates infected with Δ-dosS and Δ-dosT, relative to WT M. tuberculosis. The average magnitude of log2 fold change from technical replicates within every array and from three biologic replicates for each of the three infectious agents was z scored relative to WT M. tuberculosis.
The first subset of genes are expressed on or required for T- or B-cell differentiation, activation, and adhesion, involved in downstream activation of immune responses, innate clearance of infection, or the management of inflammation (Figure 5C; see Figure E3). The second subset was largely involved in the negative regulation of the Th1/proinflammatory response and hemopoiesis (Figure 5D; see Figure E3). Thus, infection with the mutants in the DosR regulon resulted in expression profiles consistent with the recruitment of a broader, more robust initial immune response to the lungs, relative to infection with either WT M. tuberculosis or Comp, which not only exhibited clinical, microbiologic, and pathologic features but also the transcriptional profile associated with M. tuberculosis.
The functional category apoptosis and cell death also exhibited lesser enrichment in animals with WT M. tuberculosis infection relative to infection with the mutants (see Figure E4). The expression of CASP9, the rate-limiting enzyme required for the activation of CASP3-dependent apoptosis, as well as the expression of ADAM17, which is required for the proteolytic activation of tumor necrosis factor-α, which itself is critical for controlling infection, was significantly higher in the M. tuberculosis/Comp group, whereas SLP1 and SERPINE1 (proteinase inhibitors that can limit elastase and plasminogen dependent lung remodeling) were expressed higher in the BAL of mutant-infected animals. Thus, early responses to infection of primate lungs with mutants in the DosR regulon as compared with WT M. tuberculosis resulted in responses that were more beneficial to the host in limiting pathology and likely resulted in disparate T-cell responses.
Transcriptomic results were verified by quantitative reverse-transcriptase polymerase chain reaction for a subset of genes and were highly concordant (see Figure E5). The expression of type-I interferon genes and KLF10, a transforming growth factor-β–induced repressor of cell proliferation, was induced in early BAL of animals infected with M. tuberculosis, whereas the expression of JAK2, CXCL10, and IFNGR2, part of quantity of lymphocytes category and involved in activating productive T-cell responses to infection, was higher in samples derived from the Week 3 BAL samples from the mutant-infected animals.
Host Responses to Infection
Because distinct transcriptomic profiles between the groups indicated the generation of more beneficial responses in the animals infected with the dos mutants, we examined T-cell dynamics in response to infection with WT M. tuberculosis and the mutant strains on serial BAL and terminal lung. The percentages of CD4+ or CD8+ T cells (Figures 6A and 6B) or Tregs (Figure 6C) in the BAL at 3 weeks after infection were comparable among the different groups. Nor were any differences apparent between the three groups based on the memory status of T lymphocytes in the early BAL (Figures 6D–6F). However, animals infected with the Δ-dosS and Δ-dosT mutants exhibited significantly increased percentages of both CD4+ and CD8+ T cells expressing CCR5 (Figures 6G and 6H).
Figure 6.
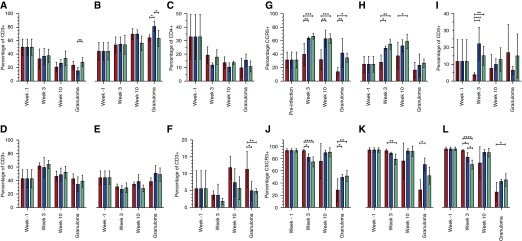
Comparison of lung T-cell phenotype following infection with the different strains. Bronchoalveolar lavage (BAL) cells obtained at Weeks 3 and 10 and dematriced lung cells at necropsy were washed and stained with the various antibodies. Cells were gated into the “lymphocyte gate,” and singlets were obtained and gated for CD4+ (A) and CD8+ (B) subtypes. FoxP3+ Tregs were also enumerated as a subset of CD4+ type (C). Cells were further phenotyped as central memory (D), effector memory (E), and naive (F) populations. Results are shown for wild-type Mycobacterium tuberculosis (red), M. tuberculosis:Δ-dosS (blue), and M. tuberculosis:Δ-dosT (green). BAL cells obtained at Week 10 and dematriced lung cells at necropsy were similarly processed as above. For the various lymphocyte subpopulations, we determined the frequency of CD4+ (G) and CD8+ (H) cells expressing CCR5, CD3+ cells expressing Ki-67 (I), and CD3+ (J), CD4+ (K), and CD8+ (L) cells expressing CXCR3+. Results are shown for WT M. tuberculosis (red), M. tuberculosis:Δ-dosS (blue), and M. tuberculosis:Δ-dosT (green). *P < 0.05; **P < 0.005; ***P < 0.0005; ****P < 0.00005.
Chemokine receptors are intensely expressed on T cells depending on their extent of activation and polarization (40). Thus, Th1 and Th2 lymphocytes express CCR5 and CCR3/CCR4, respectively. CCR5 expression marks T cells for tissue-specific homing, whereas the expression of CXCR3 correlates with higher priming (41). The percentages of both CD4+ and CD8+ cells expressing CCR5 in early BAL on M. tuberculosis infection were very similar to those before infection. Elevated CCR5 levels on CD4+ and CD8+ T cells recruited to the lungs of animals infected with the mutants may explain their attenuation despite their initial ability to replicate. CD4+CCR5+ T cells recruited to the lungs of mutant-infected animals also expressed higher levels of Ki67 (Figure 6I), indicating that the higher levels of these Th1 cells detected in the BAL of mutant-infected animals were also highly proliferative. During ATB, almost all CD4+ T cells recruited to the lungs are CCR5+ (40). The increased influx of these cells at an early stage in the lungs of mutant-infected animals to levels significantly higher than those in WT M. tuberculosis–infected animals indicates that DosR antigens may decrease recruitment of a highly proliferative Th1-type response in the lungs. Surprisingly, however, even when these CCR5+ T cells were recruited to the lungs of human patients with ATB at the late stages, they do not exhibit a proliferative (Ki-67) potential (39). Therefore, antigens downstream of the DosR regulon, which are undoubtedly induced in vivo, seem to reduce not only the recruitment of Th1 response to the lung, but also its proliferation.
The recruitment pattern for total T cells, CD4+ T cells, and CD8+ T cells expressing CXCR3+ was, however, reversed (Figures 6J–6L). CXCR3 expression on CD4+ T cells in lungs correlates with their ability to prime more efficiently, and such cells accumulate in the lungs of M. tuberculosis–infected individuals (41). These results suggest that fully pathogenic M. tuberculosis, which is able to express and deploy the DosR regulon, subverts the host immune program to preclude the arrival of these effector cells into the lungs of primates during early infection. Thus, the inability to induce the full complement of DosR-dependent response compromises the magnitude and timing but not the breadth of T-cell response in the early stages of infection. Analysis of BAL during the later stages of infection (e.g., Week 10) indicated that a greater frequency of CD4+CCR5+ and CD8+CCR5+ cells were recruited to the lungs of animals infected with the nonpathogenic dos mutants (Figures 6G and 6H). In fact, this phenomenon was observed for animals in each of the three groups when lung tissue at killing was analyzed.
Discussion
The Δ-dosR mutant does not exhibit reduced growth in C57Bl/6 mice (2) where lesions do not develop hypoxia. The mutant is also not attenuated in C3HeB/FeJ mice, a surprising result because lesions in C3HeB/FeJ mice develop hypoxia (42, 43). We therefore used a macaque model of inhalation TB to characterize Δ-dosR mutants in vivo (17, 44) to study the relationship among tissue hypoxia, bacillary burden, and pathology following infection. The key findings of our investigation are as follows: (1) rhesus TB granulomas are hypoxic; (2) DosR is expressed in M. tuberculosis population within these granulomas; (3) mutants in dosR, dosS, and dosT genes are not compromised for initial infection in this model; (4) however, mutants in these genes are required for the long-term persistence in this model; (5) the attenuation of the mutant strains coincides with the advent of hypoxia and the T-cell response to infection, contributing to the pathogen’s ability to persist.
In BAL, the levels of all strains were comparable initially. However, at latter time points a gradual increase in WT M. tuberculosis CFUs was observed in the BAL, whereas levels of different mutants rapidly declined. This timing is important, because the cytokine-chemokine response involved in granuloma formation requires about 3 weeks before functional lesions can be assembled and adaptive immune responses generated (22, 45). The mutants in the DosR regulon were therefore capable of replicating in the lungs of primates initially, but the advent of T-cell immunity and the resulting granulomatous response correlated with their eradication. This is in contrast to infection with a much higher dose of the Δ-sigH mutant, which failed to replicate in macaque lungs even during initial infection (21, 46). The attenuation of dos mutants here was in contrast to our work in C3HeB/FeJ mice where most mutants grew comparable with M. tuberculosis (47). These results strongly suggest that macaque lungs provide the microenvironment required to test the contribution of the various M. tuberculosis genes and pathways toward in vivo survival, persistence, and dissemination.
Because of the acute differences in the lung pathology and bacterial burdens in the animals infected with M. tuberculosis versus the mutants, we instead studied host responses between these groups in early BAL when bacillary loads were comparable. The lungs of animals infected with mutants exhibited higher recruitment of highly activated CCR5+ T cells to the lungs (Figure 6), whereas the levels of other T-cell subtypes were comparable. This is noteworthy because CCR5 confers the ability on T cells to home to secondary lymphoid organs (e.g., lungs). Additionally, a higher level of T-cell proliferation (evidenced by a higher Ki67 expression frequency on both CD4+ and CD8+ subtypes in the Week 3 BAL) was observed in animals infected with the mutants relative to those infected with M. tuberculosis. Thus, the overall effect of this response is the generation of a highly effective T-cell response to infection with the mutants followed by their attenuation. DosR-regulated antigens thus likely inhibit the full breadth and magnitude of early T-cell response to M. tuberculosis infection, thus contributing to the ability of M. tuberculosis to persist.
Altered interaction of dos mutants with components of innate immunity may result in differential processing and thus more efficient downstream adaptive responses. The delay in the onset of this response during M. tuberculosis infection is well documented (48) and perhaps a reason for its remarkable success as a persistent pathogen (49). Delayed responses may contribute to the inability of vaccines to sterilize M. tuberculosis infection (50). Identification of M. tuberculosis antigens in vivo has evoked interest lately (51, 52). Both approaches found that DosR antigens were recognized during the course of human infection by T cells. Moreover, several DosR antigens induce strong human T-cell responses (53). Clearly, DosR antigens elicit T-cell responses during human infection. That DosR antigens delay the onset of the adaptive immune responses to infection highlights the importance of this regulon in modulating immune responses to infection.
Acknowledgments
Acknowledgment
The authors acknowledge the invaluable contribution of the Division of Veterinary Medicine and the Division of Comparative Pathology staff at the Tulane National Primate Research Center.
Footnotes
Supported by National Institutes of Health grants AI089323, HL106790, AI091457, RR026006, RR020159, RR000164/OD011104, and AI058609; Louisiana Board of Regents; Tulane National Primate Research Center Office of the Director; Tulane Research Enhancement Fund; Tulane Center for Infectious Diseases; and Tulane Office of Vice-President for Research.
Author Contributions: Research, S.M., M.H.A., T.A.H., R.K., A.-M.J., N.A.G., X.A., and C.J.R. Analysis, S.M., D.K., T.W.F., U.S.G., T.N., and S.A.K. Writing, D.K. with input from S.M., A.A.L., S.A.K., and D.R.S. Pathology, P.J.D. and A.A.L. Clinical, K.E.R.-L., L.A.D., and J.L.B. Funding, D.K. and A.A.L. Reagents, D.R.S.
This article has an online supplement, which is accessible from this issue's table of contents at www.atsjournals.org
Originally Published in Press as DOI: 10.1164/rccm.201408-1502OC on March 2, 2015
Author disclosures are available with the text of this article at www.atsjournals.org.
References
- 1.Russell DG, Barry CE, III, Flynn JL. Tuberculosis: what we don’t know can, and does, hurt us. Science. 2010;328:852–856. doi: 10.1126/science.1184784. [DOI] [PMC free article] [PubMed] [Google Scholar]
- 2.Rustad TR, Harrell MI, Liao R, Sherman DR. The enduring hypoxic response of Mycobacterium tuberculosis. PLoS One. 2008;3:e1502. doi: 10.1371/journal.pone.0001502. [DOI] [PMC free article] [PubMed] [Google Scholar]
- 3.Sherman DR, Voskuil M, Schnappinger D, Liao R, Harrell MI, Schoolnik GK. Regulation of the Mycobacterium tuberculosis hypoxic response gene encoding alpha-crystallin. Proc Natl Acad Sci USA. 2001;98:7534–7539. doi: 10.1073/pnas.121172498. [DOI] [PMC free article] [PubMed] [Google Scholar]
- 4.Rustad TR, Sherrid AM, Minch KJ, Sherman DR. Hypoxia: a window into Mycobacterium tuberculosis latency. Cell Microbiol. 2009;11:1151–1159. doi: 10.1111/j.1462-5822.2009.01325.x. [DOI] [PubMed] [Google Scholar]
- 5.Voskuil MI. Mycobacterium tuberculosis gene expression during environmental conditions associated with latency. Tuberculosis (Edinb) 2004;84:138–143. doi: 10.1016/j.tube.2003.12.008. [DOI] [PubMed] [Google Scholar]
- 6.Pearl JE, Saunders B, Ehlers S, Orme IM, Cooper AM. Inflammation and lymphocyte activation during mycobacterial infection in the interferon-gamma-deficient mouse. Cell Immunol. 2001;211:43–50. doi: 10.1006/cimm.2001.1819. [DOI] [PubMed] [Google Scholar]
- 7.Turner J, Gonzalez-Juarrero M, Saunders BM, Brooks JV, Marietta P, Ellis DL, Frank AA, Cooper AM, Orme IM. Immunological basis for reactivation of tuberculosis in mice. Infect Immun. 2001;69:3264–3270. doi: 10.1128/IAI.69.5.3264-3270.2001. [DOI] [PMC free article] [PubMed] [Google Scholar]
- 8.Roberts DM, Liao RP, Wisedchaisri G, Hol WG, Sherman DR. Two sensor kinases contribute to the hypoxic response of Mycobacterium tuberculosis. J Biol Chem. 2004;279:23082–23087. doi: 10.1074/jbc.M401230200. [DOI] [PMC free article] [PubMed] [Google Scholar]
- 9.Kumar A, Toledo JC, Patel RP, Lancaster JR, Jr, Steyn AJ. Mycobacterium tuberculosis DosS is a redox sensor and DosT is a hypoxia sensor. Proc Natl Acad Sci USA. 2007;104:11568–11573. doi: 10.1073/pnas.0705054104. [DOI] [PMC free article] [PubMed] [Google Scholar]
- 10.Honaker RW, Leistikow RL, Bartek IL, Voskuil MI. Unique roles of DosT and DosS in DosR regulon induction and Mycobacterium tuberculosis dormancy. Infect Immun. 2009;77:3258–3263. doi: 10.1128/IAI.01449-08. [DOI] [PMC free article] [PubMed] [Google Scholar]
- 11.Boon C, Dick T. How Mycobacterium tuberculosis goes to sleep: the dormancy survival regulator DosR a decade later. Future Microbiol. 2012;7:513–518. doi: 10.2217/fmb.12.14. [DOI] [PubMed] [Google Scholar]
- 12.Parish T, Smith DA, Kendall S, Casali N, Bancroft GJ, Stoker NG. Deletion of two-component regulatory systems increases the virulence of Mycobacterium tuberculosis. Infect Immun. 2003;71:1134–1140. doi: 10.1128/IAI.71.3.1134-1140.2003. [DOI] [PMC free article] [PubMed] [Google Scholar]
- 13.Aly S, Wagner K, Keller C, Malm S, Malzan A, Brandau S, Bange FC, Ehlers S. Oxygen status of lung granulomas in Mycobacterium tuberculosis-infected mice. J Pathol. 2006;210:298–305. doi: 10.1002/path.2055. [DOI] [PubMed] [Google Scholar]
- 14.Via LE, Lin PL, Ray SM, Carrillo J, Allen SS, Eum SY, Taylor K, Klein E, Manjunatha U, Gonzales J, et al. Tuberculous granulomas are hypoxic in guinea pigs, rabbits, and nonhuman primates. Infect Immun. 2008;76:2333–2340. doi: 10.1128/IAI.01515-07. [DOI] [PMC free article] [PubMed] [Google Scholar]
- 15.Saunders BM, Frank AA, Orme IM, Cooper AM. Interleukin-6 induces early gamma interferon production in the infected lung but is not required for generation of specific immunity to Mycobacterium tuberculosis infection. Infect Immun. 2000;68:3322–3326. doi: 10.1128/iai.68.6.3322-3326.2000. [DOI] [PMC free article] [PubMed] [Google Scholar]
- 16.Pedrosa J, Saunders BM, Appelberg R, Orme IM, Silva MT, Cooper AM. Neutrophils play a protective nonphagocytic role in systemic Mycobacterium tuberculosis infection of mice. Infect Immun. 2000;68:577–583. doi: 10.1128/iai.68.2.577-583.2000. [DOI] [PMC free article] [PubMed] [Google Scholar]
- 17.Kaushal D, Mehra S, Didier PJ, Lackner AA. The non-human primate model of tuberculosis. J Med Primatol. 2012;41:191–201. doi: 10.1111/j.1600-0684.2012.00536.x. [DOI] [PMC free article] [PubMed] [Google Scholar]
- 18.Dutta NK, Mehra S, Didier PJ, Roy CJ, Doyle LA, Alvarez X, Ratterree M, Be NA, Lamichhane G, Jain SK, et al. Genetic requirements for the survival of tubercle bacilli in primates. J Infect Dis. 2010;201:1743–1752. doi: 10.1086/652497. [DOI] [PMC free article] [PubMed] [Google Scholar]
- 19.Lin PL, Dartois V, Johnston PJ, Janssen C, Via L, Goodwin MB, Klein E, Barry CE, III, Flynn JL. Metronidazole prevents reactivation of latent Mycobacterium tuberculosis infection in macaques. Proc Natl Acad Sci USA. 2012;109:14188–14193. doi: 10.1073/pnas.1121497109. [DOI] [PMC free article] [PubMed] [Google Scholar]
- 20.Mehra S, Golden NA, Dutta NK, Midkiff CC, Alvarez X, Doyle LA, Asher M, Russell-Lodrigue K, Monjure C, Roy CJ, et al. Reactivation of latent tuberculosis in rhesus macaques by coinfection with simian immunodeficiency virus. J Med Primatol. 2011;40:233–243. doi: 10.1111/j.1600-0684.2011.00485.x. [DOI] [PMC free article] [PubMed] [Google Scholar]
- 21.Mehra S, Golden NA, Stuckey K, Didier PJ, Doyle LA, Russell-Lodrigue KE, Sugimoto C, Hasegawa A, Sivasubramani SK, Roy CJ, et al. The Mycobacterium tuberculosis stress response factor SigH is required for bacterial burden as well as immunopathology in primate lungs. J Infect Dis. 2012;205:1203–1213. doi: 10.1093/infdis/jis102. [DOI] [PMC free article] [PubMed] [Google Scholar]
- 22.Mehra S, Pahar B, Dutta NK, Conerly CN, Philippi-Falkenstein K, Alvarez X, Kaushal D. Transcriptional reprogramming in nonhuman primate (rhesus macaque) tuberculosis granulomas. PLoS ONE. 2010;5:e12266. doi: 10.1371/journal.pone.0012266. [DOI] [PMC free article] [PubMed] [Google Scholar]
- 23.Slight SR, Rangel-Moreno J, Gopal R, Lin Y, Fallert Junecko BA, Mehra S, Selman M, Becerril-Villanueva E, Baquera-Heredia J, Pavon L, et al. CXCR5+ T helper cells mediate protective immunity against tuberculosis. J Clin Invest. 2013;123:712–726. doi: 10.1172/JCI65728. [DOI] [PMC free article] [PubMed] [Google Scholar]
- 24.Darrah PA, Bolton DL, Lackner AA, Kaushal D, Aye PP, Mehra S, Blanchard JL, Didier PJ, Roy CJ, Rao SS, et al. Aerosol vaccination with AERAS-402 elicits robust cellular immune responses in the lungs of rhesus macaques but fails to protect against high-dose Mycobacterium tuberculosis challenge. J Immunol. 2014;193:1799–1811. doi: 10.4049/jimmunol.1400676. [DOI] [PMC free article] [PubMed] [Google Scholar]
- 25.Mehra S, Alvarez X, Didier PJ, Doyle LA, Blanchard JL, Lackner AA, Kaushal D. Granuloma correlates of protection against tuberculosis and mechanisms of immune modulation by Mycobacterium tuberculosis. J Infect Dis. 2013;207:1115–1127. doi: 10.1093/infdis/jis778. [DOI] [PMC free article] [PubMed] [Google Scholar]
- 26.Hsia CC, Hyde DM, Ochs M, Weibel ER ATS/ERS Joint Task Force on Quantitative Assessment of Lung Structure. An official research policy statement of the American Thoracic Society/European Respiratory Society: standards for quantitative assessment of lung structure. Am J Respir Crit Care Med. 2010;181:394–418. doi: 10.1164/rccm.200809-1522ST. [DOI] [PMC free article] [PubMed] [Google Scholar]
- 27.Luciw PA, Oslund KL, Yang XW, Adamson L, Ravindran R, Canfield DR, Tarara R, Hirst L, Christensen M, Lerche NW, et al. Stereological analysis of bacterial load and lung lesions in nonhuman primates (rhesus macaques) experimentally infected with Mycobacterium tuberculosis. Am J Physiol Lung Cell Mol Physiol. 2011;301:L731–L738. doi: 10.1152/ajplung.00120.2011. [DOI] [PMC free article] [PubMed] [Google Scholar]
- 28.Varghese AJ, Gulyas S, Mohindra JK. Hypoxia-dependent reduction of 1-(2-nitro-1-imidazolyl)-3-methoxy-2-propanol by Chinese hamster ovary cells and KHT tumor cells in vitro and in vivo. Cancer Res. 1976;36:3761–3765. [PubMed] [Google Scholar]
- 29.Hudock TA, Kaushal D. A novel microdissection approach to recovering mycobacterium tuberculosis specific transcripts from formalin fixed paraffin embedded lung granulomas. J Vis Exp. 2014;(88):10.3791/51693. doi: 10.3791/51693. [DOI] [PMC free article] [PubMed] [Google Scholar]
- 30.McGillivray A, Golden NA, Gautam US, Mehra S, Kaushal D. The Mycobacterium tuberculosis Rv2745c plays an important role in responding to redox stress. PLoS ONE. 2014;9:e93604. doi: 10.1371/journal.pone.0093604. [DOI] [PMC free article] [PubMed] [Google Scholar]
- 31.Fenhalls G, Stevens L, Moses L, Bezuidenhout J, Betts JC, Helden Pv Pv, Lukey PT, Duncan K. In situ detection of Mycobacterium tuberculosis transcripts in human lung granulomas reveals differential gene expression in necrotic lesions. Infect Immun. 2002;70:6330–6338. doi: 10.1128/IAI.70.11.6330-6338.2002. [DOI] [PMC free article] [PubMed] [Google Scholar]
- 32.Höltke HJ, Kessler C. Non-radioactive labeling of RNA transcripts in vitro with the hapten digoxigenin (DIG); hybridization and ELISA-based detection. Nucleic Acids Res. 1990;18:5843–5851. doi: 10.1093/nar/18.19.5843. [DOI] [PMC free article] [PubMed] [Google Scholar]
- 33.Mehra S, Dutta NK, Mollenkopf HJ, Kaushal D. Mycobacterium tuberculosis MT2816 encodes a key stress-response regulator. J Infect Dis. 2010;202:943–953. doi: 10.1086/654820. [DOI] [PMC free article] [PubMed] [Google Scholar]
- 34.Dutta NK, Mehra S, Martinez AN, Alvarez X, Renner NA, Morici LA, Pahar B, Maclean AG, Lackner AA, Kaushal D. The stress-response factor SigH modulates the interaction between Mycobacterium tuberculosis and host phagocytes. PLoS ONE. 2012;7:e28958. doi: 10.1371/journal.pone.0028958. [DOI] [PMC free article] [PubMed] [Google Scholar]
- 35.Huang W, Sherman BT, Lempicki RA. Systematic and integrative analysis of large gene lists using DAVID bioinformatics resources. Nat Protoc. 2009;4:44–57. doi: 10.1038/nprot.2008.211. [DOI] [PubMed] [Google Scholar]
- 36.Gautam US, Mehra S, Ahsan MH, Alvarez X, Niu T, Kaushal D. Role of TNF in the altered interaction of dormant Mycobacterium tuberculosis with host macrophages. PLoS ONE. 2014;9:e95220. doi: 10.1371/journal.pone.0095220. [DOI] [PMC free article] [PubMed] [Google Scholar]
- 37.Lin PL, Dietrich J, Tan E, Abalos RM, Burgos J, Bigbee C, Bigbee M, Milk L, Gideon HP, Rodgers M, et al. The multistage vaccine H56 boosts the effects of BCG to protect cynomolgus macaques against active tuberculosis and reactivation of latent Mycobacterium tuberculosis infection. J Clin Invest. 2012;122:303–314. doi: 10.1172/JCI46252. [DOI] [PMC free article] [PubMed] [Google Scholar]
- 38.Phillips BL, Mehra S, Ahsan MH, Selman M, Khader SA, Kaushal D. LAG3 expression in active Mycobacterium tuberculosis infections. Am J Pathol. 2015;185:820–833. doi: 10.1016/j.ajpath.2014.11.003. [DOI] [PMC free article] [PubMed] [Google Scholar]
- 39.Dutta NK, McLachlan JB, Mehra S, Kaushal D. Humoral and cellular lung responses to Mycobacterium tuberculosis infection in a primate model of protection. Trials Vaccinol. 2014;3:47–51. doi: 10.1016/j.trivac.2014.02.001. [DOI] [PMC free article] [PubMed] [Google Scholar]
- 40.von Andrian UH, Mackay CR. T-cell function and migration. Two sides of the same coin. N Engl J Med. 2000;343:1020–1034. doi: 10.1056/NEJM200010053431407. [DOI] [PubMed] [Google Scholar]
- 41.Slight SR, Khader SA. Chemokines shape the immune responses to tuberculosis. Cytokine Growth Factor Rev. 2013;24:105–113. doi: 10.1016/j.cytogfr.2012.10.002. [DOI] [PMC free article] [PubMed] [Google Scholar]
- 42.Harper J, Skerry C, Davis SL, Tasneen R, Weir M, Kramnik I, Bishai WR, Pomper MG, Nuermberger EL, Jain SK. Mouse model of necrotic tuberculosis granulomas develops hypoxic lesions. J Infect Dis. 2012;205:595–602. doi: 10.1093/infdis/jir786. [DOI] [PMC free article] [PubMed] [Google Scholar]
- 43.Kramnik I. Genetic dissection of host resistance to Mycobacterium tuberculosis: the sst1 locus and the Ipr1 gene. Curr Top Microbiol Immunol. 2008;321:123–148. doi: 10.1007/978-3-540-75203-5_6. [DOI] [PubMed] [Google Scholar]
- 44.Kaushal D, Mehra S. Faithful experimental models of human Mycobacterium tuberculosis infection. Mycobact Dis. 2012;2 doi: 10.4172/2161-1068.1000e108. [DOI] [PMC free article] [PubMed] [Google Scholar]
- 45.Khader SA, Rangel-Moreno J, Fountain JJ, Martino CA, Reiley WW, Pearl JE, Winslow GM, Woodland DL, Randall TD, Cooper AM. In a murine tuberculosis model, the absence of homeostatic chemokines delays granuloma formation and protective immunity. J Immunol. 2009;183:8004–8014. doi: 10.4049/jimmunol.0901937. [DOI] [PMC free article] [PubMed] [Google Scholar]
- 46.Kernodle DS. SigH, antioxidants, and the pathogenesis of pulmonary tuberculosis. J Infect Dis. 2012;205:1186–1188. doi: 10.1093/infdis/jis108. [DOI] [PubMed] [Google Scholar]
- 47.Gautam US, McGillivray A, Mehra S, Didier PJ, Midkiff CC, Kissee R, Golden NA, Alvarez X, Rengarajan J, Sherman DR, et al. DosS is required for the complete virulence of Mycobacterium tuberculosis in mice with classical granulomatous lesions. Am J Resp Cell Mol Biol (In press) doi: 10.1165/rcmb.2014-0230OC. [DOI] [PMC free article] [PubMed] [Google Scholar]
- 48.Wolf AJ, Desvignes L, Linas B, Banaiee N, Tamura T, Takatsu K, Ernst JD. Initiation of the adaptive immune response to Mycobacterium tuberculosis depends on antigen production in the local lymph node, not the lungs. J Exp Med. 2008;205:105–115. doi: 10.1084/jem.20071367. [DOI] [PMC free article] [PubMed] [Google Scholar]
- 49.Brighenti S, Andersson J. Local immune responses in human tuberculosis: learning from the site of infection. J Infect Dis. 2012;205:S316–S324. doi: 10.1093/infdis/jis043. [DOI] [PubMed] [Google Scholar]
- 50.McShane H, Jacobs WR, Fine PE, Reed SG, McMurray DN, Behr M, Williams A, Orme IM. BCG: myths, realities, and the need for alternative vaccine strategies. Tuberculosis (Edinb) 2012;92:283–288. doi: 10.1016/j.tube.2011.12.003. [DOI] [PMC free article] [PubMed] [Google Scholar]
- 51.Lindestam Arlehamn CS, Gerasimova A, Mele F, Henderson R, Swann J, Greenbaum JA, Kim Y, Sidney J, James EA, Taplitz R, et al. Memory T cells in latent Mycobacterium tuberculosis infection are directed against three antigenic islands and largely contained in a CXCR3+CCR6+ Th1 subset. PLoS Pathog. 2013;9:e1003130. doi: 10.1371/journal.ppat.1003130. [DOI] [PMC free article] [PubMed] [Google Scholar]
- 52.Commandeur S, van Meijgaarden KE, Prins C, Pichugin AV, Dijkman K, van den Eeden SJ, Friggen AH, Franken KL, Dolganov G, Kramnik I, et al. An unbiased genome-wide Mycobacterium tuberculosis gene expression approach to discover antigens targeted by human T cells expressed during pulmonary infection. J Immunol. 2013;190:1659–1671. doi: 10.4049/jimmunol.1201593. [DOI] [PubMed] [Google Scholar]
- 53.Leyten EM, Lin MY, Franken KL, Friggen AH, Prins C, van Meijgaarden KE, Voskuil MI, Weldingh K, Andersen P, Schoolnik GK, et al. Human T-cell responses to 25 novel antigens encoded by genes of the dormancy regulon of Mycobacterium tuberculosis. Microbes Infect. 2006;8:2052–2060. doi: 10.1016/j.micinf.2006.03.018. [DOI] [PubMed] [Google Scholar]