

Abstract
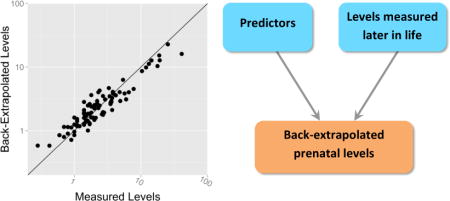
Study sample size in prospective birth cohorts of prenatal exposure to persistent organic pollutants (POPs) is limited by costs and logistics of follow-up. Increasing sample size at the time of health assessment would be beneficial if predictive tools could reliably back-extrapolate prenatal levels in newly enrolled children. We evaluated the performance of three approaches to back-extrapolate prenatal levels of p,p′-dichlorodiphenyltrichloroethane (DDT), p,p′-dichlorodiphenyldichloroethylene (DDE) and four polybrominated diphenyl ether (PBDE) congeners from maternal and/or child levels 9 years after delivery: a pharmacokinetic model and predictive models using deletion/substitution/addition or Super Learner algorithms. Model performance was assessed using the root mean squared error (RMSE), R2, and slope and intercept of the back-extrapolated versus measured levels. Super Learner outperformed the other approaches with RMSEs of 0.10 to 0.31, R2s of 0.58 to 0.97, slopes of 0.42 to 0.93 and intercepts of 0.08 to 0.60. Typically, models performed better for p,p′-DDT/E than PBDE congeners. The pharmacokinetic model performed well when back-extrapolating prenatal levels from maternal levels for compounds with longer half-lives like p,p′-DDE and BDE-153. Results demonstrate the ability to reliably back-extrapolate prenatal POP levels from maternal levels 9 years after delivery, with Super Learner performing best based on our fit criteria.
Graphical abstract
INTRODUCTION
Several persistent organic pollutants (POPs), including p,p′-dichlorodiphenyltrichloroethane (DDT), p,p′-dichlorodiphenyldichloroethylene (DDE), and polybrominated diphenyl ethers (PBDEs) are routinely detected in maternal blood during pregnancy, cord blood, breast milk and child blood1, 2. The insecticide p,p′-DDT, which degrades into its more persistent metabolite p,p′-DDE, has been widely used in the USA until the 1970’s, and to fight malaria in Mexico until 2000. Today, its use is restricted to vector control under the Stockholm Convention on POPs. Penta- and octa-PBDEs are flame retardant commercial mixtures that were added to upholstered furniture, mattresses, and other consumer items3, but were phased out in 2004 in the USA. Many epidemiologic studies have reported associations between prenatal exposure to these contaminants and adverse health effects in children4–8.
The prenatal and early life periods are critical windows of susceptibility because many systems undergo major structural and functional changes, which, if perturbed by chemicals, may alter normal development9, 10. It is therefore crucial to adequately characterize exposure during these windows of susceptibility for use in epidemiological studies. Biomarkers of prenatal exposure (e.g., maternal blood levels during pregnancy or cord blood levels at delivery) can be collected in the context of prospective birth cohort studies. However, the sample size of these studies is often restricted due to the costs and logistics of follow-up, thereby limiting their statistical power. A solution to this problem would be to recruit additional children at the time of health assessment and to back-extrapolate their prenatal exposure levels based on measurements later in life.
Different approaches have been used to back-extrapolate levels of lipophilic POPs. Karmaus et al.11 evaluated two exponential decay models12, 13 and a linear regression model to back-extrapolate polychlorinated biphenyl (PCB) levels in non-pregnant women whose blood was sampled ~10 years apart. Based on intraclass correlation coefficients (ICCs), they concluded that when repeated measurements are available, regression models provide the most accurate estimations (ICCs: 0.77–0.89). However, regression models without cross-validation may lead to overfitting of the data and not predict well on new datasets14, 15. This problem can be avoided by using machine learning methods such as the deletion/substitution/addition (DSA)16 or Super Learner algorithms17, which optimize predictive models based on cross-validation techniques. In addition, pharmacokinetic models, using prior knowledge of physiology and biochemistry, allow for the back-extrapolation of prenatal exposures without the risk of overfitting18.
In the present study, we evaluate a life-course pharmacokinetic model and predictive models using DSA or Super Learner algorithms to back-extrapolate prenatal levels of p,p′-DDT/E and PBDEs (2,2′,4,4′-tetrabromodiphenyl ether [BDE-47], 2,2′,4,4′,5-pentabromodiphenyl ether [BDE-99], 2,2′,4,4′,6-pentabromodiphenyl ether [BDE – 100] and 2,2′,4,4′,5,5′-hexabromodiphenyl ether [BDE – 153]) from maternal and/or child serum levels measured 9-years after delivery. We compare and contrast these models and make recommendations about the best approach.
EXPERIMENTAL
Study population
The Center for the Health Assessment of Mothers and Children of Salinas (CHAMACOS) is a longitudinal birth cohort study investigating the health effects of pesticides and other environmental contaminants on pregnant women and their children living in the agricultural Salinas Valley in California (USA)19. 601 pregnant women were enrolled in the CHAMACOS cohort between 1999 and 2000, with the following eligibility criteria: women were ≥18 years of age, <20 weeks of gestation, English- or Spanish-speaking, eligible for Medi-Cal (subsidized health care), and planning to deliver at Natividad Medical Center. A total of 337 CHAMACOS mothers and children were seen between April 2009 and March 2010 when the children were ~9 years of age. Written informed consent was obtained from mothers and children provided verbal assent at 9 years of age. Study activities were approved by the Institutional Review Board at the University of California, Berkeley; it was determined at the Centers for Disease Control and Prevention (CDC) that the agency was not engaged in human subjects research.
For the present study, we conducted analyses on three study population subsets with maternal blood collected at ~26 weeks of pregnancy: 1) maternal blood was also collected 9 years after delivery (n=94), 2) child blood was also collected 9 years after delivery (n=161), and 3) both maternal and child blood were collected 9 years after delivery (n=89). Because the main aim of the 9-year assessments in the CHAMACOS study was to assess the effects of PBDEs and p,p′-DDT/E exposure on growth, pubertal development and neurodevelopment in girls, blood was only drawn from mothers whose child was a girl (subsets 1 and 3).
Data collection
Study visits occurred twice during pregnancy (at ~13 and 26 weeks gestation), after delivery, and when the children were 0.5, 1, 2, 3.5, 5, 7, and 9 years old. Information collected included parity, history of breastfeeding, age, residential history, socio-demographic factors, and anthropometrics. Birth weight, gestational age, and, gestational weight gain were abstracted from maternal medical records. Missing values (<10% missing) were imputed at random based on the observed probability distributions of each variable. Only maternal and child fat percentage had more than 10% of values missing, with those values imputed using a linear regression model with body mass index (BMI) and weight as the independent variables.
Laboratory measurements of p,p′-DDT/E and PBDE in serum
Blood samples were collected by venipuncture and stored at -80°C until analyzed for several environmental contaminants including p,p′-DDT, p,p′-DDE, BDE-47, BDE-99, BDE-100, and BDE-153 at the CDC using gas chromatography isotope dilution high-resolution mass spectrometry20. Serum levels were expressed on a serum lipid basis (ng/g lipids); total serum lipid concentrations were estimated based on the measurements of triglycerides and total cholesterol using standard enzymatic methods (Roche Chemicals, Indianapolis, IN)21. For levels <LOD, we used values generated by the instrument when available. When no signal was detected, levels <LOD were assigned a value of LOD/√222, an approach that was shown to be suitable when the percentage of levels <LOD is 10% or lower23.
Prediction Models
DSA16 and Super Learner17 algorithms were employed for selecting predictive models for prenatal p,p′-DDT/E and PBDE levels. The DSA algorithm is a loss-based cross-validation method that systematically selects the best predictive model by testing multiple covariate combinations, polynomial transformations, and interaction terms. An advantage of the DSA algorithm is that the final model outputs the significant predictors and coefficient terms within an interpretable parametric model. Super Learner is an ensemble machine learning technique that utilizes a weighted combination of algorithms to return a prediction function that minimizes a cross-validated loss function, avoiding selecting a single prediction method a priori.
For both the DSA and Super Learner algorithms, we used 10-fold cross validation to minimize the mean squared error (MSE). To reduce the influence of outliers, serum concentrations were log10 transformed. For the DSA algorithm, we allowed second-order polynomials and 2-level interactions. For the Super Learner algorithm, we selected a diverse group of learning algorithms as potential candidates including: generalized linear model (GLM), generalized additive model (GAM), random forest, recursive partitioning and regression trees, elastic net, neural network, local polynomial regression, polynomial spline regression, Bayesian linear model, support vector machine, and DSA algorithm. In addition to fitting GLM, GAM, and Bayesian linear models with all potential predictors, we employed a screener prior to use by Super Learner, with the models only using predictors significantly correlated with prenatal serum levels in bivariate analysis (p-value ≤ 0.1). Algorithm-specific MSEs and weights for each subset are presented in the Table S1 (Supplemental Information).
Variables considered in the Super Learner and DSA algorithms (expressed as shown in Table 1) included maternal characteristics at child birth: number of years lived in the USA, country of birth, education, marital status, age, number of children before index child, and breastfeeding duration prior to index child; maternal characteristics 9 years after delivery: family income, age at blood draw, breastfeeding duration for children born after index child, number of children born after index child, BMI, weight, and fat percentage; and child characteristics at 9 years of age: if the child ever lived outside the USA, exact age at blood draw, age- and sex-specific BMI z-score based on data from the CDC24, weight, and fat percentage. Additional variables collected at the 9-year home visit were considered in PBDE analyses: stuffed furniture in home (yes/no and number of pieces of furniture), wall-to-wall carpet (yes/no and number of rooms), ripped/torn furniture (yes/no), number of televisions at home, and computer at home (yes/no). All compounds within the same class were considered for the back-extrapolation of prenatal levels of individual compounds, i.e., 9-year p,p′-DDE and p,p′-DDT levels were potential predictors in models of prenatal p,p′-DDE and p,p′-DDT, and 9-year levels of all PBDE congeners were potential predictors in models of individual PBDE congener prenatal levels.
Table 1.
Demographic and Exposure Characteristics of CHAMACOS Participants used in Back-Extrapolation.
| na | (%) | Median (IQR)b | Range | Mean LOD (Min–Max)c |
% > LODd | % Signale | |
|---|---|---|---|---|---|---|---|
| Maternal years in USA prior to birth of index child | 166 | 4.5 (1.6–10.0) | (0.1–35.8) | ||||
| Maternal age at delivery of index child (years) | 166 | 26.3 (23.5–29.9) | (18.5–42.7) | ||||
| Index child’s birth weight (g) | 166 | 3417.5 (3166.2–3778.8) | (1810.0–4670.0) | ||||
| Breastfeeding duration of index child (months) | 166 | 7.0 (3.0–13.0) | (0.0–44.1) | ||||
| Breastfeeding duration after index child (months) | 166 | 5.0 (0.0–13.0) | (0.0–49.0) | ||||
| Number of children born after index child | 166 | 1.0 (0.0–1.0) | (0.0–4.0) | ||||
| Maternal weight at 9-year visit (kg) | 166 | 73.1 (65.3–85.2) | (46.8–152.2) | ||||
| Child weight at 9-year visit (kg) | 166 | 36.5 (30.4–46.7) | (20.9–90.0) | ||||
|
| |||||||
| Family income at 9-year visit | |||||||
|
| |||||||
| < federal poverty level | 110 | 66.3 | |||||
| > federal poverty level | 56 | 33.7 | |||||
|
| |||||||
| Maternal education | |||||||
|
| |||||||
| ≤ 6th grade | 68 | 41.0 | |||||
| 7–12th grade | 59 | 35.5 | |||||
| ≥ high school graduate | 39 | 23.5 | |||||
|
| |||||||
| Maternal levels at 26 weeks gestation (ng/g-lipid) | |||||||
|
| |||||||
| p,p′-DDT | 166 | 12.8 (7.5–43.3) | (1.5–34500.0) | 2.1 (1.1–3.6) | 99.4 | 99.4 | |
| p,p′-DDE | 166 | 457.9 (247.0–1252.4) | (25.7–58800.0) | 3.9 (2.1–6.7) | 100.0 | 100.0 | |
| BDE-47 | 166 | 15.1 (7.8–22.7) | (1.2–632.0) | 1.5 (0.8–2.6) | 99.4 | 100.0 | |
| BDE-99 | 166 | 4.0 (2.3–6.8) | (0.3–261.0) | 0.4 (0.2–0.7) | 98.8 | 98.8 | |
| BDE-100 | 166 | 2.4 (1.5–4.0) | (0.1–87.7) | 0.4 (0.2–0.7) | 97.6 | 98.2 | |
| BDE-153 | 166 | 2.0 (1.4–3.5) | (0.3–41.0) | 0.4 (0.2–0.7) | 98.2 | 98.2 | |
|
| |||||||
| Maternal levels at 9-year visit (ng/g-lipid) | |||||||
|
| |||||||
| p,p′-DDT | 94 | 2.9 (2.1–6.4) | (0.9–5280.0) | 2.4 (1.4–4.2) | 64.9 | 98.9 | |
| p,p′-DDE | 94 | 240.5 (132.2–544.6) | (50.2–55800.0) | 2.4 (1.4–4.2) | 100.0 | 100.0 | |
| BDE-47 | 94 | 19.0 (11.4–33.1) | (1.7–125.0) | 1.5 (0.8–4.8) | 98.9 | 100.0 | |
| BDE-99 | 94 | 4.0 (2.2–7.0) | (0.3–22.5) | 0.7 (0.4–2.5) | 93.6 | 97.9 | |
| BDE-100 | 94 | 3.6 (2.2–6.1) | (0.3–27.1) | 0.5 (0.3–1.6) | 94.7 | 96.8 | |
| BDE-153 | 94 | 3.5 (2.3–6.3) | (0.8–23.4) | 0.5 (0.3–1.6) | 100.0 | 100.0 | |
|
| |||||||
| Child levels at 9-year visit (ng/g-lipid) | |||||||
|
| |||||||
| p,p′-DDT | 161 | 1.3 (1.0–2.4) | (0.5–418.0) | 3.2 (1.5–9.9) | 19.3 | 96.9 | |
| p,p′-DDE | 161 | 132.0 (81.6–254.0) | (29.7–12400.0) | 3.2 (1.5–9.9) | 100.0 | 100.0 | |
| BDE-47 | 161 | 35.8 (23.4–70.5) | (2.5–231.0) | 1.9 (0.9–5.8) | 100.0 | 100.0 | |
| BDE-99 | 161 | 8.4 (4.9–16.6) | (0.5–64.3) | 1.0 (0.4–2.9) | 99.4 | 100.0 | |
| BDE-100 | 161 | 7.8 (4.8–13.5) | (0.6–63.7) | 0.7 (0.3–2.0) | 100.0 | 100.0 | |
| BDE-153 | 161 | 9.1 (5.6–14.9) | (1.8–173.0) | 0.7 (0.3–2.0) | 100.0 | 100.0 | |
Includes participants used in any of 3 back-extrapolation subsets
IQR= inter-quartile range
LOD= limit of detection
% > LOD= percent of serum samples above LOD
% Signal= percent of serum samples where a signal was detected by mass spectrometry
We used available statistical packages to implement DSA and Super Learner algorithms in R, version 3.0.1 (R Foundation for Statistical Computing, Vienna, Austria).
Pharmacokinetic modeling
We used a previously published pharmacokinetic model for POPs18 to back-extrapolate prenatal levels of p,p′-DDT/E and PBDEs from 9-year maternal or child levels. This two-compartment model simulates mother’s lifetime environmental exposure and child exposure through transplacental diffusion, breastfeeding and environmental exposure (Figure 1). We assumed that p,p′-DDT/E and PBDEs distribute homogeneously across maternal and child body lipids, including serum and breast milk lipids. Published half-lives were used to describe elimination from the maternal and child compartments. For p,p′-DDT/E, we used the same half-lives that were used for model validation18: 5-year half-life for p,p′-DDT25 and a 13-year half-life for p,p′-DDE26. We used PBDE half-lives calculated by Trudel et al.27 using a pharmacokinetic model and human data on daily intakes and PBDE levels in lipids: 1.4 years for BDE-47, 0.8 year for PBDE-99, 1.8 years for BDE-100 and 7.4 years for BDE-153. To back-extrapolate prenatal levels from maternal or child serum levels at the 9-year assessment, we modified the pharmacokinetic model to account for the delivery and breastfeeding of children born after the index child. Also, we modified the model to account for different levels in Mexico and the USA: p,p′-DDT/E exposure is higher in Mexico and PBDE exposure is higher in California as indicated by blood levels measured in CHAMACOS Mexican-American children born in the USA and Mexican children whose mothers are from the same region in Mexico as the CHAMACOS mothers28. We approximated that p,p′-DDT/E blood concentrations are 4 times higher in Mexico than in the USA and that PBDE concentrations are 7 times higher in the USA than in Mexico based on ratios of geometric mean serum levels of p,p′-DDT (parent compound) and BDE-47 (predominant PBDE congener)28.
Figure 1.
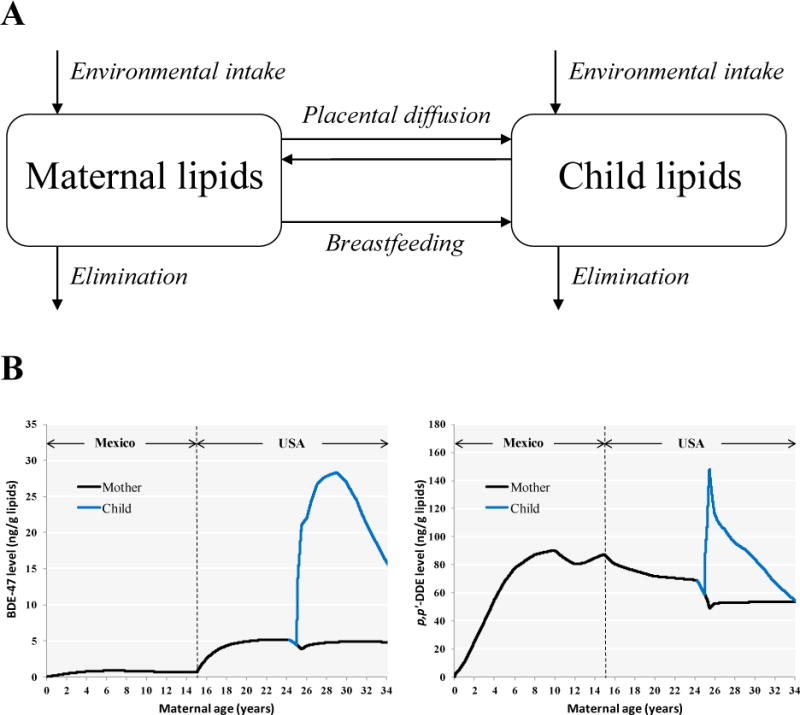
Back-extrapolation using pharmacokinetic modeling. The conceptual representation of the pharmacokinetic model is depicted in panel A (reproduced with permission from Environmental Health Perspectives). Examples of pharmacokinetic profiles of BDE-47 and p,p′-DDE are shown in panel B for a woman who moved from Mexico to the USA at the age of 10, gave birth at the age of 25 and breastfed for 6 months.
To simulate subject-specific exposure profiles, the model incorporated information on mothers (years in the USA, timing of prenatal blood draw, gestational weight gain, age at delivery, age at subsequent deliveries and duration of breastfeeding of each child born after the index child, pre-pregnancy body weight, age at 9-year blood draw, weight at 9-year blood draw) and children (sex, gestational age at birth, birth weight, weight at 9-year blood draw, duration of exclusive and total breastfeeding). Using the model inputs mentioned above, we estimated the maternal daily dose (ng/kg body weight) by running the model iteratively and optimizing the dose to obtain matching simulated and measured serum levels at 9 years. In addition to exposure through transplacental diffusion and breastfeeding, children are exposed to these compounds in their environment. Because exposure to p,p′-DDT/E is assumed to occur mostly through food intake, we assumed that after the first year of life, children were exposed to the same daily dose of p,p′-DDT/E on a body weight basis (ng/kg body weight) as that optimized for the mother. We assumed child environmental exposure to PBDEs to be the same absolute daily PBDE dose (ng) as that optimized for the mother’s based on similar exposure estimates in Lorber29. Model simulations were carried out using acslX (Aegis Technologies Group, Inc., Hunstville, AL, USA).
Assessment of model fit
For each chemical and population subset, we assessed the performance of the different models by comparing predicted and measured concentrations. We computed the root MSE (RMSE) as our main performance criteria because it quantifies both precision and accuracy30, and deconstructed the measure into its two components: precision and accuracy. We assessed precision using the R2 statistic and accuracy by evaluating the intercept and slope of the linear model between measured and back-extrapolated levels. While a higher R2 indicates better precision, a slope of 1 and intercept of 0 suggest good accuracy and absence of bias. In addition, ICCs were calculated for comparison with results from Karmaus et al.11.
RESULTS
Study participants and Exposure Characteristics
At the index child’s birth, the median maternal age was 26.3 years and mothers had lived in the USA for a median of 4.5 years (Table 1). The median breastfeeding time was 7 months for the index child and a total of 5 months for subsequent children (including exclusive and partial breastfeeding). Median p,p′-DDT/E levels were lower in 9-year child and maternal samples than in maternal samples during pregnancy. On the other hand, PBDE were higher in 9-year samples than prenatal samples. At 9 years, children’s PBDE levels were about 2 times higher than maternal levels.
Prediction using the 9-year maternal serum subset
In the subset of participants with maternal serum levels at the 9-year visit (n=94), the Super Learner algorithm performed best for all compounds (RMSEs ranging from 0.12 to 0.31), followed by DSA (RMSEs ranging from 0.16 to 0.35) and pharmacokinetic modeling (RMSEs ranging from 0.21 to 0.59) (Table 2 and Figure 2). For the Super Learner algorithm, the R2s ranged from 0.58–0.95, slopes ranged from 0.51 to 0.89, intercepts ranged from 0.08 to 0.38 and ICCs ranged from 0.71 to 0.97. Highest model performance was observed for back-extrapolated p,p′-DDE and BDE-153 levels, the compounds with the longest half-lives. The DSA algorithm selected different sets of predictors depending on the compound (Table 3). Of note, maternal 9-year levels of certain compounds with longer half-lives were selected to back-extrapolate prenatal levels of shorter half-life compounds, e.g., BDE-153 9-year levels were selected to back-extrapolate BDE-47, BDE-99 and BDE-100 levels. Using the maternal 9-year levels, the pharmacokinetic model performed well when back-extrapolating longer half-life compounds p,p′-DDE and BDE-153 with respective RMSEs of 0.21 and 0.28, R2s of 0.88 and 0.57, intercepts of 0.12 and 0.07, slopes of 0.92 and 0.79 and ICCs of 0.92 and 0.75, respectively. The pharmacokinetic model did not perform as well for shorter half-life PBDE congeners (BDE-47 and BDE-99).
Table 2.
Linear Model Intercepts (β0), Slopes (β1), RMSEs, R2s, and ICCs Comparing Measured Versus Predicted p,p′-DDT/E and PBDE Serum Levels
| Chemical | Maternal 9-year Serum Subset (n=94) |
Child 9-year Serum Subset (n=161) |
Maternal and Child 9-year Serum Subset (n=89)a |
|||||||||||||
|---|---|---|---|---|---|---|---|---|---|---|---|---|---|---|---|---|
| β0 | β1 | RMSE | R2 | ICC | β0 | β1 | RMSE | R2 | ICC | β0 | β1 | RMSE | R2 | ICC | ||
| SL | p,p′-DDT | 0.14 | 0.89 | 0.18 | 0.95 | 0.97 | 0.29 | 0.79 | 0.29 | 0.87 | 0.92 | 0.11 | 0.91 | 0.17 | 0.95 | 0.97 |
| p,p′-DDE | 0.31 | 0.89 | 0.12 | 0.95 | 0.97 | 0.60 | 0.79 | 0.23 | 0.85 | 0.91 | 0.21 | 0.93 | 0.10 | 0.97 | 0.98 | |
| BDE-47 | 0.38 | 0.69 | 0.21 | 0.79 | 0.86 | 0.50 | 0.57 | 0.20 | 0.95 | 0.85 | 0.38 | 0.69 | 0.22 | 0.75 | 0.85 | |
| BDE-99 | 0.33 | 0.51 | 0.31 | 0.58 | 0.71 | 0.37 | 0.42 | 0.27 | 0.95 | 0.70 | 0.29 | 0.57 | 0.28 | 0.65 | 0.76 | |
| BDE-100 | 0.13 | 0.72 | 0.20 | 0.81 | 0.88 | 0.23 | 0.45 | 0.25 | 0.86 | 0.73 | 0.10 | 0.77 | 0.18 | 0.84 | 0.90 | |
| BDE-153 | 0.08 | 0.79 | 0.16 | 0.84 | 0.91 | 0.16 | 0.54 | 0.20 | 0.83 | 0.80 | 0.08 | 0.78 | 0.14 | 0.88 | 0.92 | |
| DSA | p,p′-DDT | 0.12 | 0.91 | 0.23 | 0.91 | 0.95 | 0.34 | 0.75 | 0.39 | 0.75 | 0.86 | 0.15 | 0.89 | 0.26 | 0.89 | 0.94 |
| p,p′-DDE | 0.27 | 0.90 | 0.16 | 0.90 | 0.95 | 0.65 | 0.77 | 0.28 | 0.77 | 0.87 | 0.13 | 0.95 | 0.12 | 0.95 | 0.98 | |
| BDE-47 | 0.37 | 0.69 | 0.24 | 0.69 | 0.82 | 1.16 | NCb | 0.43 | NCb | 0.00 | 0.38 | 0.68 | 0.25 | 0.68 | 0.81 | |
| BDE-99 | 0.37 | 0.46 | 0.35 | 0.46 | 0.63 | 0.63 | NCb | 0.46 | NCb | 0.00 | 0.36 | 0.46 | 0.35 | 0.46 | 0.63 | |
| BDE-100 | 0.16 | 0.65 | 0.26 | 0.65 | 0.79 | 0.37 | 0.11 | 0.40 | 0.11 | 0.20 | 0.13 | 0.71 | 0.24 | 0.71 | 0.83 | |
| BDE-153 | 0.08 | 0.80 | 0.18 | 0.80 | 0.89 | 0.29 | 0.19 | 0.35 | 0.19 | 0.32 | 0.12 | 0.67 | 0.23 | 0.67 | 0.80 | |
| PK | p,p′-DDT | −0.16 | 0.84 | 0.45 | 0.88 | 0.82 | −0.31 | 0.52 | 1.08 | 0.67 | 0.13 | – | – | – | – | – |
| p,p′-DDE | 0.12 | 0.92 | 0.21 | 0.88 | 0.92 | 0.38 | 0.71 | 0.54 | 0.70 | 0.58 | – | – | – | – | – | |
| BDE-47 | 0.46 | 0.56 | 0.43 | 0.30 | 0.54 | 0.41 | 0.36 | 0.63 | 0.11 | 0.18 | – | – | – | – | – | |
| BDE-99 | 0.23 | 0.33 | 0.59 | 0.11 | 0.26 | 0.09 | 0.20 | 0.74 | 0.03 | 0.00 | – | – | – | – | – | |
| BDE-100 | 0.11 | 0.65 | 0.38 | 0.42 | 0.65 | −0.03 | 0.39 | 0.58 | 0.12 | 0.23 | – | – | – | – | – | |
| BDE-153 | 0.07 | 0.79 | 0.28 | 0.57 | 0.75 | −0.04 | 0.51 | 0.50 | 0.19 | 0.34 | – | – | – | – | – | |
Back-extrapolation using both maternal and child 9-year serum values unavailable in the pharmacokinetic model used
NC= not calculated because final model was intercept-only model
SL= Super Learner, DSA = Deletion/Substitution/Addition, and PK = pharmacokinetic model.
Figure 2.
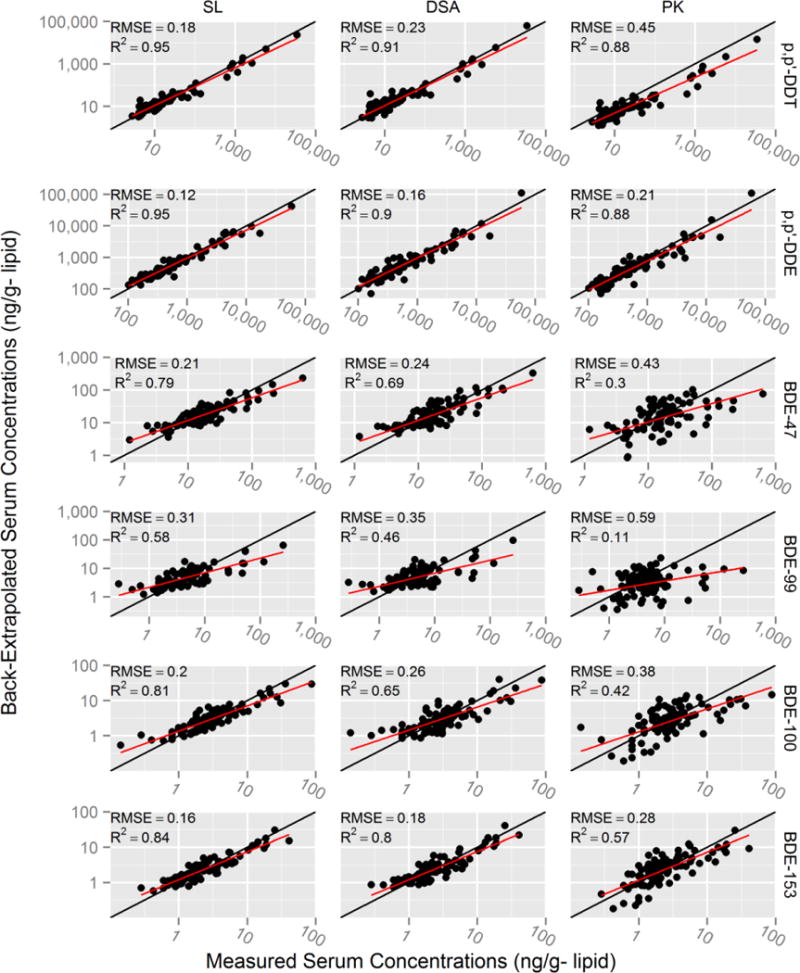
Scatterplots of back-extrapolated versus measured prenatal (~26 weeks gestation) serum concentrations of p,p′-DDT/E and PBDEs using 9-year maternal serum subset (n=94). Root mean squared errors (RMSEs) and correlation coefficients (R2) were calculated comparing the linear fit of back-extrapolated and measured log10 serum levels (red line). Black line represents perfect back-extrapolation. SL = Super Learner, DSA = Deletion/Substitution/Addition, and PK = pharmacokinetic model.
Table 3.
DSA prediction equations for DDT/E and PBDEs using maternal 9-year serum levels (n=94)
| Equation | Description | |
|---|---|---|
|
|
DDTm26 = maternal p,p′-DDT serum concentration at 26 weeks gestation (ng/g-lipid) DDTm9y= maternal p,p′-DDT serum concentration at 9-year visit (ng/g-lipid) MPpost = maternal parity post index child (#) BFpost = cumulative breastfeeding duration post index child (months) WTpre = maternal pre-pregnancy weight (kg) WTGdel = maternal pregnancy weight gain (kg) |
|
|
|
DDEm26 = maternal p,p′-DDE serum concentration at 26 weeks gestation (ng/g-lipid) DDEm9y = maternal p,p′-DDE serum concentration at 9-year visit (ng/g-lipid) BFpost = cumulative breastfeeding duration post index child (months) BFc = breastfeeding duration of index child (months) WTpre= maternal pre-pregnancy weight (kg) |
|
|
|
BDE47m26 = maternal BDE-47 serum concentration at 26 weeks gestation (ng/g-lipid) BDE100m9y = maternal BDE-100 serum concentration at 9-year visit (ng/g-lipid) BDE153m9y = maternal BDE-153 serum concentration at 9-year visit (ng/g-lipid) BDE99m9y = maternal BDE-99 serum concentration at 9-year visit (ng/g-lipid) ED = maternal education at baseline visit (ordinal) YRusa = years in the United States prior to index child (years) |
|
|
|
BDE99m26 = maternal BDE-99 serum concentration at 26 weeks gestation (ng/g-lipid) BDE100m9y = maternal BDE-100 serum concentration at 9-year visit (ng/g-lipid) BDE153m9y = maternal BDE-153 serum concentration at 9-year visit (ng/g-lipid) |
|
|
|
BDE100m26 = maternal BDE-100 serum concentration at 26 weeks gestation (ng/g-lipid) BDE153m9y = maternal BDE-153 serum concentration at 9-year visit (ng/g-lipid) PV9y = poverty at 9-year visit (categorical) YRusa = years in the United States prior to index child (years) |
|
|
|
BDE153m26 = maternal BDE-153 serum concentration at 26 weeks gestation (ng/g-lipid) BDE153m9y = maternal BDE-153 serum concentration at 9-year visit (ng/g-lipid) BDE99m9y = maternal BDE-99 serum concentration at 9-year visit (ng/g-lipid) PV9y = poverty at 9-year visit (categorical) YRusa = years in the United States prior to index child (years) FPm9y = maternal fat percentage at 9-year visit (%) WTpre= maternal pre-pregnancy weight (kg) WTGdel = maternal pregnancy weight gain (kg) ABDm9y = maternal age at blood draw at 9-year visit (years) |
Prediction using the 9-year child serum subset
Like in the 9-year maternal serum subset, Super Learner (RMSEs ranging from 0.20 to 0.29) outperformed the DSA (RMSEs ranging from 0.28 to 0.46) and pharmacokinetic modeling (RMSEs ranging from 0.50 to 1.08) approaches when using child 9-year levels (n=161) (Table 2 and Figure S1). For the Super Learner algorithm, the R2s ranged from 0.83–0.95, intercepts ranged from 0.16 to 0.60, slopes ranged from 0.42 to 0.79 and ICCs ranged from 0.70 to 0.92. The DSA algorithm fit models for p,p′-DDT/E, BDE-100, and BDE-153, but did not select any of the predictors to back-extrapolate prenatal serum concentrations of BDE-47 and BDE-99 and only fit an intercept model at the measured mean prenatal serum levels. Using the child 9-year levels, the pharmacokinetic model performed relatively well for p,p′-DDE, but the precision was low for PBDE levels (R2s ranging from 0.03 to 0.19).
Prediction using the 9-year maternal and child serum subset
In the subset where both maternal and child 9-year serum were available (n=89), the Super Learner and DSA algorithms strongly predicted prenatal p,p′-DDT/E and PBDE serum levels (Table 2 and Figure S2). For the Super Learner algorithm, the RMSEs ranged from 0.10 to 0.28, the R2s ranged from 0.65 to 0.97, intercepts ranged from 0.08 to 0.38, slopes ranged from 0.57 to 0.93 and ICCs ranged from 0.76 to 0.98. However, including both maternal and child 9-year serum levels only marginally increased Super Learner algorithm performance compared to models relying solely on maternal 9-year levels (RMSEs ranged from 0.12 to 0.31).
DISCUSSION
We evaluated three approaches to back-extrapolate prenatal levels of four PBDE congeners (BDE-47, BDE-99, BDE-100 and BDE-153) and p,p′-DDT/E from measured maternal and/or child levels 9-years after delivery. Our results suggest that Super Learner may be the best approach. In addition, we found that estimations were better for compounds with longer biological half-lives (p,p′-DDT/E and BDE-153) compared to compounds with shorter half-lives (BDE-47, -99, and -100).
Super Learner performed the best based on our criteria to minimize the MSE and maximize the R2 of the back-extrapolated versus measured p,p′-DDT/E and PBDE levels, followed by DSA and pharmacokinetic modeling. A drawback to using Super Learner is that the resulting ensemble prediction algorithm is less interpretable than single prediction algorithms because the final output is the weighted output of each algorithm (14 in this study), each with specific equation parameters and predictors. Therefore, the increased performance obtained by combining predictive algorithms comes at the cost of reduced interpretability of the overall model. Conversely, the DSA algorithm provides the exact cross-validated model used for prediction and is thus more transparent than Super Learner. However, the DSA was less accurate than Super Learner and it failed to select a predictive model for BDE-47 and BDE-99 in the child 9-year serum subset. Although the Super Learner and DSA algorithms performed better than pharmacokinetic modeling, the prediction models they generated may be less informative for other populations because they are driven by variables that are population-specific, e.g., the time spent in the USA for Mexican-Americans in the CHAMACOS study. To apply these approaches to other studies, paired measurements of prenatal and postnatal levels are necessary to build the models. In contrast, because the pharmacokinetic model was built a priori based on physiology and biochemistry, and was not calibrated based on measured prenatal levels, it could be used to back-extrapolate prenatal levels in other populations without a training dataset. However, this approach only performed relatively well for the longer half-life compounds (p,p′-DDE and BDE-153).
There are limited studies to compare how well our models back-extrapolated prenatal levels. ICCs in our study using the maternal subset (n=94) ranged from 0.71 to 0.97 for Super Learner, from 0.63 to 0.95 for DSA, and from 0.26 to 0.92 for the pharmacokinetic models. Results obtained with the Super Learner and DSA algorithms were similar to those obtained by Karmaus et al.11 (ICCs: 0.77–0.89) who used regression models to back-extrapolate women’s polychlorinated biphenyl (PCB) levels measured 10 years apart, and are likely to be more generalizable to other populations due to cross-validation31.
Results presented herein have many implications. Models evaluated in this study could be used to back-extrapolate prenatal levels in children enrolled at the time of health assessment to increase study sample size. For example, in the CHAMACOS longitudinal birth cohort, where 337 mothers-child dyads have been followed from pregnancy up to 9-years after delivery19, we recruited 309 additional 9-year-old boys and girls and their mother to increase the sample size to 646. The prediction model generated using the Super Learner algorithm will be used to back-extrapolate prenatal levels in newly enrolled dyads, which will allow assessing the health effects of prenatal exposure in a population almost twice as large as the original birth cohort. However, the potential to back-extrapolate levels from levels measured many years after delivery relies, at least in part, on the persistence of the compounds considered in our study. Back-extrapolating levels of chemicals with shorter half-lives (e.g., phthalates, triclosan) over a period of many years is less likely to be achievable, unless exposure levels are very stable through time.
Results from the DSA analyses allowed us to identify important predictors of p,p′-DDT/E and PBDEs. Studies considering back-extrapolating prenatal levels of these compounds will need to collect information on maternal and child weight (including fat percentage when possible), parity, breastfeeding duration, residence history and socioeconomic status. Another important finding in our study is that levels of certain compounds can be used to back-extrapolate levels of other compounds. That holds especially true for compounds that are correlated at the time of exposure and have different half-lives, e.g., compounds with longer half-lives like BDE-153 may provide valuable information on past exposure to shorter half-life compounds like BDE-47.
Certain limitations of this study ought to be mentioned. Although back-extrapolated levels explained a large portion of the variability in measured prenatal levels, the slope and intercept of the estimated vs. measured regressions were consistently below 1 and above 0, respectively. This is expected given that our models did not fully capture the variability in measured prenatal levels and, consequently, the variance of the predicted values was less than the variance of the measured values. Another limitation is that children born to mothers in the maternal 9-year subset were exclusively girls. We cannot rule out the possibility that the accuracy of the models differs by sex. In addition, it is possible that measures of model fit were influenced by the reduced analytical precision for levels close or below the limit of detection. Nonetheless, our ability to back-extrapolate prenatal levels from maternal 9-year levels demonstrates that it will be possible for existing and future epidemiologic studies to estimate prenatal levels of p,p′-DDT/E and PBDEs from levels measured years after birth.
Supplementary Material
Acknowledgments
The contents of this publication are solely the responsibility of the authors and do not necessarily represent the official position of the Centers for Disease Control and Prevention (CDC). Support for this research was provided by the following grants: EPA R82670901, RD83171001, RD83451301; NIH (NIEHS) P01 ES0009605, ES017054, ES015572; NIOSH OH007400. MAV is recipient of an Emerging Researcher Fellowship from the Université de Montréal Public Health Research Institute (IRSPUM).
Footnotes
Author Contributions
The manuscript was written through contributions of all authors. All authors have given approval to the final version of the manuscript.
The authors have no competing interests. MAV and AB have served as consultants on cases unrelated to the issues covered in this paper. AB has participated as a member of the Science Advisory Board for The Organic Center, a non-profit organization that provides information for scientific research about organic food and farming.
SUPPORTING INFORMATION AVAILABLE: Additional information includes: Super Learner algorithm mean square errors and weights, DSA equations for maternal and child only subsets, and figures comparing measured versus back-extrapolated DDT/E and PBDE results for maternal plus child and child only subsets. This material is available free of charge via the Internet at http://pubs.acs.org.
References
- 1.Frederiksen M, Vorkamp K, Thomsen M, Knudsen LE. Human internal and external exposure to PBDEs–a review of levels and sources. Int J Hyg Environ Health. 2009;212(2):109–34. doi: 10.1016/j.ijheh.2008.04.005. [DOI] [PubMed] [Google Scholar]
- 2.Jaga K, Dharmani C. Global surveillance of DDT and DDE levels in human tissues. Int J Occup Med Environ Health. 2003;16(1):7–20. [PubMed] [Google Scholar]
- 3.Imm P, Knobeloch L, Buelow C, Anderson HA. Household exposures to polybrominated diphenyl ethers (PBDEs) in a Wisconsin Cohort. Environ Health Perspect. 2009;117(12):1890–5. doi: 10.1289/ehp.0900839. [DOI] [PMC free article] [PubMed] [Google Scholar]
- 4.Eskenazi B, Marks AR, Bradman A, Fenster L, Johnson C, Barr DB, Jewell NP. In utero exposure to dichlorodiphenyltrichloroethane (DDT) and dichlorodiphenyldichloroethylene (DDE) and neurodevelopment among young Mexican American children. Pediatrics. 2006;118(1):233–41. doi: 10.1542/peds.2005-3117. [DOI] [PubMed] [Google Scholar]
- 5.Eskenazi B, Chevrier J, Rauch SA, Kogut K, Harley KG, Johnson C, Trujillo C, Sjodin A, Bradman A. In utero and childhood polybrominated diphenyl ether (PBDE) exposures and neurodevelopment in the CHAMACOS study. Environ Health Perspect. 2013;121(2):257–62. doi: 10.1289/ehp.1205597. [DOI] [PMC free article] [PubMed] [Google Scholar]
- 6.Harley KG, Chevrier J, Aguilar Schall R, Sjodin A, Bradman A, Eskenazi B. Association of prenatal exposure to polybrominated diphenyl ethers and infant birth weight. Am J Epidemiol. 2011;174(8):885–92. doi: 10.1093/aje/kwr212. [DOI] [PMC free article] [PubMed] [Google Scholar]
- 7.Longnecker MP, Klebanoff MA, Zhou H, Brock JW. Association between maternal serum concentration of the DDT metabolite DDE and preterm and small-for-gestational-age babies at birth. Lancet. 2001;358(9276):110–4. doi: 10.1016/S0140-6736(01)05329-6. [DOI] [PubMed] [Google Scholar]
- 8.Herbstman JB, Sjodin A, Kurzon M, Lederman SA, Jones RS, Rauh V, Needham LL, Tang D, Niedzwiecki M, Wang RY, Perera F. Prenatal exposure to PBDEs and neurodevelopment. Environ Health Perspect. 2010;118(5):712–9. doi: 10.1289/ehp.0901340. [DOI] [PMC free article] [PubMed] [Google Scholar]
- 9.Colborn T, vom Saal FS, Soto AM. Developmental effects of endocrine-disrupting chemicals in wildlife and humans. Environ Health Perspect. 1993;101(5):378–84. doi: 10.1289/ehp.93101378. [DOI] [PMC free article] [PubMed] [Google Scholar]
- 10.Gluckman PD, Hanson MA, Cooper C, Thornburg KL. Effect of in utero and early-life conditions on adult health and disease. The New England journal of medicine. 2008;359(1):61–73. doi: 10.1056/NEJMra0708473. [DOI] [PMC free article] [PubMed] [Google Scholar]
- 11.Karmaus W, Fussman C, Muttineni J, Zhu X. Backward estimation of exposure to organochlorines using repeated measurements. Environ Health Perspect. 2004;112(6):710–6. doi: 10.1289/ehp.6761. [DOI] [PMC free article] [PubMed] [Google Scholar]
- 12.Rylander L, Stromberg U, Dyremark E, Ostman C, Nilsson-Ehle P, Hagmar L. Polychlorinated biphenyls in blood plasma among Swedish female fish consumers in relation to low birth weight. Am J Epidemiol. 1998;147(5):493–502. doi: 10.1093/oxfordjournals.aje.a009476. [DOI] [PubMed] [Google Scholar]
- 13.Weisskopf MG, Anderson HA, Hanrahan LP, Great Lakes C. Decreased sex ratio following maternal exposure to polychlorinated biphenyls from contaminated Great Lakes sport-caught fish: a retrospective cohort study. Environmental health: a global access science source. 2003;2(1):2. doi: 10.1186/1476-069X-2-2. [DOI] [PMC free article] [PubMed] [Google Scholar]
- 14.Kohavi R. A Study of Cross-Validation and Bootstrap for Accuracy Estimation and Model Selection; International Joint Conference on Articial Intelligence; 1995; 1995. [Google Scholar]
- 15.Van Houwelingen JC, Le Cessie S. Predictive value of statistical models. Statistics in medicine. 1990;9(11):1303–25. doi: 10.1002/sim.4780091109. [DOI] [PubMed] [Google Scholar]
- 16.Sinisi SE, van der Laan MJ. Deletion/substitution/addition algorithm in learning with applications in genomics. Statistical applications in genetics and molecular biology. 2004;3(Article 18) doi: 10.2202/1544-6115.1069. [DOI] [PubMed] [Google Scholar]
- 17.van der Laan MJ, Polley EC, Hubbard AE. Super learner. Statistical applications in genetics and molecular biology. 2007;6 doi: 10.2202/1544-6115.1309. Article25. [DOI] [PubMed] [Google Scholar]
- 18.Verner MA, Sonneborn D, Lancz K, Muckle G, Ayotte P, Dewailly E, Kocan A, Palkovicova L, Trnovec T, Haddad S, Hertz-Picciotto I, Eggesbo M. Toxicokinetic modeling of persistent organic pollutant levels in blood from birth to 45 months of age in longitudinal birth cohort studies. Environ Health Perspect. 2013;121(1):131–7. doi: 10.1289/ehp.1205552. [DOI] [PMC free article] [PubMed] [Google Scholar]
- 19.Eskenazi B, Bradman A, Gladstone EA, Jaramillo S, Birch K, Holland N. CHAMACOS, a longitudinal birth cohort study: lessons from the fields. J Child Health. 2003;1(1):3–27. [Google Scholar]
- 20.Sjodin A, Jones RS, Lapeza CR, Focant JF, McGahee EE, 3rd, Patterson DG., Jr Semiautomated high-throughput extraction and cleanup method for the measurement of polybrominated diphenyl ethers, polybrominated biphenyls, and polychlorinated biphenyls in human serum. Analytical chemistry. 2004;76(7):1921–7. doi: 10.1021/ac030381+. [DOI] [PubMed] [Google Scholar]
- 21.Phillips DL, Pirkle JL, Burse VW, Bernert JT, Jr, Henderson LO, Needham LL. Chlorinated hydrocarbon levels in human serum: effects of fasting and feeding. Archives of environmental contamination and toxicology. 1989;18(4):495–500. doi: 10.1007/BF01055015. [DOI] [PubMed] [Google Scholar]
- 22.Hornung RW, Reed LD. Estimation of Average Concentration in the Presence of Nondetectable Values. Applied Occupational and Environmental Hygiene. 1990;5(1):46–51. [Google Scholar]
- 23.Lubin JH, Colt JS, Camann D, Davis S, Cerhan JR, Severson RK, Bernstein L, Hartge P. Epidemiologic evaluation of measurement data in the presence of detection limits. Environ Health Perspect. 2004;112(17):1691–6. doi: 10.1289/ehp.7199. [DOI] [PMC free article] [PubMed] [Google Scholar]
- 24.Kuczmarski RJ, Ogden CL, Grummer-Strawn LM, Flegal KM, Guo SS, Wei R, Mei Z, Curtin LR, Roche AF, Johnson CL. CDC growth charts: United States. Advance data. 2000;(314):1–27. [PubMed] [Google Scholar]
- 25.Smith D. Worldwide trends in DDT levels in human breast milk. Int J Epidemiol. 1999;28(2):179–88. doi: 10.1093/ije/28.2.179. [DOI] [PubMed] [Google Scholar]
- 26.Wolff MS, Zeleniuch-Jacquotte A, Dubin N, Toniolo P. Risk of breast cancer and organochlorine exposure. Cancer Epidemiol Biomarkers Prev. 2000;9(3):271–7. [PubMed] [Google Scholar]
- 27.Trudel D, Scheringer M, von Goetz N, Hungerbuhler K. Total consumer exposure to polybrominated diphenyl ethers in North America and Europe. Environ Sci Technol. 2011;45(6):2391–7. doi: 10.1021/es1035046. [DOI] [PubMed] [Google Scholar]
- 28.Eskenazi B, Fenster L, Castorina R, Marks AR, Sjodin A, Rosas LG, Holland N, Guerra AG, Lopez-Carillo L, Bradman A. A comparison of PBDE serum concentrations in Mexican and Mexican-American children living in California. Environ Health Perspect. 2011;119(10):1442–8. doi: 10.1289/ehp.1002874. [DOI] [PMC free article] [PubMed] [Google Scholar]
- 29.Lorber M. Exposure of Americans to polybrominated diphenyl ethers. Journal of exposure science & environmental epidemiology. 2008;18(1):2–19. doi: 10.1038/sj.jes.7500572. [DOI] [PubMed] [Google Scholar]
- 30.Wackerly DD, Mendenhall W, Scheaffer RL. Mathematical statistics with applications. 7. Thomson Brooks/Cole; Belmont, CA: 2008. p. xxii. 912 p. [Google Scholar]
- 31.Hawkins DM. The problem of overfitting. Journal of chemical information and computer sciences. 2004;44(1):1–12. doi: 10.1021/ci0342472. [DOI] [PubMed] [Google Scholar]
Associated Data
This section collects any data citations, data availability statements, or supplementary materials included in this article.