Abstract
In situ observations including long-term moored meteorological and oceanographic measurements and multi-year gulf-wide ship survey data are used to quantify interannual variability of surface wind, river runoff, and hydrographic conditions in the Gulf of Maine during summers 2002–2011. The cumulative upwelling index shows that upwelling (downwelling)-favorable wind conditions were most persistent in 2010 (2005) over the 10-year study period. River discharge was highest in 2005; peak runoff occurred in early April in 2010 as opposed to late April to middle May in other years. Moored time series show that coastal water temperature was 0.5–2 °C warmer than average in summer 2010, and about 2 °C colder than average in 2004. Coastal salinity in April 2010 was the lowest in the 10-year study period. Both moored Acoustic Doppler Current Profiler (ADCP) current measurements and dynamic height/geostrophic velocity calculations based on gulf-wide ship survey data show May–June 2010 had one of the weakest alongshore transports in the western Gulf of Maine during the 10-year study period, likely associated with intrusions of warm slope water and fresher-than-usual Scotian Shelf water. Comparisons of coastal currents to the Paralytic Shellfish Poisoning (PSP) closure maps resulting from A. fundyense blooms suggest a linkage between alongshore transport and the downstream extent of toxicity.
Keywords: Gulf of Maine, Upwelling Index, River Discharge, Hydrography, Interannual Variability
1. Introduction
The Gulf of Maine (GOM) off the U.S. northeast coast is a marginal sea (Fig. 1) having a large-scale cyclonic mean circulation (Bigelow, 1927, Brooks and Townsend, 1989; Lynch et al., 1996; 1997; Pettigrew et al., 2005). The nearshore flow known as the Maine Coastal Current (MCC) flows southwestward along the coast from the Bay of Fundy. Downstream, one branch of this current often veers offshore of Penobscot Bay. The remaining portion continues southwestward, as it is fed by river runoff from the Penobscot, Kennebec, Androscoggin, and Merrimack Rivers. The current bifurcates further downstream, one branch flowing through the Great South Channel (GSC) toward the Middle Atlantic Bight (MAB), and the other flowing northeast to Georges Bank.
Fig. 1.
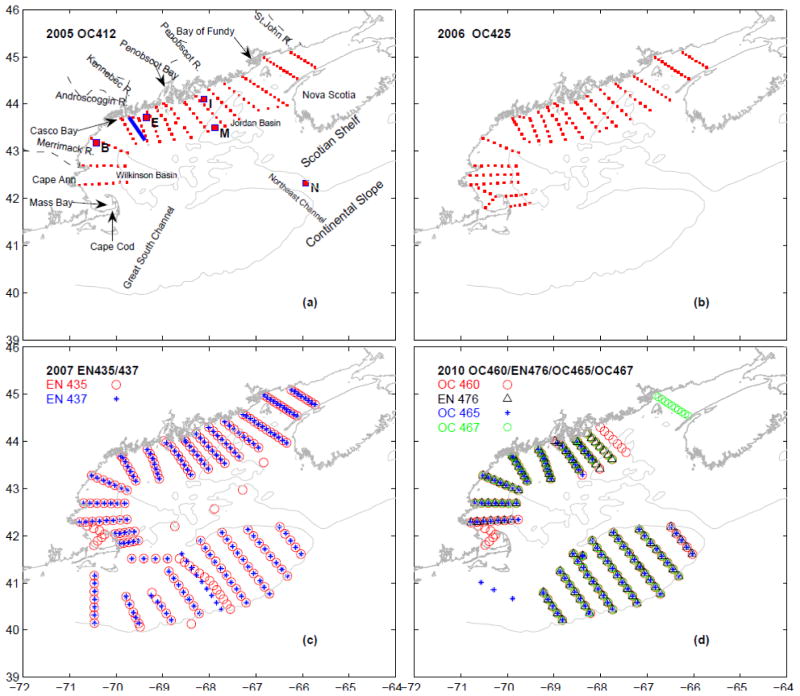
Locations of the NERACOOS buoys (pink squares) and CTD stations (red dots) of gulf-wide ship surveys (a) Oceanus 412 in 2005, (b) Oceanus 425 in 2006, (c) Endeavor 435/437 in 2007 and (d) Oceanus 460/465/467 and Endeavor 476 in 2010, respectively. Also shown is the 200-m isobath. The blue solid line indicates the transect off Casco Bay that is used for computing alongshore transport shown in Table 1.
While these mean circulation patterns are well known, significant variability has been observed on synoptic to interannual time scales. Both local forcing (i.e., tides, wind, heat flux and rivers) and upstream/deep ocean forcing contribute to such hydrodynamic variability (e.g., Lynch et al., 1997; Xue et al., 2000; Keafer et al., 2005; Pettigrew et al., 2005; Mountain and Manning, 1994; He and McGillicuddy, 2008). Pettigrew et al. (2005) showed that during a three-year study period (1998–2000), there was significant disconnection between eastern and western segments of MCC in 1998, as compared to a more connected coastal flow in 2000, with 1999 being an intermediate case. Further analysis of the kinetic structure of the flow showed such variability is an outcome of the modulation of both wind forcing and river discharge. Moreover, eddies and meanders may affect the near-shore current variance at times (Churchill et al., 2005). The drifter study by Manning et al. (2009) suggested while the mean coastal current is centered near 100-m isobath, its path can deviate fairly frequently due to effects of wind forcing and small-scale baroclinic structures. Modeling studies (Aretxabaleta et al., 2009; Li et al., this issue) also revealed significant interannual variability in the strength and transport pathways of the coastal current.
In addition to local forcing, inflows into the Gulf of Maine from the Scotian Shelf and through Northeast Channel have been found to be highly effective in modulating the GOM interior hydrography from time to time (e.g., Smith et al., 2001; Brown and Irish, 1993; Houghton and Fairbanks, 2001; Bisagni and Smith, 1998; McGillicuddy et al., 2011; Smith et al., 2012). Mountain and Manning (1994) studied the seasonal cycle and interannual variability in coastal hydrography. In the eastern Gulf the salinity cycle is dominated by the winter influx of low salinity Scotian Shelf water, as opposed to that in the western Gulf, which is heavily influenced by the local runoff in spring. Because of the phase differences in temperature and salinity cycles, the western GOM is more stratified in spring and summer. On decadal time scales, there was less variability in temperature (1–2 °C) during the period 1977–1987, compared to observed fluctuations of 4–6 °C in 1960s. Further analysis confirmed that the temperature variability was driven by both local heat flux and boundary inflows with an advective origin (Mountain et al., 1996). Townsend et al. (2010) found lower nitrate but higher silicate concentrations in the GOM interior beginning in the 1970s, likely due to increased freshwater inflow from the Scotian Shelf. As such, the coastal current system in recent decades is comprised of a greater portion of relatively nutrient-poor, cold shelf waters and less of the nutrient-rich, warm slope waters that were previously thought to dominate the nutrient flux into the gulf.
Long-term moored meteorological and oceanographic observations (with hydrographic observations becoming available in July 2001) taken by a regional marine buoy network, along with multi-year gulf-wide ship surveys of the Gulf of Maine Toxicity (GOMTOX) project and predecessor programs have provided a new opportunity to quantify the interannual variability of the GOM hydrodynamics in recent years. Focusing on the late spring and summer periods (April 1 – August 1), we use these observations to investigate the interannual variations in local wind forcing, river discharge, and the gulf-wide hydrographic conditions during 2002–2011. One of our objectives is to provide an updated knowledge of regional coastal hydrography that can complement Pettigrew et al. (2005) and other earlier studies (which were based on ship survey data and GoMOOS observations prior to 2005), and discuss the possible causes to such variability during the past 10 years. In addition, a number of earlier studies have illustrated that changes in atmospheric forcing, gulf hydrography and coastal circulation have significant impacts on the timing and magnitude of annually-occurring Alexandrium fundyense blooms and shellfish toxicity in the gulf (e.g., Anderson et al., 2005, He et al., 2008, Li et al., 2009; McGillicuddy et al., 2011; Thomas et al., 2010). In this regard, a particular motivation of this research is to better quantify the seasonal and interannual variations in the Gulf of Maine hydrodynamics to provide a foundation for understanding the intrinsic linkage between regional hydrodynamics, A. fundyense blooms, and the distribution of the associated toxicity along the coast.
2. Methods
The majority of long-term time series observations used in this study during 2002–2011 were obtained from moorings of the Gulf of Maine Ocean Observing System (now part of the Northeastern Regional Association of Coastal and Ocean Observation Systems [NERACOOS], http://www.neracoos.org, e.g., Pettigrew et al., 2011), including hourly observations of surface wind speed and direction, ocean temperature, salinity and velocity. We focused on temperature and salinity measured by buoys B and E in the western GOM coastal region, and buoy I in the eastern GOM coastal region. Both areas are primary habitats of A. fundyense (Anderson et al., 2005; Stock et al., 2005) and where onshore shellfish bed closures regularly occur. Buoys M and N document variability in Jordan basin and the Northeast Channel, respectively, which provides important information about offshore forcing that impacts the coastal region (Fig. 1a, pink squares).
The surface wind forcing was quantified using an Upwelling Index ( , i.e., the offshore component of the Ekman transport) following the method of Schwing et al. (1996), where τx is the alongshore component of wind stress calculated using the Large and Pond (1981) formulation, and f is the local Coriolis parameter. Positive (negative) UI represents upwelling (downwelling) favorable wind conditions, respectively. The cumulative UI (CUI) was computed by integrating the resulting UI over time (i.e., CUI = ∫UI dt) between April 1 and August 1 of each year. The slope of CUI is particularly informative, in that the most upwelling favorable wind conditions are represented by the steepest rising trend in CUI. In contrast, a declining trend in CUI indicates that downwelling favorable winds (negative UI) become more dominant.
For ocean temperature and salinity observations and density profiles, harmonic fitting was applied to derive their seasonal cycles. To define the mean seasonal cycles, a least-squares harmonic fitting method was applied to hourly surface (2 m) temperature and salinity measurements at buoys such that,
where t is time in days, ω = 2π/365d−1, and a and b are fitting coefficients of the harmonic signal.
Temperature and salinity observations collected during shipboard surveys in the summers of 2005, 2006, 2007, and 2010 were also used to provide quasi-synoptic, gulf-wide hydrographic analyses (Figs. 1a, b, c, and d). Additionally, river runoff time series collected from five major rivers in the GOM (i.e., St. John, Penobscot, Androscoggin, Kennebec, and Merrimack rivers; Fig. 1a) were considered. Daily discharge observations during 2002–2011 were obtained from the United States Geological Survey (USGS) river station and water survey of Canada.
3. Results
3.1 Seasonal and Interannual Variability in Wind forcing
The long-term (2002–2011) seasonal mean wind fields over the GOM exhibit a directional shift that typically occurs in April–May. Northwesterly winds generally dominate the gulf in April. Southwesterly winds then become prevailing starting in May, and continue as the season progresses. Such southwesterly winds favor coastal upwelling circulation near the Maine coast. Earlier studies (e.g., Anderson et al., 2005; He and McGillicuddy, 2008) have shown that outbreaks of consecutive strong northeasters can reverse the monthly mean wind field into downwelling favorable in some years (e.g., May 2005; also see Butman et al. 2008).
Significant interannual variability was revealed by CUI analyses on wind time series between April and August of 2004–2011 at buoy B in the western GOM (WGOM) and buoy I in the eastern GOM (EGOM) (Fig. 2). Among all 8 years, 2010 strands out as the year with the most persistent upwelling-favorable wind conditions, whereas 2005 was had the most downwelling-favorable wind. Indeed, a sharp decline in 2005 CUI was associated with a series of strong northeasters that occurred in the month of May, as indicated earlier by He and McGillicuddy (2008) and Butman et al. (2008).
Fig. 2.
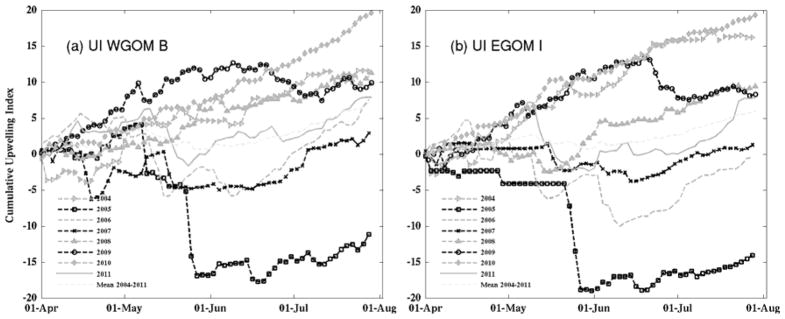
Time series of Cumulative upwelling indices (CUI) for 2004–2011 at (a) WGOM buoy B and (b) EGOM buoy I. The unit for the indices is m2 × 86400. At each station, the long-term mean CUI is shown in dashed grey line.
Although the signals are not as strong as 2010, years 2004, 2008 and 2009 were also characterized largely by upwelling-favorable winds, as shown by a generally rising trend in their respective CUI time series. CUIs for 2006, 2007, and 2011 were relatively flat for most of the time period examined, suggesting the mean alongshore wind stress was significantly weaker during these three years compared to the other years. We note temporal patterns of CUIs at buoys B and I were generally very similar except during May–August of 2004 and June–July 2006. Some sub-regional wind field differences became apparent during these two periods, such that surface winds were more downwelling favorable in the EGOM than in the WGOM, as reflected in the steeper declines in CUI at buoy I than buoy B. Such spatial heterogeneity may be explained by differences in storm tracks.
3.2 River Discharge
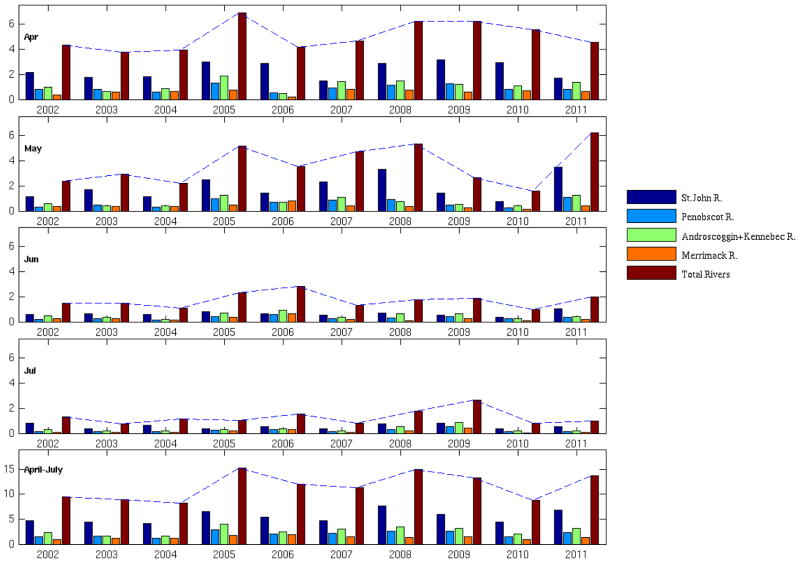
River runoff is an important factor influencing the salinity and density structure of the coastal GOM, especially in the spring and summer seasons (Keafer et al, 2005; Geyer et al., 2004; Brooks, 1994). Based on daily discharge observations of the St. John river, the Penobscot river, the Androscoggin/Kennebec river, and the Merrimack river (see Fig. 1 for their geographic locations), we constructed monthly mean runoff time series in April, May, June and July for 2002–2011. The cumulative monthly runoff from these 4 rivers was also computed to represent the total freshwater discharge into the gulf in each corresponding month (Fig. 3).
Fig. 3.
Monthly (April–July) and seasonal total river runoff of 4 major rivers (St. John, Penobscot, Androscoggin and Kennebec, and Merrimack) in the GOM. Units: 103 m3 s−1.
For each river, the runoff was the largest in April and May, and generally declined by 40–70% by June and July. Significant interannual differences were seen in terms of monthly mean and total river discharge. In April, the largest monthly runoff (~ 7×10³ m3 s−1) occurred in 2005, although the April runoff was high in most other years. In May, the highest river discharge took place in 2011, with the second highest in 2005. The largest total river runoff in the months of June and July happened in 2006 and 2009, respectively. The total river runoff time series for the entire season (April – July) (Fig. 3, bottom panel) displayed a similar pattern as those in the individual months. For 6 years (2005–2009 and 2011), the total river runoff was 50–100% larger than those in 2002, 2003, 2004 and 2010.
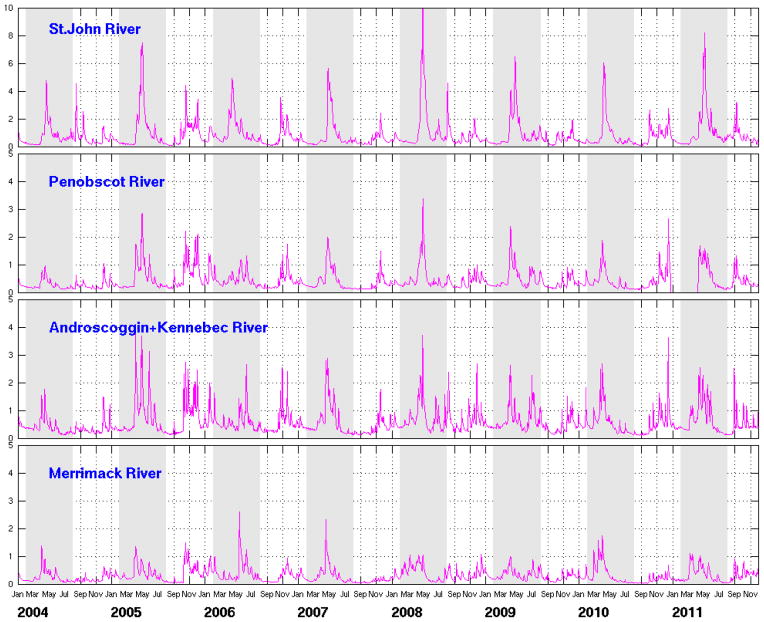
A detailed examination of the daily runoff time series (Fig. 4) shows that while the overall river discharge in spring and summer 2010 was relatively low, the peak runoff took place in the middle of April, which was about two-three weeks earlier than when the peak runoff occurred in other years (early-middle May). Such differences in total discharge and timing of peak runoff can lead to the interannual variability of coastal salinity, which in turn alters water stratification, and the associated baroclinic circulation.
Fig. 4.
Daily river discharge time series for the St. John, Penobscot, Androscoggin and Kennebec, and Merrimack rivers. Grey shaded areas indicate the spring and summer months (February to August) of each year. Units: 103 m3 s−1.
3.3 Coastal Hydrography and Currents from moored observations
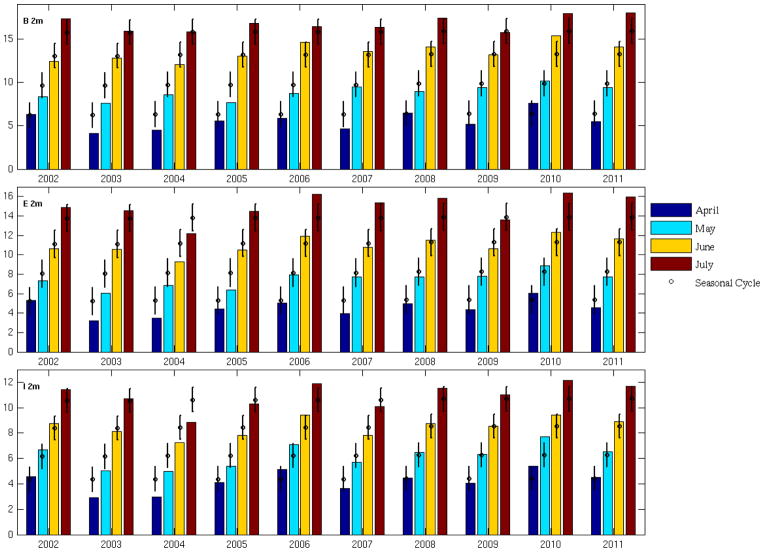
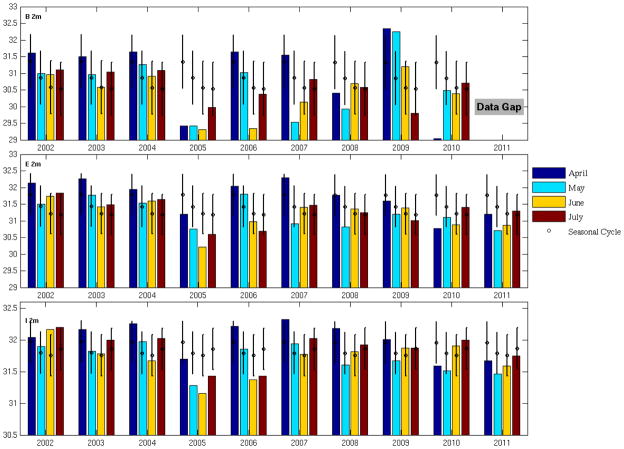
10-year (2002–2011) temperature and salinity time series displayed variability on a wide range of scales from synoptic to seasonal to interannual. To define the mean seasonal cycles, a least-square harmonic fitting method (see details in the method section) was applied to hourly surface (2-m) temperature and salinity measurements at buoys B and E in the WGOM and buoy I in the EGOM, respectively. Both hourly observations and fitted seasonal cycles were then time-averaged over each month from April to July in 2002–2011. Comparisons of the resulting monthly means indicate how different surface temperature (Fig. 5) and surface salinity (Fig. 6) are from their corresponding seasonal cycles.
Fig. 5.
Monthly mean near-surface (2-m) water temperature in April–July 2002–2011 observed at NERACOOS buoys B, E, and I. Also shown by black open circles and corresponding error bars are the mean seasonal cycle and the associated standard deviations. Unit: °C.
Fig. 6.
Same as Figure 5, but for near-surface salinity.
3.3.1 Temperature
In all years, surface temperature increased monotonically from April to July. Two years stand out as having significant anomalies compared to the mean seasonal cycle. In 2004, the water was about 2 °C colder than usual at all three coastal stations B, E, and I. In contrast, in 2010, the water was significantly warmer (1–2 °C) than the mean seasonal cycle at the same three stations. The 50-m temperature record (not shown) showed similar signals, suggesting such interannual variability extended well below the surface.
3.3.2. Salinity
The salinity measured by the coastal buoys B, E, and I exhibited pronounced interannual variations as well (Fig. 6). We computed the salinity seasonal cycle and standard deviation error with the same harmonic fitting method used for the temperature (note there is a data gap at buoy B in summer 2011 so no analysis was made). All three buoys showed the coastal water in 2005 was the freshest in the 10-year record. At buoy B for instance, the measured salinity was 2 units fresher in April and May and 1 unit fresher in June than their corresponding seasonal cycle values. Such freshening was consistent with 2005 having the largest runoff event in the time series (Fig. 3). Conditions were less variable in other years, with salinity values generally falling within a standard deviation of the mean seasonal cycle. We noted that salinity in April 2010 was highly anomalous. At all three buoy locations (in both WGOM and EGOM), salinity was 1–2.5 unit fresher than the seasonal cycle. This coincided with the earlier freshening in April 2010 discussed in Section 3.2.
3.3.3. Stratification
Temperature and salinity observations at 2-m and 50-m can be used to compute the water column buoyancy (Väisälä) frequency N2 following
The seasonal cycle, monthly and seasonal means were calculated for each year between 2002 and 2011 (Fig. 7). In most years, the stratification was dominated by temperature and increased gradually as the seasonal warming progressed, reaching the highest values of N2 in July. This was not the case in 2005 and 2010 at buoy B, when April had stronger stratification than May. Interannual variability is affected by the salinity anomaly introduced by larger (or earlier) than normal river discharge discussed earlier (section 3.2), resulting in lower salinity and density in the upper ocean that enhances water column stratification. Remote forcing, such as advection of water mass anomalies from upstream, can also play a role in stratification (section 3.3.4 below).
Fig. 7.
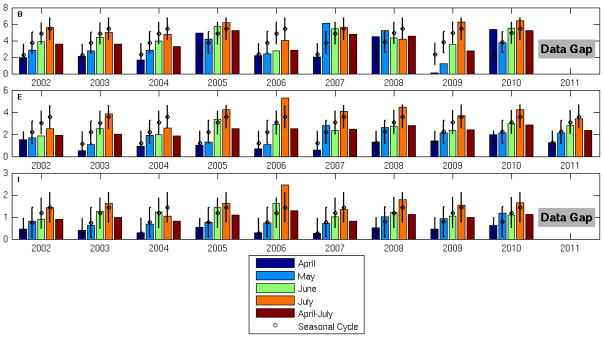
Same as Fig. 5 and Fig. 6, but for the Vaisala frequency (N2) based on density at 2-m and 50-m. Both seasonal cycle and monthly and seasonal mean conditions during April–July are shown. Unit: s−2×10⁻⁴.
3.3.4. Hydrographic variability in Jordan Basin and the Northeast Channel
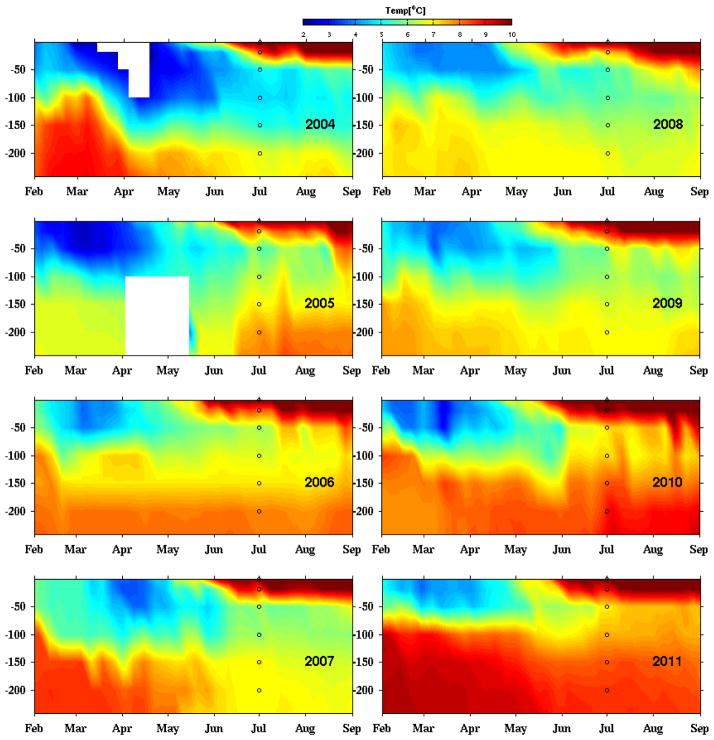
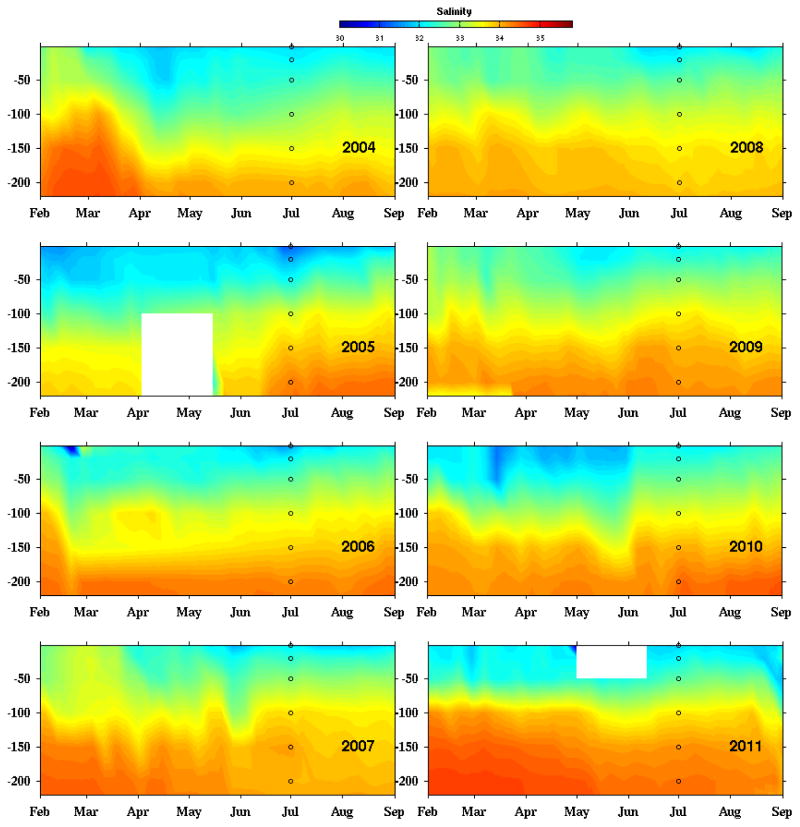
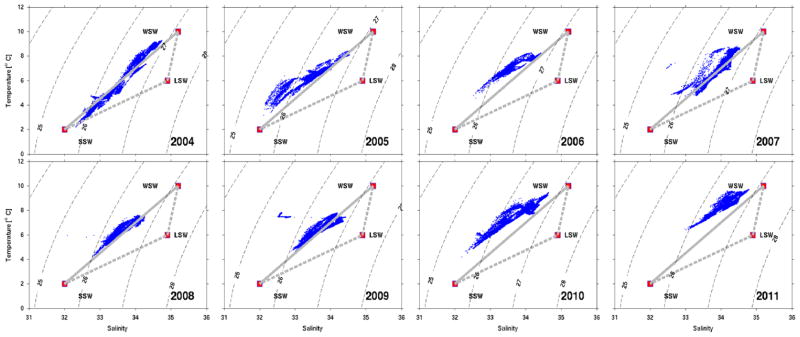
Buoy M collects subsurface temperature and salinity data in Jordan Basin (Fig. 8). In addition to the expected seasonal cycle shown in the time series (between February and September) in each year, we also see significant interannual variability at depth (>100m). For example, in February–April 2004, April–August 2010, and February–May 2011, deep water temperature was up to 1–2 °C warmer than during the same period in other years. The concurrent salinity time series in February–April 2004 and February–May 2011 (Fig. 9) showed that deep water salinity during these two periods was also slightly saltier than in other years. To determine the source of water properties, we conducted a water mass analysis based on the T-S data measured at buoy M following Smith et al. (2001) and McGillicuddy et al. (2011). Results (Fig. 10) clearly showed Warm Slope Water properties (WSW) in 2011, 2010 and 2004, suggesting a bottom water intrusion taking place prior to the summer season. In 2010 for instance, a similar subsurface warming anomaly was also seen at Buoy N in the Northeast Channel (not shown). The subsurface water was 2–5 °C warmer in 2010 than in most of the years (except for 2006).
Fig. 8.
Time series of observed temperature at NERACOOS buoy M in Jordan Basin, February–September, 2004–2011. Black circles indicate the depths where observations are available. A 7-day low-pass filter was applied to the time series to remove high-frequency noise.
Fig. 9.
Same as Figure 8, but for the salinity time series at buoy M.
Fig. 10.
T-S diagrams for deep waters (depth>100m) in Jordan Basin. Temperature and salinity data are from buoy M in February-September, 2004–2011. Vertices of the mixing triangle are canonical end-member water-mass properties of Warm Slope Water (WSW), Scotian Shelf Water (SSW), and Labrador Slope Water (LSW) as described by Smith et al. (2001). Dotted contour lines represent density anomalies.
3.3.5. Currents
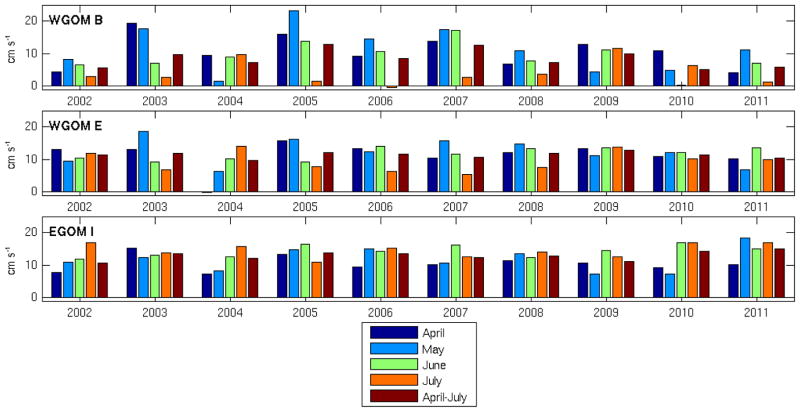
We applied the same monthly/seasonal mean analysis on the westward, alongshore surface (2-m) current measured by buoys B, E and I (Fig. 11). Results showed the monthly variations were smaller in the EGOM than in the WGOM. At buoy B (in WGOM), the largest April-, May-, June- and July- monthly mean velocities occurred in 2003, 2005, 2007, and 2009, respectively. In contrast, the weakest April-, May-, June-, and July- monthly mean velocities occurred in 2002, 2004, 2010, and 2006, respectively. In some months, a reversed (i.e., eastward) alongshore current was seen, such as in April 2004 at buoy E, and in July 2006 at buoy B. It is also noted that while the alongshore current at buoy I (EGOM) was normal in July 2007, the alongshore flow at buoy E (WGOM) was the weakest compared to flows in July of other years. This suggests that the western portion of MCC system might have been decoupled in July 2007, a finding that is consistent with the geostrophic calculations presented in Section 3.4.
Fig. 11.
Monthly mean alongshore velocity in April–July, 2002–2011 observed at NERACOOS buoys B, E, and I. The alongshore current is positive southwestward. Unit: cm s−1.
From the summer mean perspective, in the WGOM (at buoy B) 2005 had the strongest (~12 cm s−1) westward alongshore velocity in the 10-year study period, whereas 2002 and 2010 had the weakest (5 cm s−1). Similar features were observed at buoys E and I, except that the coastal flow in buoy E and I in 2010 was not as weak as downstream, again suggesting offshore veering of the MCC. Similar features in other years have been reported by Pettigrew et al. (2005) and Churchill et al. (2005). Further analysis of the velocity time series at different depths (not shown) indicates that the seasonal and interannual variations described above extended to at least 60 m below the surface, suggesting the overall transport in the upper water column would follow the same seasonal and interannual variability.
3.4 Ship-based hydrography and geostrophic current
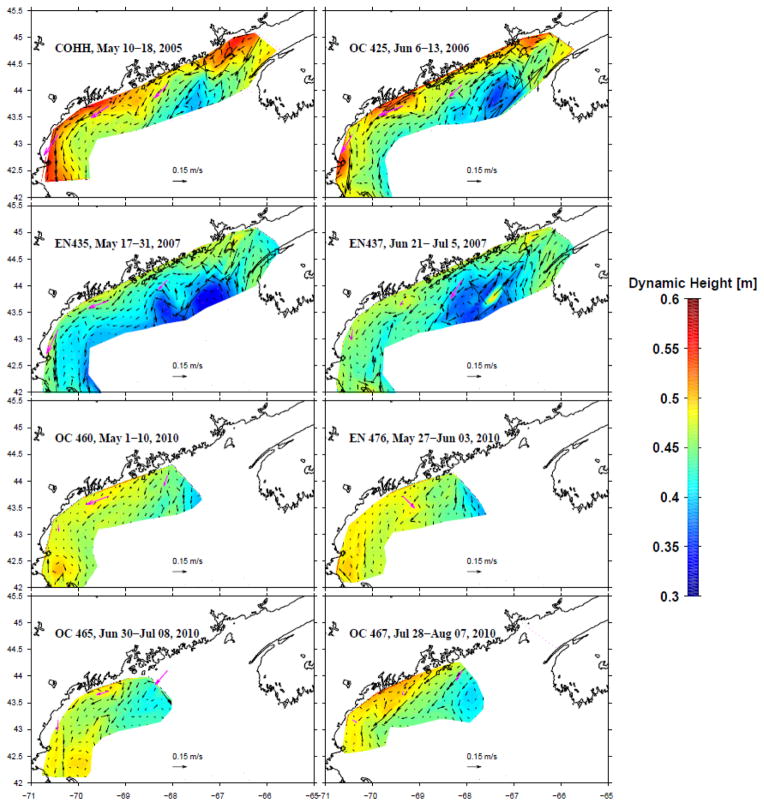
Quasi-synoptic, gulf-wide hydrographic data collected by GOMTOX ship surveys allowed us to examine the density structure and its corresponding dynamic height (DH) and geostrophic flow fields (Fig. 12). We calculated DH by integrating density anomaly relative to the offshore starting point of each cross-shore transect. Geostrophic velocity was computed to balance the local depth-varying pressure gradient that gives zero pressure gradient (and hence the level of no motion) at the seafloor. The geostrophic velocity can be calculated by:
where is the dynamic height computed by integrating the specific volume α(t,s,p) at each station over the water column (e.g., Csanady, 1979; Loder et al., 1997; He and McGillicuddy, 2008).
Fig. 12.
Dynamic height (in meters) and associated surface geostrophic velocity based on hydrographic data collected in May 2005, June 2006, June 2007, May 1–10, 2010, May 27–June 3, 2010, June 30–July 8, 2010, and July 28–August 7, 2010, respectively. Pink vectors in each panel denote the observed mean surface currents measured by NERACOOS buoy B, E and I during each cruise period.
In May 2005, a strong DH gradient induced by the anomalously large freshwater input (He and McGillicuddy, 2008) led to a strong (20 cm s−1) geostrophic flow, which was continuous from the EGOM to the WGOM. The calculations showed that strong geostrophic flows were also present in 2006, although its flow pattern in the WGOM appeared to be more sluggish and less organized than in the EGOM. In May–July 2007, the cross-shore DH gradient and alongshore geostrophic current were strong in the EGOM, but currents in the WGOM became weaker (especially in late June, see EN437 in Fig. 12), which was consistent with weak alongshore current measured in situ at buoy B and E (top two panels, Fig. 11). The cross-shelf DH gradient in May–June 2010 was an order of magnitude smaller than that in 2005–2007. As a result, the alongshore geostrophic currents were the weakest among this set of comparisons.
We can estimate the upper water-column geostrophic transport (Table 1) by integrating the geostrophic current between 5–20 m along a transect off Casco Bay (blue line in Fig. 1d). Alongshore transports were much larger in 2005 and 2006 than in other years. In 2007, the transport decreased by nearly 70% from May to June. Similarly, very weak alongshore transports were also observed in May–June 2010. The flow transport started to pick up afterward, and transport doubled by the end of June. Analyses of de-tided ship-board ADCP current data (Table 1) also suggest that the alongshore transport across the same transect was much weaker in 2010 than those in 2005 and 2006.
Table 1.
Geostrophic transports in 2005, 2006, 2007 and 2010. Each value is obtained by integrating the alongshelf geostrophic/ADCP de-tided velocities over the upper 5–20m along a transect off the Casco Bay (see blue line in Figure 1a).
| Cruise period | May 2005 | Jun 2006 | May 2007 | Jun 2007 | May 1–10 2010 | May 27–Jun 3 2010 | Jun 30–Jul 8 2010 | Jul, 28–Aug 7, 2010 |
|---|---|---|---|---|---|---|---|---|
| Geostrophic alongshore transport (10−2Sv) | 3.55 | 4.56 | 2.92 | 1.01 | 1.39 | 1.30 | 2.73 | 2.94 |
| ADCP alongshore Transport (10−2Sv) | 3.78 | 6.19 | 3.55 | 3.77 | 0.71 | 2.71 | 1.76 | 2.58 |
4. Discussion
4.1 Interannual variability in hydrodynamics
As shown in previous sections, May–June 2010 had one of the weakest alongshore transports in our 10-year study period. What are the possible reasons? Mooring observations show that warmer and saltier than normal subsurface water (>100m) was prominent in Jordan Basin during February–August, 2010 (Fig. 8 and Fig. 10). Based on the T-S properties, we infer the anomaly originated from Warm Slope water (WSW, Houghton and Fairbanks, 2001) and a warm water intrusion through the Northeast Channel that penetrated into the gulf interior. Indeed, such warm water was also seen in the Northeast Channel and may be traced back to August–September, 2009 (McGillicuddy et al., 2011). The distance between buoys M (in Jordan Basin) and N (at the Northeast Channel) is about 210 km. If the intrusion started in February 2010, the estimated speed of the warm water intrusion would be ~4 cm s−1. If the intrusion started around September 2009, then the estimated intrusion speed would be ~ 1 cm s−1. In either case, it is conceivable that slow, but persistent bottom circulation would be able to deliver warm slope water into Jordan basin.
In average conditions, the Maine Coastal Current is largely driven by the cross-shelf pressure gradient between the coast and offshore basins (e.g., Fig. 12). In 2010, the anomalous warm water in Jordan basin increased the dynamic height in offshore water, decreasing the cross-shelf pressure gradient, and consequently reduced the alongshore current.
In addition to the intrusion of WSW, the upwelling index (UI) time series between 2004 and 2011 indicates that 2010 had the most upwelling-favorable wind condition. Southwesterly wind prevailed throughout April–July (Fig. 2), resulting in coastal divergence that also favored the reduction in the southwestward alongshore transport (e.g., Fong et al., 1997; Churchill et al., 2005).
In 2010, strong stratification developed in early April, which was several weeks earlier than in other years (Fig. 7). This was associated with freshening (Fig. 6) caused by the earlier peak of river discharge (Fig. 4). In addition, the surface freshening further offshore (e.g., Jordan Basin M, Fig. 9) suggested an advective origin, associated with the antecedent anomalous warmer- and fresher-than-usual inflow of Scotian Shelf Water (SSW) (McGillicuddy et al., 2011). Thus, both earlier river runoff and upstream SSW inflow fostered the early freshening and stronger stratification in spring and summer 2010.
4.2 Impacts on coastal PSP toxicity
Earlier studies have shown that hydrodynamic transport plays a key role in determining the degree to which offshore blooms of A. fundyense are exposed to coastal shellfish beds (Franks and Anderson, 1992a, b; McGillicuddy et al, 2005a; Stock et al., 2005; He et al., 2008; Li et al., 2009). McGillicuddy et al. (2005b) showed that the relationship between A. fundyense vegetative cell abundance and coastal shellfish toxicity is not statistically significant during years of relatively low cell concentrations (1993, 1994, 2000, 2001 and 2002), suggesting that the interannual variability of coastal toxicity during that time period was regulated more by circulation and transport than the size of the populations themselves. Starting in 2005, the region was prone to more widespread toxicity, especially in the western Gulf of Maine, Massachusetts and Cape Cod Bays, and southern New England (Anderson et al., this issue A; Kleindinst et al, this issue). This “regime shift” has been attributed to an overall increase in the abundance of resting cysts offshore of mid-coast Maine, and interannual fluctuations in toxicity extent from 2005–2009 correlate strongly with cyst abundance (McGillicuddy et al., 2011; Anderson et al., this issue B). A notable departure from this pattern took place in 2010, when toxicity was not nearly as extensive as what was expected based on the high abundance of resting cysts in the fall of 2009. McGillicuddy et al. (2011) hypothesized that poor growing conditions suppressed what otherwise would have been a large bloom, thereby preventing the potential for widespread toxicity from being realized.
Our results suggest that hydrodynamics may have also played a significant role in diminishing the extent of toxicity in 2010. Both moored observations (Fig. 11) and shipboard surveys (Fig. 12) indicate that decreased alongshore flow in the WGOM may have reduced the transport of A. fundyense populations to the south and west, thereby curtailing the alongshore extent of toxicity. This effect may have been augmented by upwelling-favorable wind conditions (Fig. 2), which not only tend to decelerate delivery of A. fundyense cells to the WGOM, but also can spread the cells in the offshore direction (Franks and Anderson, 1992b; Hetland et al., 2002; McGillicuddy et al., 2003). Lastly, we note that the early peak in river runoff (Fig. 4) may have contributed to the unusually fresh (Fig. 6) and highly stratified (Fig. 7) conditions present early in the season. Although these aspects of the oceanographic environment were affected by large-scale water mass anomalies advected into the region (McGillicuddy et al., 2011), local forcing also contributed to the earlier-than-normal stratification. In turn, this would favor earlier-than-normal nutrient depletion, thereby negatively affecting the growing conditions for A. fundyense. Lower ambient nutrient concentrations might also be part of long-term trend of decreased inflow of nutrient-rich slope water through the NEC (Pettigrew et al., 2010; Smith et al., 2012; Townsend et al., 2010), and increased SSW inflow.
Another episode of reduced transport in the WGOM took place in June–July 2007 (Fig. 12). Alongshore currents at buoys B and E in July 2007 were among the weakest of all the Julys in the time-series (Fig. 11). Possibly due to this sluggish transport, the coincident PSP closures in 2007 were second only to 2010 in their limited along-coast extent (McGillicuddy et al., 2011). In contrast, the strong coastal flow in 2005 (e.g., He and McGillicuddy, 2008) coincided with one of the most extensive toxicity closures in the last 30 years (Anderson et al., 2005). Although hindcast simulations suggest increased cyst abundance was the primary cause of the widespread bloom in 2005 (e.g., He et al., 2008; Li et al., 2009), hydrodynamic conditions clearly favored exposure of coastal shellfish beds to the toxic algae.
In an effort to quantify these relationships, we tested several linear regression models relating toxicity extent to alongshore currents and cyst abundance. Although such relationships were statistically significant for subsets of the data, no robust relationship emerged from the complete time series (2004–2010). The failure of these simple regression models is likely due to the absence of other complex physical and biological factors, such as pre-bloom nutrient conditions, delivery of offshore blooms through cross-shelf transport, and other processes that are difficult to parameterize based on limited observations. Nevertheless, it is clear that the smaller alongshore toxicity extents such as in 2010 and 2007 coincided with weakened alongshore currents, and that the extensive toxicity closure in 2005 coincided with strong alongshore flow in the same year. Thus, there appears to be some linkage between coastal circulation and the alongshore extent of toxicity in the WGOM.
5. Conclusions
In situ observations including long-term moored meteorological and oceanographic measurements and multi-year gulf-wide ship survey data were used to quantify interannual variability of surface wind, river runoff, and hydrographic conditions in the Gulf of Maine during summers 2002–2011. Significant interannual variability was found in the local forcing (i.e., wind and river runoff). The CUI showed that the upwelling (downwelling)-favorable wind conditions were most persistent in 2010 (2005) respectively over the 9-year study period. River discharge was highest in 2005, whereas the peak runoff started in early April in 2010 as opposed to late April to mid-May in other years.
Coastal hydrography (temperature, salinity, stratification) influenced by both local and deep-ocean forcing also displayed strong interannual variations. Coastal water temperature was 0.5–2 °C warmer than average in summer 2010, and about 2 °C colder than average in 2004. Coastal salinity in April 2010 was the lowest in the 10-year study period. Both moored ADCP current measurements and dynamic height/geostrophic velocity calculations based on gulf-wide synoptic ship survey data show May–June 2010 had weak alongshore transport in the western Gulf of Maine. The reduction in alongshore current was likely influenced by a combined effect of a subsurface warm water intrusion through NEC, and anomalously warm and fresh SSW inflow (e.g., McGillicuddy et al., 2011). However, our analysis showed that upwelling-favorable wind conditions in 2010 also contributed to the decreased alongshore transport, further favoring the reduced alongshore extent of toxicity. In contrast, widespread coastal toxicity in 2005 was accompanied by strong alongshore currents and downwelling-favorable winds, which tend to increase the exposure of coastal shellfish beds to offshore populations of A. fundyense. These observations suggest linkage between coastal transport and the alongshore extent of toxicity in the WGOM.
Acknowledgments
We thank the Northeastern Regional Association of Coastal and Ocean Observing Systems (NERACOOS) for providing the mooring data used in this study; we thank Linda Mangum for her assistance with these data. River outflow data were supplied by the United States Geological Survey.
We gratefully acknowledge support of the National Oceanic Atmospheric Administration (grant NA06NOS4780245 for the Gulf of Maine Toxicity (GOMTOX) program). Additional support for DJM was provided by the Woods Hole Center for Oceans and Human Health through National Science Foundation grants OCE-0430724 and OCE-0911031 and National Institute of Environmental Health Sciences grant 1P50- ES01274201.
This is the Ecology and Oceanography of Harmful Algal Blooms Program contribution number 729.
References
- Anderson DM, Keafer BA, McGillicuddy DJ, Mickelson MJ, Keay KE, Libby PS, Manning JP, Mayo CA, Wittaker DK, Hickey JM, He R, Lynch DR, Smith KW. Initial observation of the 2005 Alexandrium fundyense bloom in the southern New England: general patterns and mechanisms. Deep Sea Research II. 2005;52:2856–2876. [Google Scholar]
- Anderson DM, Couture DA, Keafer BA, Kleindinst JL, McGillicuddy DJ, Martin JL, Hickey JM. Understanding interannual, decadal level variability in PSP toxicity in the Gulf of Maine: a HAB Index and Alexandrium fundyense cyst abundance. Submitted, Deep-Sea Research II. doi: 10.1016/j.dsr2.2013.09.018. this issue. [DOI] [PMC free article] [PubMed] [Google Scholar]
- Anderson DM, Keafer BA, McGillicuddy DJ, Martin J, Norton K, Pilskaln C, Smith J. Alexandrium fundyense cysts in the Gulf of Maine: time series of abundance and distribution, and linkages to past and future blooms. Deep-Sea Research II. doi: 10.1016/j.dsr2.2013.10.002. this issue. this issue B. [DOI] [PMC free article] [PubMed] [Google Scholar]
- Aretxabaleta AL, McGillicuddy DJ, Smith KW, Manning JP, Lynch DR. Model Simulations of the Bay of Fundy Gyre: 2. Hindcasts for 2005–2007 Reveal Interannual Variability in Retentiveness. Journal of Geophysical Research. 2009;114:C09005. doi: 10.1029/2008JC004948. [DOI] [PMC free article] [PubMed] [Google Scholar]
- Bigelow HB. Physical Oceanography of the Gulf of Maine. Fisheries Bulletin. 1927;40:511–1027. [Google Scholar]
- Bisagni JJ, Smith PC. Eddy-induced flow of Scotian Shelf water across Northeast Channel, Gulf of Maine. Continental Shelf Research. 1998;18:515–539. [Google Scholar]
- Brooks DA. A model study of the buoyancy-driven circulation in the Gulf of Maine. Journal of Physical Oceanography. 1994;24:2387–2412. [Google Scholar]
- Brown WS, Irish JD. The annual variation of the mass structure in the Gulf of Maine: 1986–1987. Journal of Marine Research. 1993;51:53–107. [Google Scholar]
- Butman B, Sherwood CR, Dalyande PS. Northeast storms ranked by wind stress and wave-generated bottom stress observed in Massachusetts Bay, 1990–2006. Continental Shelf Research. 2008;28(10–11):1231–1245. [Google Scholar]
- Churchill JH, Pettigrew NR, Signell RP. Structure and Variability of the Western Maine Coastal Current. Deep Sea Research II. 2005;52:2392–2410. [Google Scholar]
- Csanady GT. The Pressure Field Along the Western Margin of the North Atlantic. Journal of Geophysical Research. 1979;84(C8):4905–4915. doi: 10.1029/JC084iC08p04905. [DOI] [Google Scholar]
- Fong DA, Geyer WR, Signell RP. The wind-forced response on a buoyant coastal current: Observations of the western Gulf of Maine plume. Journal of Marine System. 1997;12(1–4):69–81. [Google Scholar]
- Franks PJS, Anderson DM. Toxic phytoplankton blooms in the southwestern Gulf of Maine: Testing hypotheses of physical control using historical data. Marine Biology. 1992a;112:165–174. [Google Scholar]
- Franks PJS, Anderson DM. Alongshore transport of a toxic phytoplankton bloom in a buoyancy current: Alexandrium tamarensis in the Gulf of Maine. Marine Biology. 1992b;112:153–164. [Google Scholar]
- Geyer WR, Signell RP, Fong DA, Wang J, Anderson DM, Keafer BA. The freshwater transport and dynamics of the Western Maine Coastal Current. Continental Shelf Research. 2004;24:1339–1357. [Google Scholar]
- He R, McGillicuddy DJ. The historic 2005 Toxic Bloom of Alexandrium fundyense in the west Gulf of Maine- Part 1: In Situ Observations of Coastal Hydrography and Circulation. Journal of Geophysical Research. 2008;113:C07039. doi: 10.1029/2007JC004601. [DOI] [PMC free article] [PubMed] [Google Scholar]
- He R, McGillicuddy DJ, Keafer BA, Anderson DM. Gulf of Maine Harmful Algal Bloom in summer 2005- Part 2: Coupled Bio-physical Numerical Modeling. Journal of Geophysical Research. 2008;113:C07040. doi: 10.1029/2007JC004602. [DOI] [PMC free article] [PubMed] [Google Scholar]
- Hetland RD, McGillicuddy DJ, Signell RP. Cross-frontal entrainment of plankton into a buoyant plume: the frog tongue mechanism. Journal of Marine Research. 2002;60:763–777. [Google Scholar]
- Houghton RW, Fairbanks RG. Water sources for Georges Bank. Deep-Sea Research II. 2001;48:95–114. [Google Scholar]
- Keafer BA, Churchill JH, McGillicuddy DJ, Anderson DM. Bloom development and transport of toxic Alexandrium fundyense population within a coastal plume in the Gulf of Maine. Deep Sea Research II. 2005;52:2674–2697. [Google Scholar]
- Kleindinst JL, Anderson DM, McGillicuddy DJ, Stumpf RP, Fisher KM, Couture DA, Hickey JM, Nash C. Categorizing the severity of PSP outbreaks in the Gulf of Maine for forecasting and management. Deep-Sea Research II. doi: 10.1016/j.dsr2.2013.03.027. Submitted. [DOI] [PMC free article] [PubMed] [Google Scholar]
- Large WG, Pond S. Open ocean momentum flux measurements in moderate to strong winds. Journal of Physical Oceanography. 1981;11:324–336. [Google Scholar]
- Limeburner R, Beardsley RC. Near-surface recirculation over Georges Bank. Deep Sea Research II. 1996;43:1547–1574. [Google Scholar]
- Li Y, He R, McGllicuddy DJ, Anderson DM, Keafer BA. Investigation of the 2006 Alexandrium fundyense Bloom in the Gulf of Maine: In situ Observations and Numerical Modeling. Continental Shelf Research. 2009 doi: 10.1016/j.csr.2009.07.012. [DOI] [PMC free article] [PubMed] [Google Scholar]
- Li Y, He R, Manning JP. The coastal connectivity in the Gulf of Maine. submitted to Deep Sea Research II. 2012 this issue. [Google Scholar]
- Loder JW, Han G, Hannah CG, Greeberg DA, Smith PC. Hydrography and baroclinic circulation in the Scotian shelf region: winter vs. summer. Canadian Journal of Fisheries and Aquatic Science Supplement. 1997;54:40–56. [Google Scholar]
- Lynch DR, Ipa JT, Naimie CE, Wernerb FE. Comprehensive coastal circulation model with application to the Gulf of Maine. Continental Shelf Research. 1996;16–7:875–906. [Google Scholar]
- Lynch DR, Holboke MJ, Naimie CE. The Maine coastal current: Spring climatological circulation. Continental Shelf Research. 1997 May17(6):605–634. [Google Scholar]
- Manning JP, McGullicuddy DJ, Pettigrew NR, Churchill JH, Incze LS. Drifter observations of the Gulf of Maine Coastal Current. Continental Shelf Research. 2009;29(7):835–845. doi: 10.1016/j.csr.2008.12.008. [DOI] [PMC free article] [PubMed] [Google Scholar]
- McGillicuddy DJ, Signell RP, Stock CA, Keafer BA, Keller MD, Hetland RD, Anderson DM. A mechanism for offshore initiation of harmful algal blooms in the coastal Gulf of Maine. Journal of Plankton Research. 2003;25(9):1131–1138. [Google Scholar]
- McGillicuddy DJ, Anderson DM, Lynch DR, Townsend DW. Mechanisms regulating large-scale seasonal fluctuations in Alexandrium fundyense populations in the Gulf of Maine: Results from a physical-biological model. Deep Sea Research II. 2005a;52:2698–2714. [Google Scholar]
- McGillicuddy DJ, Anderson DM, Solow AR, Townsend DW. Interannual variability of Alexandrium fundyense abundance and shellfish toxicity in the Gulf of Maine. Deep-Sea Research II. 2005b;52:2843–2855. [Google Scholar]
- McGillicuddy DJ, Townsend DW, He R, Keafer BA, Kleindinst JL, Li Y, Manning JP, Mountain DG, Thomas MA, Anderson DM. Suppression of the 2010 Alexandrium fundyense bloom by changes in physical, biological, and chemical properties of the Gulf of Maine. Limnology and Oceanography. 2011;56(6):2411–2426. doi: 10.4319/lo.2011.56.6.2411. [DOI] [PMC free article] [PubMed] [Google Scholar]
- Mountain DG, Manning JP. Seasonal and interannual variability in the properties of the surface waters of the Gulf of Maine. Continental Shelf Research. 1994;14:1555–1581. [Google Scholar]
- Mountain DG, Strout G, Beardsley R. Surface heat flux in the Gulf of Maine. Deep Sea Research II. 1996;43:1533–1546. [Google Scholar]
- Pettigrew NR, Churchill JH, Janzen CD, Mangum LJ, Signell RP, Thomas AC, Townsend DW, Wallinga JP, Xue H. The kinematic and hydrographic structure of the Gulf of Maine coastal current. Deep Sea Research, Part II. 2005;52:19–21. 2369–2391. [Google Scholar]
- Pettigrew NR, Fleming RJ, Fikes CP. The history of the first decade of the observing system in the Gulf of Maine, and plans for the second decade. MTS Journal. 2011 Sep;:1–10. [Google Scholar]
- Schwing FB, O’Farrell M, Steger JM, Baltz K. Coastal upwelling indices, West Coast of North America, 1946 – 1995. NOAA Technical Memo. NOAA-TM-NMFS-SWFSC-231. 1996:144. [Google Scholar]
- Smith PC, Houghton RW, Fairbanks RG, Mountain DG. Interannual variability of boundary fluxes and water mass properties in the Gulf of Maine and on Georges Bank: 1993–1997. Deep-Sea Research II. 2001;48:37–70. [Google Scholar]
- Smith PC, Pettigrew NR, Yeats P, Townsend DW, Han G. Regime shift in the Gulf of Maine. In: Stephenson RL, Annala JH, Runge JA, Hall-Arber M, editors. Advancing an Ecosystem Approach in the Gulf of Maine; American Fisheries Society, Symposium 79; Bethesda, MD. 2012. pp. 185–203. [Google Scholar]
- Stock CA, McGillicuddy DJ, Solow AR, Anderson DA. Evaluating hypothesis for the initiation and development of Alexandrium fundyense blooms in the western Gulf of Maine using a coupled physical-biological model. Deep Sea Research II. 2005;52:2715–2744. [Google Scholar]
- Thomas AC, Weatherbee R, Xue H, Liu G. Interannual variability of shellfish toxicity in the Gulf of Maine: Time and space patterns and links to environmental variability. Harmful Algae. 2010;9:458–480. doi: 10.1016/j.hal.2010.03.002. [DOI] [Google Scholar]
- Townsend DW, Rebuck ND, Thomas MA, Karp-Boss L, Gettings RM. A changing nutrient regime in the Gulf of Maine. Continental Shelf Research. 2010;30:820–832. [Google Scholar]
- Xue H, Chai F, Pettigrew NR. A model study of the seasonal circulation in the Gulf of Maine. Journal of Physical Oceanography. 2000;30(5):1111–1135. [Google Scholar]


