Abstract
PLGA nanoparticles, separately loaded with etoposide (ETN) and quercetin dihydrate (QDN), were prepared by adapting the solvent diffusion (nanoprecipitation) technique. The effect of formulation variables such as amount of polymer, theoretical drug loading, surfactant concentration, and aqueous and organic phase volumes on particle size and entrapment efficiency, were systematically studied. The optimal formulations obtained were of submicron size (153.4 ± 4.2 nm for ETN and 148.6 ± 1.6 nm for QDN) and with low polydispersity indices (0.058 ± 0.02 for ETN and 0.088 ± 0.03 for QDN). The entrapment efficiencies were found as 63.88 ± 1.5 % and 41.36 ± 3.4 % for ETN and QDN, respectively. The characterization of ETN and QDN was done by measuring the zeta potential, TEM, and DSC analysis. The comparison was made in respect of in vitro cytotoxicity assay using cancer cell line A549 (human lung adenocarcinoma epithelial cell line). The results revealed significant increase in cytotoxicity in nanoparticle formulations than their respective free drug. The comparison was also made with respect to cytotoxic activity of individual drug and combination of drugs in the form of free drugs as well as nanoparticles. The combination treatment in the form of nanoparticles is found to produce best results among the treatments used in cytotoxicity studies.
Keywords: PLGA nanoparticles, Nanopreciptation technique, Etoposide, Quercetin dihydrate, A549 cell line
Introduction
Molecular biology opened new vistas for cancer treatment as new pathways and targets that are involved in cancer induction and progression are becoming accessible. Cancer development process is the net result of various interdependent events such as abnormal signal transduction and intercellular communication mechanisms, biochemical interactions leading to genetic instability, angiogenesis, invasion, metastasis, and immune evasion. Each of these events can serve as target. A multitargeting approach will block the biochemical and physiological pathways that support cancer development at various levels thus rational for combination therapy lies in the fact that a well-designed combination will target more procancer mechanisms and maximize the therapeutic benefit (Yance and Sagar 2006).
Angiogenesis is one of these key processes, responsible for cancer progression. It is a prerequisite for tumor development and metastasis. Judah Folkman in 1971 proposed “antiangiogenesis” for producing tumor regression or slowing down the tumor growth (Folkman 1971). Later, modern research on tumor angiogenesis and therapeutic antiangiogenic agents has excelled at par, in last 40 years. As a result of that, several antiangiogenic agents are in clinical trials and some drugs like bevacizumab (Avastin), a recombinant humanized anti-VEGF monoclonal antibody (Jain et al. 2004; Ferrara et al. 2004; Kim et al. 1993), was approved for the treatment of metastatic colorectal cancer (Hurwitz et al. 2004) and non-small cell lung cancer (Sandler et al. 2006) in combination with chemotherapy.
Initial clinical studies revealed that single antiangiogenic agents are not much effective in advanced stage tumors. Instead these studies were helpful in establishing the principles related to combination regimes of antiangiogenics with cytotoxic treatment (Gasparini et al. 2005) and as a result of this, therapy combining cytotoxic agent and antiangiogenic agent is undergoing vigorous research in recent times. On the basis of this strategy, we tried to explore the benefit of combination therapy of etoposide (cytotoxic agent) and quercetin dihydrate (antiangiogenic agent) in comparison with single agent therapy.
Etoposide [4'-Demethylepipodophyllotoxin 9-(4, 6-O-Ethylidene-β-D-Glucopyranoside)], an antineoplastic agent, is a semisynthetic derivative of podophyllotoxin. It inhibits DNA topoisomerase II, thereby inhibiting DNA synthesis. Etoposide is cell cycle dependent and phase specific, affecting mainly the S and G2 phases. It has been used for treatment of a wide variety of malignancies, including lung cancer, germ-cell malignancies, leukemias, non-Hodgkins lymphoma, Kaposi's sarcoma, soft tissue sarcomas, neuroblastoma, and gastric cancer (Jasti et al. 1995; Hande 1998, 2008). Common toxicities from etoposide include bone marrow suppression, nausea, vomiting, and alopecia. At very high doses, such as those used with bone marrow transplantation regimens, mucositis liver toxicity, fever, and chills may also occur. Palmar–plantar eruptions and irritation of the anal canal, hypersensitivity reactions, including vasomotor changes in the pulmonary and gastrointestinal systems have been associated with etoposide use. The most serious adverse event associated with etoposide is the development of acute myelogenous leukemia. In addition, resistance to etoposide arises through multiple mechanisms like mutations at ser-1106 in the topoisomerase II molecule. Rapid repair of DNA breaks caused by etoposide reduce sensitivity to etoposide (Hande 2008).
Many natural compounds inhibit cancer by interfering with one or more of the mechanisms that are central to cancer progression. Many natural polyphenolic compounds like (e.g., quercetin, genestein, and curcumin) have been shown to have antiangiogenic properties in vitro and in vivo (Boik 2001; Furness et al. 2005).
Quercetin (3,3′,4′,5,7-penthydroxy flavone) is an important polyphenolic bioflavonoid, more specifically flavonol and is found in many fruits and vegetables (Spoerke 2003; Boik 2001). It has demonstrated various pharmacological activities including antioxidant activity by scavenging free radicals, prevention of atherosclerosis, and chronic inflammation (Havesteen 1983; Corvazier and Maclouf 1985). Quercetin has also shown anticarcinogenic activity to numerous cancer cell types, including breast, leukemia, colon, ovary and squamous cell, endometrial, gastric, and non-small-cell lung (Painter 1998). Quercetin exhibited several functions to be a potential anticancer compound. These functions include cell cycle regulation, interaction with type II estrogen binding sites, reversal of multidrug-resistance, and blockage of cellular signal transduction which inhibits the ras cascade and induces apoptosis (Yoshida et al. 1990; Scambia et al. 1993; Kim et al. 1998; Xiao et al. 1998). In Addition, quercetin effectively inhibits tyrosine kinase activity (Levy et al. 1984). The role of polyphenolic compounds in cancer chemoprevention and chemotherapy has been extensively reviewed by Ramos (Ramos 2008).
Quercetin has been reported to show significant antiangiogenic potential by inhibiting angiogenesis through multiple mechanisms. These include interaction with the COX-2 and lipoxygenase (LOX)-5 enzymes, the EGF receptor, the HER-2 intracellular signaling pathway, and the NF-κB nuclear transcription protein (Igura et al. 2001; Tan et al. 2003).
Beneficial combinations of quercetin with other anticancer drugs have been reported. A prostate cancer xenograft model showed that quercetin could enhance the anticancer effects of tamoxifen through antiangiogenesis (Ma et al. 2004). Quercetin has been shown to increase the therapeutic efficacy of cisplatin both in vivo and in vitro. In mice bearing human tumor xenografts, intraperitoneal treatment with a combination of 20 mg/kg quercetin and 3 mg/kg cisplatin led to a significantly reduced tumor growth compared to treatment with either drug alone (Hofmann et al. 1990). In an another in vitro study using human ovarian and endometrial cancer cell lines, addition of 0.01 to 10 μM quercetin to cisplatin caused 1.5- to 30-fold potentiation of the cytotoxic effect of cisplatin (Scambia et al. 1992) and also protected normal renal tubular cells from cisplatin toxicity (Kuhlman et al. 1998). Quercetin showed synergistic activity with busulphan against human leukemia cell lines (Hoffman et al. 1989). Addition of 1–10 μM quercetin to adriamycin treatment led to a dose-dependent increase in cytotoxicity compared with treatment with adriamycin alone in cultured multidrug-resistant human breast cancer cell lines (Scambia et al. 1994). Quercetin has also been shown in vitro to increase the cytotoxic effect of cyclophosphamide (Hofmann et al. 1988), and to decrease resistance to gemcitabine and topotecan (Sliutz et al. 1996).
One of the important concerns in chemotherapy is chances of DNA damage in healthy bone marrow cells during treatment with etoposide, without compromising the antitumor potency of the drug. Cierniak and Kapiszewska (2002) and Cierniak et al. (2004) investigated modulatory effect of quercetin on DNA damage, and reported major protection against etoposide-induced DNA damage in bone marrow cells.
Effects of prolonged administration of quercetin, causing the decrease in genotoxicity of etoposide treatment, may indicate that nutritional strategies for preventing or ameliorating the DNA damage in normal cells is possible (Cierniak and Kapiszewska 2002; Cierniak et al. 2004). This literature supports the selection of drugs for our investigations.
Further drugs administered in free forms may evoke problems like toxicity. When such drugs are encapsulated in nanoparticles, they are able to change the biodistribution properties of drugs and target the tumor tissue effectively. They improve the therapeutic effects and reduce the side effects of the formulated drugs. Poly(D,L-lactide-co-glycolide) (PLGA) is FDA-approved biodegradable polymer, which is used most often for sustained, controlled, and targeted drug delivery (Desai et al. 1996; Fonseca et al. 2002).
It is reported that nanoparticles larger than 200 nm can be mechanically filtered in the spleen while those smaller than 100 nm left the blood vessels through fenestrations in endothelial lining (Stolnik et al. 1995; Tabata and Ikada 1990). Thus to deliver drugs to tumor, by passive targeting by surpassing reticuloendothelial system, nanoparticles with relatively small size in the range of 100–200 nm were desirable (Song et al. 2008).
The main objective of the present study was to formulate PLGA nanoparticles (NPs) below 200 nm, loaded with etoposide (ET) and quercetin dihydrate (QD) individually. These formulations can be co-administered as anticancer–antiangiogenic combination. As they are separately loaded, there lies an advantage of designing a dose according to requirement. Passive targeting is expected to achieve by maintaining the size of PLGA NPs below 200 nm. In addition to formulation, optimization is an effective method of studying the significance of a number of variables. In vitro drug release study and in vitro cell line studies such as cytotoxicity assay were conducted using A549 cell line to evaluate in vitro formulation performance in comparison to the plain drug.
Materials and methods
Materials
PLGA 502H, (lactide/glycolide ratio 50:50, inherent viscosity 0.22 dl/g) was obtained as a gift sample from Boehringer Ingelheim, Germany. Etoposide (ET) was obtained as a gift sample from Cadilla Pharma, Ahmedabad, India. Quercetin dihydrate (extrapure grade; QD) was purchased from Sisco Research Laboratories Pvt. Ltd., Mumbai, India. Poloxamer-407 (Lutrol F-127) was obtained as a gift sample from Sun Pharma Advanced Research Company Ltd. (SPARC), Vadodara, India. Lung adenocarcinoma cell line A549 was purchased from National Centre for Cell Science (NCCS), Pune, India. (MTT) 3-[4,5-dimethylthiazol-2-yl]-2,5-diphenyltetrazolium bromide was purchased from HiMedia, India. All other chemicals and solvents used were of analytical grade.
Preparation of nanoparticles
PLGA nanoparticles loaded with ET and QD (ETN and QDN) were prepared by nanoprecipitation (solvent diffusion) method (Mohanraj and Chen 2006). 100 mg of PLGA polymer along with drug (ET or QD) dissolved in 6 ml acetone and then poured in a controlled manner (0.3 ml/min) into 12 ml of 0.25 % aqueous solution of Poloxamer-407, with mild constant stirring. Spontaneous diffusion of acetone to aqueous phase creates an interfacial turbulence that leads to formation of nanoparticles. The resulting nanoparticle dispersion was further stirred to evaporate the organic phase for 3–4 h. The nanoparticles were recovered by centrifugation (Sigma Centrifuge 3K30, Germany, 10,000 rpm, 20 min, 2 cycles), washed twice with distilled water, redispersed, and lyophilized (Heto Drywinner, Denmark) with trehalose as cryoprotectant. Each batch was prepared in triplicate.
The parameters considered for optimization were polymer concentration, surfactant concentration, organic phase volume, aqueous phase volume, and theoretical drug loading. The entrapment efficiency and the particle size were the response parameters for the optimization.
The above process parameters were optimized individually for ET and QD for getting the particle size below 200 nm with maximum drug entrapment efficiency (DEE) as presented in Figs. 1 and 2, respectively, for ET and QD. Unless otherwise mentioned, all the experiments were conducted by varying one of the parameters while keeping all other parameters at a set of standard conditions which are mentioned in preparation of nanoparticles.
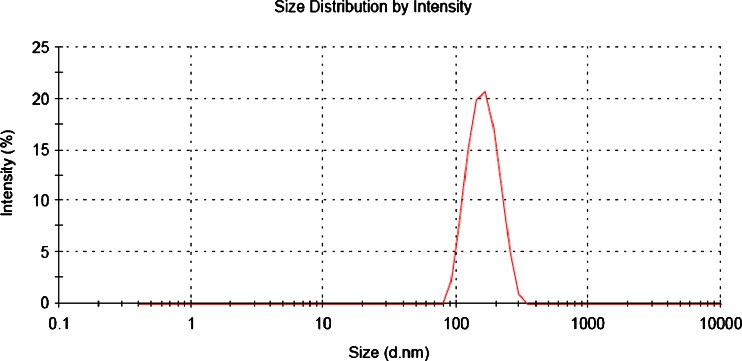
Fig. 1.
Typical particle size distribution curve of ETN formulation
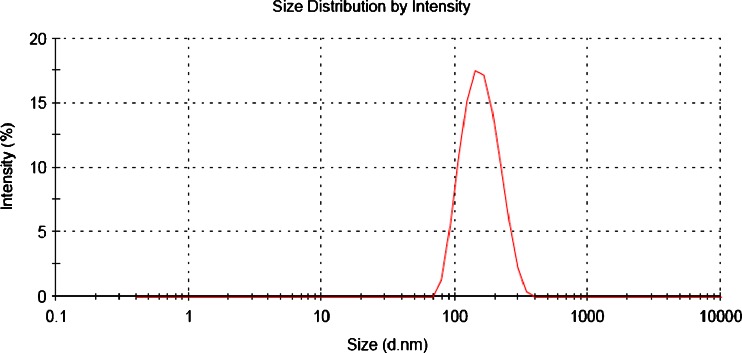
Fig. 2.
Typical particle size distribution curve of QDN formulation
Characterization of nanoparticle formulations
Particle size, particle size distribution, and zeta potential measurement
The particle size measurements were performed using Malvern Zetasizer Nanoseries (Malvern Instruments Ltd., Malvern, UK), which evaluates mean diameter and size distribution profiles along with Polydispersity indices (PDI) of NPs by Dynamic Light Scattering based on Photon Correlation Spectroscopy (PCS). The nanoparticulate dispersions were suitably diluted in redistilled water so that the count rate of NPs lies in the range of 200 to 400 and measurements were done at 25°C. The report is presented in Figs. 1 and 2, respectively, for ET and QD. Zeta potential of NPs was measured in redistilled water in same instrument at 25°C following the same dilution as for size measurement. Each measurement was done in triplicate.
The effect of optimization parameters which includes polymer concentration, aqueous phase volume, surfactant concentration, theoretical drug loading, and organic phase volume on particle size of ETN and QDN is presented in Fig. 3(a, b, c, d, and e, respectively).
Fig. 3.
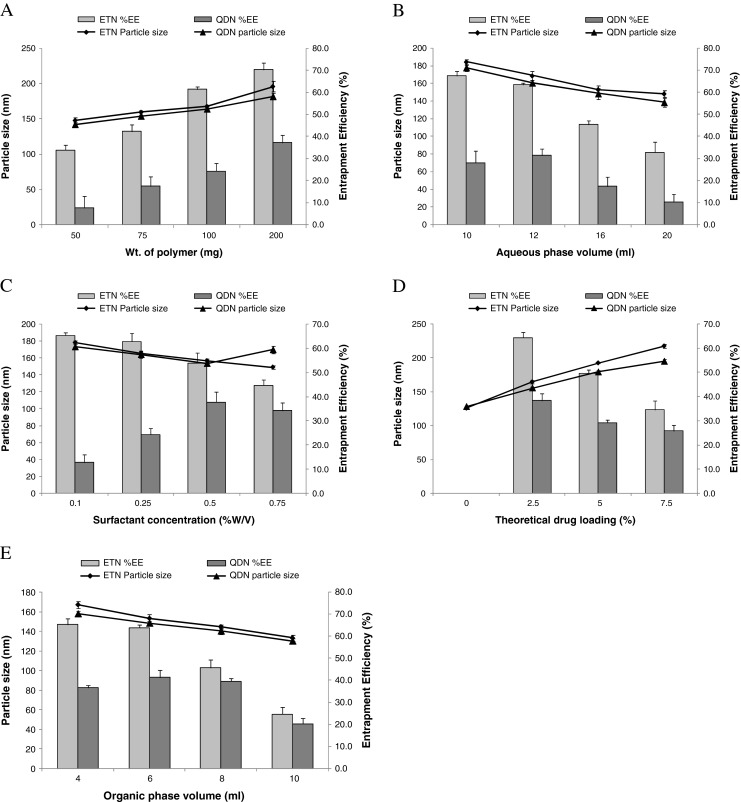
Effect of various processing parameters on mean particle size and DEE of ETN and QDN. a Amount of polymer; b aqueous phase volume; c surfactant concentration; d theoretical drug loading; e organic phase volume
Determination of entrapment efficiency
The amount of ET/QD entrapped in NPs was estimated by suspending 10 mg of NPs in aqueous medium and recovering the NPs pellet by centrifugation for 30 min at 20,000 rpm (Sigma 3 K30, Germany). It was then dissolved in acetonitrile and the solutions were analyzed for ET and QD content in UV-visible spectrophotometer (UV-vis Pharmaspec, Shimadzu1700, Japan) at 283.5 and 368.0 nm, respectively. The entrapment efficiencies of ET and QD are calculated as percent ratio of actual amount of drug in NPs to the total amount of drug incorporated in formulation.
Transmission electron microscopy
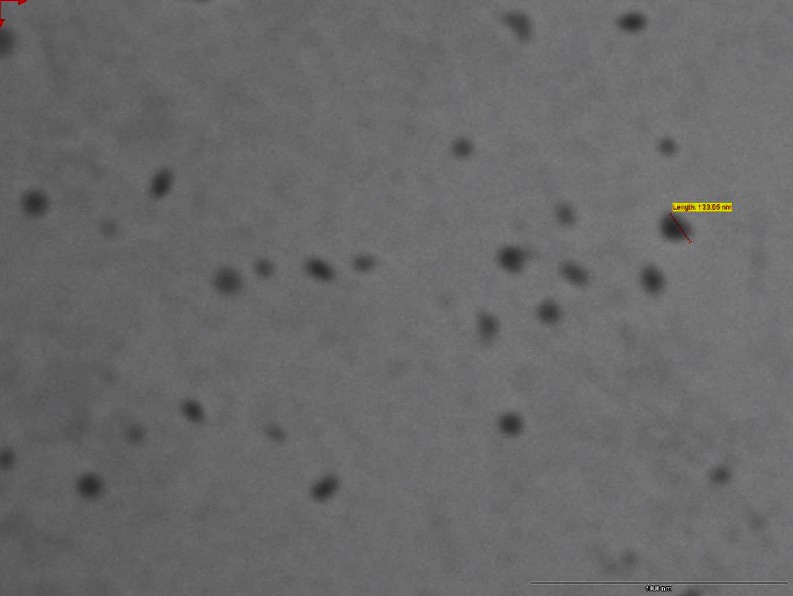
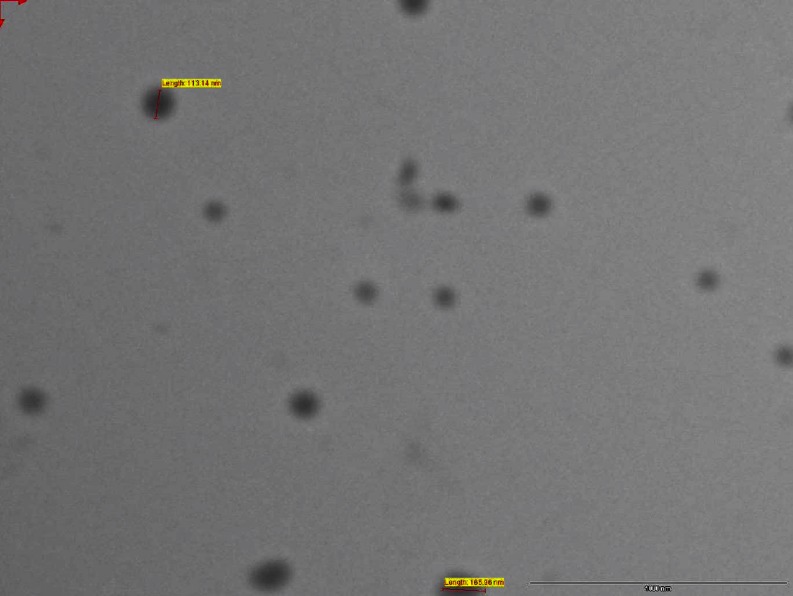
The morphology of the ETN and QDN was examined by Transmission Electron Microscope (Philips Tecnai-20, Holland). Before analysis, NPs were dispersed in de-ionized distilled water and one drop of the diluted dispersion was placed on 200-mesh carbon-coated copper grid for observation. Two percent uranyl acetate was used as staining agent for nanoparticles. The transmission electron microscopy (TEM) images of ETN and QDN were shown in Figs. 4 and 5, respectively.
Fig. 4.
Transmission electron micrograph of ETN
Fig. 5.
Transmission electron micrograph of QDN
Differential scanning calorimetry
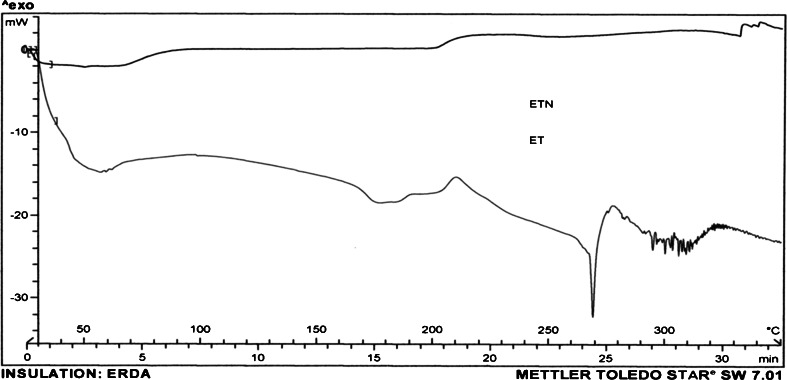
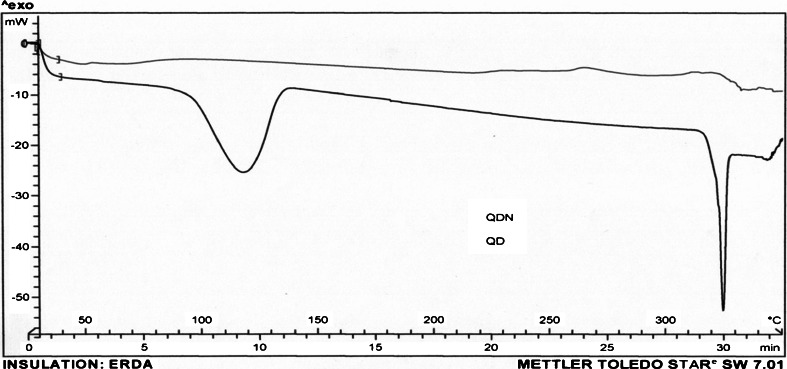
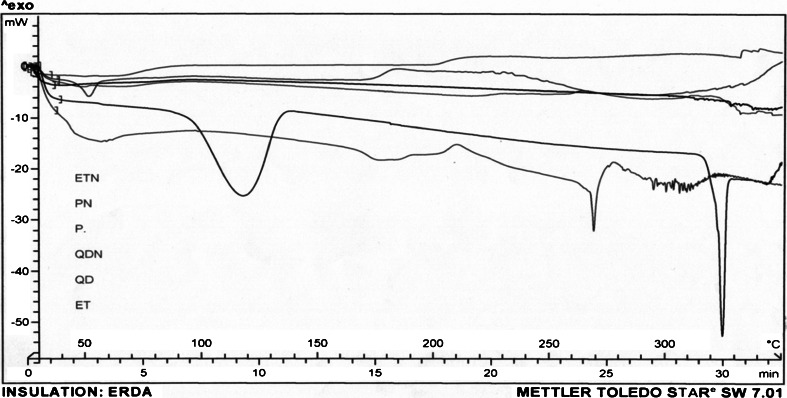
The physical state of ET and QD loaded in NPs was investigated by differential scanning calorimetry (DSC; Mettler Toledo, Switzerland). About 5 mg of sample of freeze-dried nanoparticles, i.e., ETN and QDN, was heated from 50 to 350°C at a heating rate of 10°C/min (Figs. 6 and 7). The DSC thermograms were also obtained for drugs ET and QD, PLGA(50:50) (P), and plain NPs (PN) which served as controls (Fig. 8).
Fig. 6.
DSC curves of ET and ETN
Fig. 7.
DSC curves of QD and QDN
Fig. 8.
DSC curves of P, PN, ET, ETN, QD, and QDN. The DSC curves are shown in sequence as they are appearing in the center of figure from top to bottom
In vitro drug release from ETN and QDN
In vitro release studies of ET and QD from PLGA NPs were carried out at 37 ± 2°C by dialysis bag diffusion technique. Briefly, 2.0 ml of the aqueous nanoparticulate dispersion was placed in cellulose dialysis bag (cut off 12000, HiMedia, India) and immersed in the 20.0 ml of pH 7.4 phosphate buffer solution in recipient compartment and stirred at about 100 rpm with magnetic stirrer. BSA (3 mg/ml) was added to pH 7.4 phosphate buffer used for the QD release study to stabilize the drug in buffer. The samples from the recipient compartment were withdrawn at predetermined time intervals and replaced with the fresh release medium. The samples were analyzed for the drug content using UV-vis spectrophotometer (UV-vis, Shimadzu 1701, Japan). A control experiment to determine the release behavior of the free drugs was also performed in the same way using the drug solutions. All experiments were performed in triplicate and average values were calculated. The release profiles are presented in Fig. 9
Fig. 9.
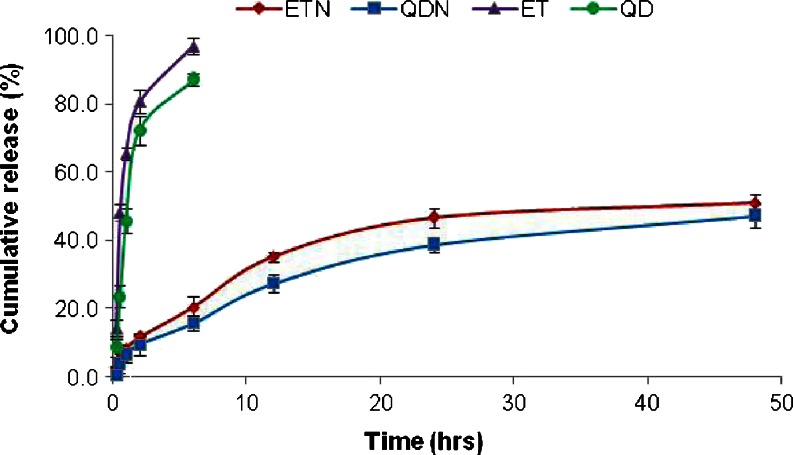
Comparison of In vitro release profile of ETN and QDN with the plain drugs ET and QD. (Mean ± SD, n = 3)
Cytotoxicity study by MTT assay
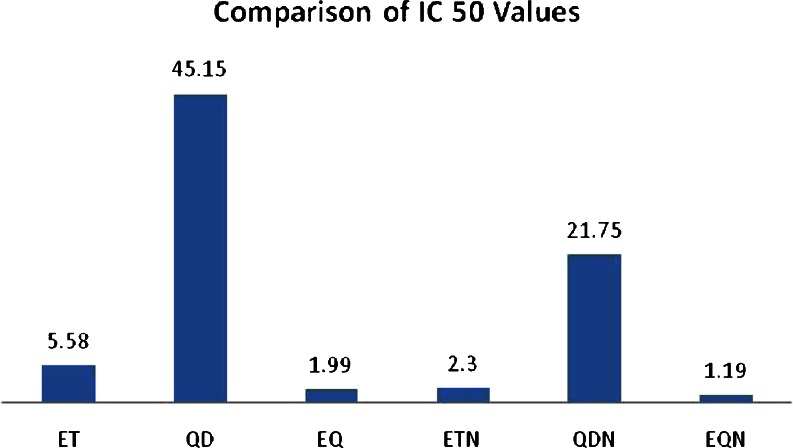
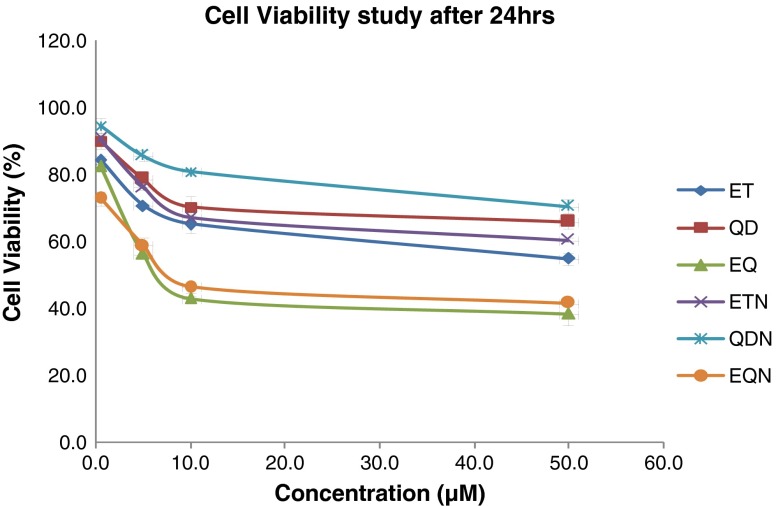
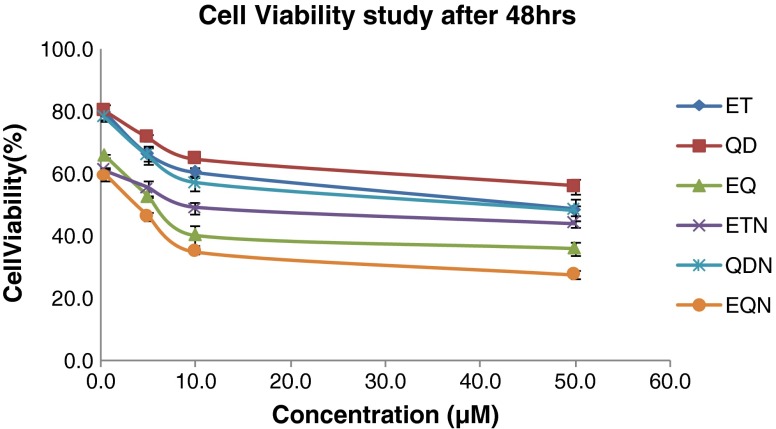
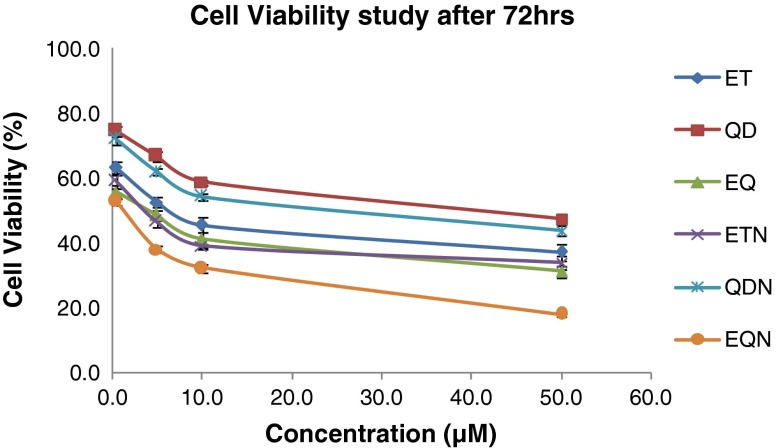
The in vitro cytotoxic activities of the nanoparticle formulations (ETN and QDN) were investigated in comparison with free drug solutions of ET and QD on A549 cancer cell line. The comparison was also made with respect to cytotoxic activity of single drug and combination of drugs in the form of free drugs as well as nanoparticles. The IC 50 values were determined. The cell viabilities for predetermined time duration were found by MTT assay method reported by Mossmann (1983). In brief, A549 cells were cultured in Dulbecco's modified Eagle's medium containing 10 % FBS at 37°C with 5 % CO2 in humidified air. Then cultures in the exponential growth phase were trypsinized and diluted in medium to give a total cell count of 5 × 10⁴ cells/mL. The cell suspension was then transferred to 96-well plate to ensure 5,000 cells/well and allowed to attach overnight. The medium was changed with 100-μl medium containing ET, QD, ETN, and QDN of different concentrations (0.5, 5, 10, and 50 μM). The combinations of plain drugs, etoposide and quercetin dihydrate (EQ) and of their NP forms (EQN) were studied by using fixed concentration of QD (10 μM) and ET concentration being varied at range mentioned above. The free drugs ET and QD were dissolved in dimethyl sulfoxide (DMSO), diluted with complete media. (The concentration of DMSO was different in the final serial diluted media but was less than 1 %). Each formulation dilution was assessed in triplicate. Three wells containing only cells suspended in complete medium were used as controls for cell viability. After incubation for 24, 48, and 72 h, suspension was removed and the wells were washed with PBS. 10 μl of MTT (5 mg/ml) and 90 μl of medium were added and incubated for around 3–4 h. Then the media containing MTT was removed, leaving the precipitate. DMSO (100 μl) was added to the wells. Plate was observed at 570 nm using microplate reader. The results for IC 50 are presented in Fig. 10 while that of cell viability studies are presented in Figs. 11, 12, and 13.
Fig. 10.
Comparison of IC 50 values (micromolars) for various treatments
Fig. 11.
Percent A549 cell viabilities after 24 h for various treatments
Fig. 12.
Percent A549 cell viabilities after 48 h for various treatments
Fig. 13.
Percent A549 cell viabilities after 72 h for various treatments
Results and discussion
Preparation of nanoparticles
Etoposide and quercetin dihydrate loaded PLGA nanoparticles (ETN and QDN) were prepared successfully by nanoprecipitation method. In this study, the effect of five preparation variables on the mean diameter and entrapment efficiencies of ETN and QDN was investigated as shown in Fig. 3 and discussed below.
Effect of PLGA concentration
The mean diameter of all formulations increased as the amount of PLGA is increased from 50 to 200 mg (Fig. 3a). This can be attributed to increase in viscosity of organic phase with increase in the PLGA amount and thus leads to slower diffusion rate of PLGA solution in aqueous phase and formation of larger-size droplets which is also related to increased drug entrapment efficiencies (EEs). Another mechanism that can contribute in this effect is insufficient surfactant to cover the surface of larger droplets and also coalescence of droplets during the removal of organic phase and subsequent aggregation of NPs.
The EE of ET increased significantly (p < 0.05) with the increase of PLGA concentration while the EE of QD though shows same trend but is less as compared to ET. This confirms that large NPs are associated with higher drug EEs.
Aqueous phase volume
Figure 3b shows that size of NPs decreases, as the aqueous phase volume (containing Poloxamer-407) increased. This happens because the amount of surfactant increases correspondingly, resulting in reduction of interfacial tension.
The mean EEs of these two drugs decreased substantially with the increase in aqueous phase volume. This must be due to the amount of drugs partitioned into the organic phase reduced during mixing of aqueous and organic phases. The drug loss still increased during solvent evaporation as the W/O volume ratio increased. This effect is more pronounced in case of QD. When W/O volume ratio increased, the amount of QD dissolved in the aqueous phase increases, resulting in less QD retention in the organic phase to interact with PLGA molecules and then lower EE of QD. This phenomenon is responsible for the lower EEs of QD as compared to ET.
Surfactant concentration
Figure 3c predicts that the mean diameter decreased with increasing surfactant concentration. At higher concentration, more molecules of surfactant can align themselves at interface to reduce the interfacial tension efficiently, which resulted in significant increase in shear stress at constant external energy input promoting the formation of smaller particles (Galindo-Rodriguez et al. 2004). However, with the increase in surfactant concentration, the viscosity of aqueous phase increases, which would result in size increase due to decrease in net shear stress. In case of ET, the size of NP decreased with increase in concentration of surfactant probably due to dominance of former phenomenon. But in case of QDN, when surfactant concentration was increased above 0.5 % w/v, the size increased as depicted in Fig. 3c. This may be due to dominance of the later phenomenon over the former above this concentration of surfactant. Thus, the decrease in EE of ET with the increase in surfactant concentration is obviously due to decrease in particle size.
The trend exhibited by QD (Fig. 3c) can be explained by the behavior of QD in different surfactant concentration. It was observed that, at lower concentration, the QD comes out of both phases and precipitate as the evaporation of organic solvent progresses, resulting in very low EE (12.73 ± 3.2 %) but the increase in surfactant concentration upto 0.5 % w/v maintains the QD in a state to interact with PLGA sufficiently, thus increasing the EE to 37.77 ± 4.2 %. But if the surfactant concentration is increased beyond this level, the EE decreases because the high concentration of surfactant can increase the solubility of QD in aqueous solution.
Therefore, less QD molecules remained in the organic phase to interact with PLGA molecules when both phases were mixed.
Theoretical drug loading
Significant differences were observed in the size of the ETN and QDN upon varying this parameter. Increased drug loading resulted in a more viscous organic phase, thus an increase in the size of NPs was observed. In the present investigation, the low amounts of drug loading were found optimum. When theoretical drug loading was increased from 2.5 to 7.5 %, the EE was greatly affected (Fig. 3d). Addition of excessive quantities of drugs during the nanoprecipitation process causes more drug loss due to limited drug entrapment capacity of the polymer, hence EEs decreased accordingly.
Organic phase volume
The increase in the organic phase volume from 4 to 10 ml leads to decrease in particle size and subsequent decrease in EE. Particle size reduction was observed due to decrease in the viscosity of system associated with more organic phase volume, leading to formation of smaller particles. Decrease in the EEs is caused due to increase in the cosolvency effect of organic solvent for the drugs, thus enhancing the aqueous phase concentrations of drugs, while lower drug concentration available for interaction with PLGA.
Characterization of ETN and QDN
Particle size, particle size distribution, and zeta potential measurement
The optimized ETN and QDN formulations exhibited mean diameters 153.4 ± 4.2 and 148.6 ± 1.6 nm respectively. The size distribution curves for ETN and QDN were represented in Figs. 1 and 2, respectively. Both these curves reveal a narrow size distribution and monodisperse unimodal systems which is also reflected by the PDI, i.e., 0.058 ± 0.02 for ETN and 0.088 ± 0.03 for QDN. As the particle sizes are falling in 100–200-nm range, passive targeting of drugs to tumor is expected.
The zeta potential is an important parameter when considering the stability of the nanoparticles in vitro. The more negative or positive values of zeta potential are related to more stable particles, more repulsion between particles reduce the particle aggregation.
The zeta potential of drug-free nanoparticles (PN) was on higher negative side (−30.2 ± 0.6 mV) whereas the incorporation of ET and QD resulted in slight decrease in zeta potentials. The zeta potential values of ETN and QDN were −26.4 ± 1.9 and −27.0 ± 0.7 mV, respectively. The negative zeta potentials are beneficial in drug delivery and prolonging the circulation time property.
Drug entrapment efficiencies
The drug EEs for optimized ETN and QDN formulations were 63.88 ± 1.5 and 41.36 ± 3.4 %, respectively. At all levels of study, the drug EE of QD is not improved much as compared to ET, though both drugs are hydrophobic in nature. The ease with which QD precipitates in unfavorable conditions is responsible for low values of EE. Thus, only hydrophobicity of the drug is not the sole deciding factor but level of interaction with polymer PLGA must be given due attention.
Transmission electron microscopy
TEM indicated uniform and spherical shape, discrete particles without aggregation and appear to be smooth in surface morphology with nano-size range. The TEM micrographs (Figs. 4 and 5) show the diameters 133.65 nm for ETN and 113.14 nm for QDN. These diameters were not in accordance with that determined with PCS. This was mostly because of the difference in the mechanisms of the two methods. The TEM is based on diffraction technique and the PCS measures radius of hydrated particles based on scattering. Thus PCS usually measures larger than their genuine diameters whereas sizes derived from TEM might be considerably smaller than their real diameters (Song et al. 2008).
Differential scanning calorimetry
DSC thermograms of free ET and QD as well as ETN and QDN formulation were obtained to define the physical state of the drugs in NPs. Figure 6 shows thermograms for ET and ETN. DSC of ET has revealed evidence of thermal events in the range of 190–210°C, and at 268°C prior to decomposition at about 290°C. The exotherm at 206°C suggested the conversion to a different crystalline form. Further heating to 350°C revealed endotherm at 268°C which was attributed to the melting point of the newly formed etoposide (Jasti et al. 1995). But ETN had not shown such exothermic and endothermic peaks, indicating that ET formulated in NPs existed as an amorphous state or a solid solution.
Figure 7 shows thermograms for QD and QDN. DSC of QD revealed endotherms at 117.31 and 322.32°C corresponding to a dehydration reaction and the melting process, respectively. Both these endothermic peaks are completely disappeared in the thermogram for QDN. These results suggested that the drug was dispersed throughout the polymer forming a high-energy amorphous state. Figure 8 shows the thermograms for P, PN, ET, ETN, QD, and QDN. These curves clearly support the entrapment of the drugs in the polymer.
In vitro drug release from ETN and QDN
Figure 9 depicts the release profiles of ET and QD from PLGA NPs (i.e., ETN and QDN). In comparison with the plain drug solutions (ET and QD), there was a profound time prolongation of drugs release from NPs. Nearly 100 % of drugs were released from plain drug solutions approximately in 6 h. But only about 40 % of drugs released from NPs after 24 h (96.98 ± 2.3 and 87.08 ± 1.9 % for ET and QD, respectively, from free drug solutions at 6 h, 46.69 ± 2.7 and 38.65 ± 2.0 % for ET and QD from nanoparticles at 24 h). The reason behind this prolongation of release time is attributed to slow degradation of PLGA, therefore the release of ET and QD from nanoparticles depends on drug diffusion from PLGA surface and matrix as well as bulk erosion or swelling of polymer (Mu and Feng 2003).
Moreover, drug release pattern from nanoparticles showed burst-release of drugs during the first 2 h of study, followed by a lag phase of relatively slow release, which is also reported earlier (Mainardes and Evangelista 2005; Gõmez-Gaete et al. 2007). The high initial burst can be attributed to the immediate dissolution and release of drugs adsorbed on the surface and diffusion of drugs located near the surface of the nanoparticles.
According to the release curves, it may be concluded that QD released slower than ET in both free-drug solutions and their respective nanoparticles. This may be caused due to poor aqueous solubility of QD in comparison to ET in pH 7.4 phosphate buffer. The cumulative release percentage of QD was found to be lower than that of ET at any time point from their respective nanoparticles.
The kinetic analysis of drug release was performed by subjecting the data to dissolution study models as represented by Table 1. The result of kinetic analysis reveals that the release of ET and QD from free drug solutions followed the first order kinetics and from ETN and QDN followed Higuchi model. This indicates the drug release from matrix type of systems.
Table 1.
Correlation co-efficient for different dissolution models
| Formulations | Correlation co-efficient (R 2) | |||
|---|---|---|---|---|
| Zero-order kinetics | First order kinetics | Higuchi model | Hixon-Crowel cube root law | |
| ET | 0.633 | 0.966 | 0.861 | 0.875 |
| QD | 0.743 | 0.910 | 0.911 | 0.858 |
| ETN | 0.808 | 0.856 | 0.959 | 0.840 |
| QDN | 0.873 | 0.918 | 0.984 | 0.904 |
The mechanism of drug release from the nanoparticles was determined using the Korsmeyer–Peppas model (Korsmeyer et al. 1983; Peppas 1985 and Peppas and Sahlin 1989; Costa and Lobo 2001). The data obtained from the drug release from nanoparticles were analyzed according to following equation of Korsmeyer–Peppas model.
 |
Where (Mt/M˳) is fraction of drug released, k is release constant, and n is release exponent.
The results for this analysis are given in Table 2. The value of the release exponent “n” indicates the release mechanism (Fickian diffusion, case II transport, or anomalous transport). In the present study, the limits considered were n = 0.45 (indicates a classical Fickian diffusion-controlled drug release) and n = 0.89 (indicates a case II relaxation release transport; non-Fickian, zero-order release). Values of n between 0.45 and 0.89 can be regarded as an indicator of both phenomena (drug diffusion in the hydrated matrix and the polymer relaxation) commonly called anomalous transport. From the release exponent values in the Korsmeyer–Peppas model for the release of ET and QD from their respective NPs, it could be concluded that the mechanism that led to the release of drugs was an anomalous transport.
Table 2.
Dissolution parameters for drug release from nanoparicles for Korsmeyer–Peppas kinetics
| Formulation | Correlation co-efficient (R 2) | Release exponent (n) | Release constant (k) |
|---|---|---|---|
| ETN | 0.974 | 0.571 | 7.194 |
| QDN | 0.911 | 0.714 | 4.187 |
Cytotoxicity study by MTT assay
IC 50 values at 72-h incubation for ETN and QDN were found significantly lower comparable to the reference drugs ET and QD, respectively (Fig. 10). The comparison of the IC 50 values for various treatments also shows that combination treatment (EQ) showed higher activity when compared with individual drug treatments. The increased cytotoxicity of etoposide by adding 50 μM Quercetin on human Ewing's tumor cells is reported by Debes et al. (2003). The combination in the form of nanoparticles (EQN) exhibited even higher activity than the plain drug combination (EQ).
There was an increase in cytotoxicity in case of ETN and QDN at all time points (Figs. 11, 12, and 13) in comparison to free drug but the effect was non-significant at 24 h (p > 0.05). In the same case, significant (p < 0.01) differences in cytotoxicities were found at 48 and 72 h. The combination treatment EQ exhibited significantly lower cell viabilities (p < 0.05) as compared to individual drug treatment. The EQN treatment was found to produce significant improvement in cytotoxicity effect (p < 0.05) compared with the free drug combination (EQ) except for the results at 24 h where the difference is insignificant. When the comparison is made between the cytotoxic effect of ET with the EQN, extremely significant (p < 0.001) enhancement in cytotoxic effect due to EQN is observed at 48 h and highly significant (p < 0.01) enhancement is observed at 24 and 72 h.
The greater antiproliferative activity of combination therapy (EQ) may be attributed to additive effect of single drug treatments. The significance of the difference in cytotoxicity effect of free drugs and nanoparticulate formulation was established at 72 h and not at 24 h. This may be due to the sustained release of drugs from the nanoparticles which can be well correlated with the results of in vitro release studies in previous section. The combination treatment EQN is found to produce far better results as compared to single chemotherapeutic drug treatment i.e. ET alone.
Conclusion
The study demonstrates that the nanoprecipitation (solvent diffusion) technique followed by lyophilization is a viable technique to obtain PLGA NPs with mean particle size of about 150 nm and good entrapment efficiencies (63.88 ± 1.5 for ETN and 41.36 ± 1.93 for QDN). The particle size and %EE was influenced by formulation variables, which needs to be optimized. The results of in vitro studies reveal that encapsulating the drugs in the form of PLGA nanoparticles led to the sustained release of the drugs as compared to faster release of free form of drugs. The conclusion can be drawn from the in vitro cytotoxicity studies performed using MTT assay that combination treatment in the form of PLGA NPs was found far better than any individual drug treatment. The incorporation of drugs separately in PLGA NPs allows one to modulate the dose of both drugs as per the requirement of patient. As the quercetin exhibits several supporting mechanisms in improving the efficacy of antineoplastic drugs, there can also be a need to sequence the administration of both agents or combination regimen may be delivered simultaneously. In any respect, the formulations obtained in this study can be very well utilized for extracting maximum benefit for patients. Thus the results of our investigations clearly hold promise for the evaluation of combination treatment in the form of PLGA nanoparticles in vivo.
Acknowledgments
The financial support provided under the Quality Improvement Programme, run by All India Council for Technical Education (AICTE) India, is gratefully acknowledged. The authors also thank Cadilla Pharma, Ahmedabad, India and Sun Pharma Advanced Research Company Ltd. (SPARC), Vadodara, India for providing free gift sample of ET and Poloxamer-407.
References
- Boik J. Natural compounds in cancer therapy. Princeton Minnesota: Oregon Medical Press; 2001. pp. 91–98. [Google Scholar]
- Cierniak A, Kapiszewska M. The effect of quercetin on DNA damage induced by etoposide. Polish J Environ Stud. 2002;11:111–115. [Google Scholar]
- Cierniak A, Papiez M, Kapiszewska M. Modulatory effect of quercetin on DNA damage, induced by etoposide in bone marrow cells and on changes in the activity of antioxidant enzymes in rats. Proceedings Annales Academiae Medicae Bialostocensis. 2004;49(1):167–169. [PubMed] [Google Scholar]
- Corvazier E, Maclouf J. Interference of some flavonoids and nonsteroidal anti-inflammatory drugs with oxidative metabolism of arachidonic acid by human platelets and neutrophils. Biochem Biophys Acta. 1985;835:315–321. doi: 10.1016/0005-2760(85)90287-5. [DOI] [PubMed] [Google Scholar]
- Costa P, Lobo JMS. Modeling and comparison of dissolution profiles. Eur J Pharm Sci. 2001;13:123–133. doi: 10.1016/S0928-0987(01)00095-1. [DOI] [PubMed] [Google Scholar]
- Debes A, Oerding M, Willers R, Göbel U, Wessalowski R. Sensitization of human Ewing's tumor cells to chemotherapy and heat treatment by the bioflavonoid quercetin. Anticancer Res. 2003;23(4):3359–3366. [PubMed] [Google Scholar]
- Desai MP, Labhasetwar V, Amidon GL, Levy RJ. Gastrointestinal uptake of biodegradable microparticles: effect of particle size. Pharm Res. 1996;12:1838–1845. doi: 10.1023/A:1016085108889. [DOI] [PubMed] [Google Scholar]
- Ferrara N, Hillan KJ, Gerber HP, Novotny W. Discovery and development of bevacizumab, an anti-VEGF antibody for treating cancer. Nat Rev Drug Discov. 2004;3:391–400. doi: 10.1038/nrd1381. [DOI] [PubMed] [Google Scholar]
- Folkman J. Tumour angiogenesis: therapeutic implications. N Engl J Med. 1971;285:1182–1186. doi: 10.1056/NEJM197108122850711. [DOI] [PubMed] [Google Scholar]
- Fonseca C, Simões S, Gaspara R. Paclitaxel-loaded PLGA nanoparticles: preparation, physicochemical characterization and in vitro anti-tumoral activity. J Control Release. 2002;83:273–286. doi: 10.1016/S0168-3659(02)00212-2. [DOI] [PubMed] [Google Scholar]
- Furness MS, Robinson TP, Ehlers T, Hubbard RB, Arbiser JL, Goldsmith DJ, Bowen JP. Antiangiogenic agents: studies on fumagillin and curcumin analogs. Curr Pharm Des. 2005;11:357–373. doi: 10.2174/1381612053382142. [DOI] [PubMed] [Google Scholar]
- Galindo-Rodriguez S, Allemann E, Fessi H, Doelker E. Physicochemical parameters associated with nanoparticle formation in the salting-out, emulsification–diffusion and nanoprecipitation methods. Pharm Res. 2004;21:1428–1439. doi: 10.1023/B:PHAM.0000036917.75634.be. [DOI] [PubMed] [Google Scholar]
- Gasparini G, Longo R, Fanelli M, Teicher BA. Combination of antiangiogenic therapy with other anticancer therapies: results, challenges, and open questions. J Clin Oncol. 2005;23(6):1295–1311. doi: 10.1200/JCO.2005.10.022. [DOI] [PubMed] [Google Scholar]
- Gõmez-Gaete C, Tsapis N, Besnard M, Bochot A, Fattal E. Encapsulation of dexamethasone into biodegradable polymeric nanoparticles. Int J Pharm. 2007;331:153–159. doi: 10.1016/j.ijpharm.2006.11.028. [DOI] [PubMed] [Google Scholar]
- Hande KR. Etoposide: four decades of development of a topoisomerase II inhibitor. Eur J Cancer. 1998;34:1514–1521. doi: 10.1016/S0959-8049(98)00228-7. [DOI] [PubMed] [Google Scholar]
- Hande KR. Topoisomerase II inhibitors. Updat Cancer Ther. 2008;3:13–26. doi: 10.1016/j.uct.2008.02.001. [DOI] [Google Scholar]
- Havesteen B. Flavonoids, a class of natural products of high pharmacological potency. Biochem Pharmacol. 1983;32:1141–1148. doi: 10.1016/0006-2952(83)90262-9. [DOI] [PubMed] [Google Scholar]
- Hoffman R, Graham L, Newlands ES. Enhanced anti-proliferative action of busulphan by quercetin on the human leukaemia cell line K562. Br J Cancer. 1989;59:347–348. doi: 10.1038/bjc.1989.68. [DOI] [PMC free article] [PubMed] [Google Scholar]
- Hofmann J, Doppler W, Jakob A. Enhancement of the antiproliferative effect of cis-diamminedichloroplatinum(II) and nitrogen mustard by inhibitors of protein kinase C. Int J Cancer. 1988;42:382–388. doi: 10.1002/ijc.2910420313. [DOI] [PubMed] [Google Scholar]
- Hofmann J, Fiebig HH, Winterhalter BR. Enhancement of the antiproliferative activity of cis-diamminedichloroplatinum(II) by quercetin. Int J Cancer. 1990;45:536–539. doi: 10.1002/ijc.2910450327. [DOI] [PubMed] [Google Scholar]
- Hurwitz H, Fehrenbacher L, Novotny W, et al. Bevacizumab plus irinotecan, fluorouracil, and leucovorin for metastatic colorectal cancer. N Engl J Med. 2004;350:2335–2342. doi: 10.1056/NEJMoa032691. [DOI] [PubMed] [Google Scholar]
- Igura K, Ohta T, Kuroda Y, Kaji K. Resveratrol and quercetin inhibit angiogenesis in vitro. Cancer Lett. 2001;171:11–16. doi: 10.1016/S0304-3835(01)00443-8. [DOI] [PubMed] [Google Scholar]
- Jain RK, Willett CG, Boucher Y, et al. Direct evidence that the VEGF-specific antibody bevacizumab has antivascular effects in human rectal cancer. Nat Med. 2004;10:145–147. doi: 10.1038/nm0404-329b. [DOI] [PMC free article] [PubMed] [Google Scholar]
- Jasti BR, Du J, Vasavada RC. Characterization of thermal behavior of etoposide. Int J Pharm. 1995;118:161–167. doi: 10.1016/0378-5173(94)00325-Y. [DOI] [Google Scholar]
- Kim KJ, Li B, Winer J, Li B, Armanini M, Gillett N, Phillips HS, Ferrara N. Inhibition of vascular endothelial growth factor-induced angiogenesis suppresses tumour growth in vivo. Nature. 1993;362:841–844. doi: 10.1038/362841a0. [DOI] [PubMed] [Google Scholar]
- Kim SH, Yeo GS, Lim YS, Kang CD, Kim CM, Chung BS. Suppression of multidrug resistance via inhibition of heat shock factor by quercetin in MDR cells. Exp Mol Med. 1998;30:87–92. doi: 10.1038/emm.1998.13. [DOI] [PubMed] [Google Scholar]
- Korsmeyer RW, Gurny R, Doelker EM, Buri P, Peppas NA. Mechanisms of solute release from porous hydrophilic polymers. Int J Pharm. 1983;15:25–35. doi: 10.1016/0378-5173(83)90064-9. [DOI] [PubMed] [Google Scholar]
- Kuhlman MK, Horsch E, Burkhardt G. Reduction of cisplatin toxicity in cultured renal tubular cells by the bioflavonoid quercetin. Arch Toxicol. 1998;72:536–540. doi: 10.1007/s002040050539. [DOI] [PubMed] [Google Scholar]
- Levy J, Teuerstein I, Marbach M, Radian S, Sharoni Y. Tyrosine protein kinase activity in the DMBA-induced rat mammary tumor: inhibition by quercetin. Biochem Biophys Res Commun. 1984;123:1227–1233. doi: 10.1016/S0006-291X(84)80264-8. [DOI] [PubMed] [Google Scholar]
- Ma ZS, Huynh TH, Ng CP, et al. Reduction of CWR22 prostate tumor xenograft growth by combined tamoxifen-quercetin treatment is associated with inhibition of angiogenesis and cellular proliferation. Int J Oncol. 2004;24:1297–1304. [PubMed] [Google Scholar]
- Mainardes RM, Evangelista RC. PLGA nanoparticles containing praziquantel: effect of formulation variables on size distribution. Int J Pharm. 2005;290:137–144. doi: 10.1016/j.ijpharm.2004.11.027. [DOI] [PubMed] [Google Scholar]
- Mohanraj VJ, Chen Y. Nanoparticles: a review. Trop J Pharm Res. 2006;5(1):561–573. [Google Scholar]
- Mossmann T. Rapid colorimetric assay for cellular growth and survival: application to proliferation and cytotoxicity assays. J Immunol Methods. 1983;65:55–63. doi: 10.1016/0022-1759(83)90303-4. [DOI] [PubMed] [Google Scholar]
- Mu L, Feng SS. PLGA/TPGS nanoparticles for controlled release of paclitaxel: effect of emulsifier and drug loading ratio. Pharm Res. 2003;20(11):1864–1872. doi: 10.1023/B:PHAM.0000003387.15428.42. [DOI] [PubMed] [Google Scholar]
- Painter FM. Quercetin monograph. Altern Med Rev. 1998;3(2):140–143. [PubMed] [Google Scholar]
- Peppas NA. Analysis of Fickian and non-Fickian drug release from polymers. Pharm Acta Helv. 1985;60:110–111. [PubMed] [Google Scholar]
- Peppas NA, Sahlin JJ. A simple equation for the description of solute release. III. Coupling of diffusion and relaxation. Int J Pharm. 1989;57:169–172. doi: 10.1016/0378-5173(89)90306-2. [DOI] [Google Scholar]
- Ramos S. Review cancer chemoprevention and chemotherapy: dietary polyphenols and signalling pathways. Mol Nutr Food Res. 2008;52:507–526. doi: 10.1002/mnfr.200700326. [DOI] [PubMed] [Google Scholar]
- Sandler A, Gray R, Perry MC, Brahmer J, Schiller JH, Dowlati A, Lilenbaum R, Johnson DH. Paclitaxel-carboplatin alone or with bevacizumab for non-small-cell-lung cancer. N Engl J Med. 2006;355:2542–2550. doi: 10.1056/NEJMoa061884. [DOI] [PubMed] [Google Scholar]
- Scambia G, Ranelletti FO, Panici PB. Inhibitory effect of quercetin on primary ovarian and endometrial cancers and synergistic activity with cis-diamminedichloroplatinum(II) Gynecol Oncol. 1992;45:13–19. doi: 10.1016/0090-8258(92)90484-Z. [DOI] [PubMed] [Google Scholar]
- Scambia G, Ranelletti FO, Panici PB, Piantelli M, Vincenzo R, Ferrandina G, Bonanno G, Capelli A, Mancuso S. Quercetin induces type-II estrogen-binding sites in estrogen- receptor-negative (MDA-MB231) and estrogen-receptor-positive (MCF-7) human breast cancer cell lines. Int J Cancer. 1993;54:462–466. doi: 10.1002/ijc.2910540318. [DOI] [PubMed] [Google Scholar]
- Scambia G, Ranelletti FO, Panici PB. Quercetin potentiates the effect of adriamycin in a multidrug-resistant MCF-7 human breastcancer cell line: P-glycoprotein as a possible target. Cancer Chemother Pharmacol. 1994;34:459–464. doi: 10.1007/BF00685655. [DOI] [PubMed] [Google Scholar]
- Sliutz G, Karlseder J, Tempfer C, Orel L, Holzer G, Simon MM. Drug resistance against gemcitabine and topotecan mediated by constitutive hsp70 overexpression in vitro: implication of quercetin as sensitiser in chemotherapy. Br J Cancer. 1996;74:172–177. doi: 10.1038/bjc.1996.334. [DOI] [PMC free article] [PubMed] [Google Scholar]
- Song X, Zhao Y, Hou S, Xu F, Zhao R, He J, Cai Z, Li Y, Chen Q. Dual agents loaded PLGA nanoparticles: systematic study of particle size and drug entrapment efficiency. Eur J Phar Biopharm. 2008;69:445–453. doi: 10.1016/j.ejpb.2008.01.013. [DOI] [PubMed] [Google Scholar]
- Spoerke D (2003) In: Rouse J (ed) AltMedDex® System. MicroMedex Inc., Englewood, Colorado
- Stolnik S, Illum L, Davis S. Long circulating microparticulate drug carriers. Adv Drug Deliv Rev. 1995;16:195–214. doi: 10.1016/0169-409X(95)00025-3. [DOI] [Google Scholar]
- Tabata Y, Ikada Y. Phagocytosis of polymer microspheres by macrophages. Adv Polym Sci. 1990;94:107–141. doi: 10.1007/BFb0043062. [DOI] [Google Scholar]
- Tan WF, Lin LP, Li MH, et al. Quercetin, a dietary-derived flavonoid, possesses antiangiogenic potential. Eur J Pharmacol. 2003;459:255–262. doi: 10.1016/S0014-2999(02)02848-0. [DOI] [PubMed] [Google Scholar]
- Xiao D, Zhu SP, Gu ZL. Quercetin induced apoptosis in human leukemia HL-60 cell. Acta Pharmacol Sin. 1998;18:280–283. [PubMed] [Google Scholar]
- Yance DR, Sagar MS. Targeting angiogenesis with integrative cancer therapies. Integr Cancer Ther. 2006;5(1):9–29. doi: 10.1177/1534735405285562. [DOI] [PubMed] [Google Scholar]
- Yoshida M, Sakai T, Hosokawa N, Marui N, Matsumoto K, Fujioka A, Nishino H, Aoike A. The effect of quercetin of cell cycle progression and growth of human gastric cancer cells. FEBS Lett. 1990;260:10–13. doi: 10.1016/0014-5793(90)80053-L. [DOI] [PubMed] [Google Scholar]


