

Abstract
Background
Corpus callosum (CC) size and shape have been previously studied in Alzheimer’s disease (AD) with the majority of studies having been cross-sectional. Due to the large variance in normal CC morphology, cross-sectional studies are limited in statistical power. Determining individual rates of change requires longitudinal data. Physiological changes are particularly relevant in mild cognitive impairment (MCI), in which CC morphology has not been previously studied longitudinally.
Objective
To study temporal rates of change in CC morphology in MCI patients over a one-year period, and to determine whether these rates differ between MCI subjects who converted to AD (MCI-C) and those who did not (MCI-NC) over an average (±SD) observation period of 5.4 (±1.6) years.
Methods
We used a novel multi-atlas based algorithm to segment the mid-sagittal cross-sectional area of the CC in longitudinal MRI scans. Rates of change of CC circularity, total area, and five sub-areas were compared between 57 MCI-NC and 81 MCI-C subjects.
Results
The CC became less circular (−0.89% per year in MCI-NC, −1.85% per year in MCI-C) with time, with faster decline in MCI-C (p=0.0002). In females, atrophy rates were higher in MCI-C relative to MCI-NC in total CC area (p=0.0006), genu/rostrum (p=0.005), and splenium (0.002). In males, these rates did not differ between groups.
Conclusion
A greater than normal decline in CC circularity was shown to be an indicator of prodromal AD in MCI subjects. This measure is potentially useful as an imaging biomarker of disease and a therapeutic target in clinical trials.
Keywords: Alzheimer’s disease, mild cognitive impairment, brain, circularity, corpus callosum, magnetic resonance imaging, shape analysis
INTRODUCTION
The corpus callosum (CC)1 is the largest white matter tract in the brain consisting of over 200 million fibers interconnecting the cerebral hemispheres [1]. The CC is the brain’s main conduit for interhemispheric transfer and integration of information [2, 3]. Most callosal connections are homotopic, that is, they connect the equivalent cortical regions bilaterally [4]. The CC fibers are also arranged topographically, for example, callosal fibers from the frontal lobe course through the anterior CC (rostrum and genu) and those from the caudal regions of the cortex (e.g., occipital regions) go through the posterior CC (splenium) [5, 6]. Atrophy of the CC has been observed in several major disorders including Alzheimer’s disease (AD) [7–13], schizophrenia [14–16], multiple sclerosis [17–19], and alcoholism [20–23]. CC atrophy has been proposed to be a consequence of two possible mechanisms: direct myelin breakdown [24, 25], and Wallerian degeneration wherein callosal fibers are lost as a result of distal loss of the callosal projecting neurons [26]. The latter mechanism suggests that regional CC atrophy may be a surrogate biomarker of cortical neuronal loss. Callosal projecting neurons are predominantly large pyramidal neurons in cortical layers II/III and V–VI, with axons projecting contra-laterally and converging on the mid-sagittal plane (MSP), forming the most compact part of the CC. The MSP cross-sectional area of the CC is well visualized in structural magnetic resonance imaging (MRI) scans (Fig. 1a) and has been shown to be highly correlated with CC volume, which is less easily measured because the lateral extents of the CC are not well-defined. Thus, the majority of CC studies in various conditions [7, 8, 14, 17, 20, 26] and nearly all proposed CC segmentation methods [27–31] target its mid-sagittal cross-sectional region.
Figure 1.
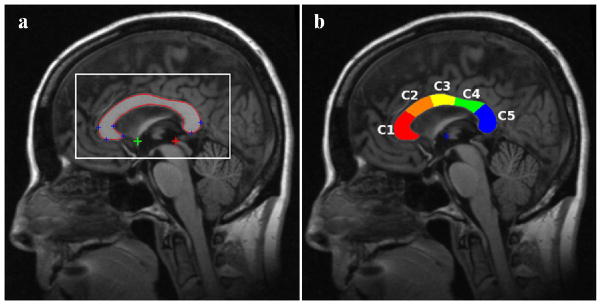
(a) Automatically detected MSP, AC (green plus sign), PC (red plus sign), and several CC landmarks (blue plus signs) on the MSP. The rectangular box shows a window around the CC that is defined based on prior information from atlases about CC location on standardized MSP images. Correlations between the gray level in this window and the test image are used for atlas selection prior to non-linear registrations. (b) CC sub-regions measured automatically by yuki based on Hampel’s definition (CC1: genu, CC2: anterior body, CC3: mid-body, CC4: posterior body and CC5: splenium).
Nearly all morphological studies of the CC in AD have been cross-sectional [7, 9–11, 26, 32–39]. Most studies show reduction in the total CC area (CCA) in AD relative to healthy controls (HC). Studies that examined regional differences most often reported atrophy of the anterior (genu/rostrum) and/or posterior (splenium) sections in AD. However, reports are inconsistent. Findings range from atrophy in all but anterior portion [38], posterior only [10, 37], anterior body only [36], both anterior and posterior regions [9, 11, 26, 32], anterior only [35], no regional but an overall reduction [33], and atrophy in all regions (anterior, posterior and body) [34]. The considerable heterogeneity in the reported results may be due to several factors. (1) The CC size and shape are highly variable and may depend on factors such as sex [40], handedness [41], age [42], brain size [7], and even childhood musical training [43]. This natural variance in CC could cause both Type I and II errors in statistical analyses. (2) The sample sizes have generally been small, often in teens and twenties in AD groups [9–11, 33, 35–37]. (3) There have been major methodological differences, e.g., how the MSP is identified, how the CC is segmented on the MSP, and how the CC sub-regions are defined. (4) Patient populations have been diverse ranging from subjective memory complaints, to mild cognitive impairment, to mild, moderate, and advanced AD. (5) Normal aging may also involve callosal atrophy [8]. Clearly, there are a number of factors that can reduce the sensitivity of measures of CC morphology in cross-sectional studies.
Longitudinal studies are much more sensitive than cross-sectional studies in detecting CC atrophy where each subject is their own control and therefore matched for disease-independent personal characteristics that could affect the CC. In addition, longitudinal studies allow estimation of the rates of CC atrophy. Despite these obvious advantages it appears that only three longitudinal studies of CC morphology in AD exist [8, 12, 39], with somewhat inconsistent findings.
In a previous two-year longitudinal study [8] using the OASIS brain database [44], we compared the rates of change of CC size and shape between HC and patients with very mild/mild AD and showed that: (1) there was CC atrophy with age in both HC and AD in the genu and splenium of the CC; (2) the rates of atrophy, however, were significantly faster in AD patients relative to controls; and (3) change in the circularity of CC, a measure of its shape, most reliably separated the HC and AD groups. In the present paper, we report a one-year longitudinal study of CC size and shape changes in patients with mild cognitive impairment (MCI) using structural MRI scans obtained from the Alzheimer’s Disease Neuroimaging Initiative (ADNI) brain database [45–48]. While some MCI patients convert to AD at various later times, (MCI-converters or MCI-C), others remain stable or may regain normal cognitive functions (MCI-non-converters or MCI-NC). Several studies have been conducted to determine predictors in MCI patients who will progress to AD [49–59], suggesting MCI as a clinical stage in which meaningful interventions might take place. We hypothesized that the differences reported in [8] between normal aging and AD would also be present when comparing the MCI-C and MCI-NC subjects. Change in shape and/or size of the CC may be used as an outcome measure in clinical trials that aim to slow neuronal degeneration due to AD neuropathology. Finally, if these effects can be shown to be present in this one-year longitudinal period, as opposed to a longer study period [8], then the use of CC morphology as a disease biomarker in clinical trials would become a more practical proposition.
METHODS
Subjects
Data used in the preparation of this article were obtained from the ADNI database (adni.loni.usc.edu). The ADNI was launched in 2003 by the National Institute on Aging (NIA), the National Institute of Biomedical Imaging and Bioengineering (NIBIB), the Food and Drug Administration (FDA), private pharmaceutical companies and non-profit organizations, as a $60 million, 5-year public-private partnership. The primary goal of ADNI has been to test whether serial MRI, positron emission tomography (PET), other biological markers, and clinical and neuropsychological assessment can be combined to measure the progression of MCI and early AD. Determination of sensitive and specific markers of very early AD progression is intended to aid researchers and clinicians to develop new treatments and monitor their effectiveness, as well as lessen the time and cost of clinical trials. The Principal Investigator of this initiative is Michael W. Weiner, MD, VA Medical Center and University of California – San Francisco. ADNI is the result of efforts of many co-investigators from a broad range of academic institutions and private corporations, and subjects have been recruited from over 50 sites across the U.S. and Canada. The initial goal of ADNI was to recruit 800 subjects but ADNI has been followed by ADNI-GO and ADNI-2. To date these three protocols have recruited over 1500 adults, ages 55 to 90, to participate in the research, consisting of cognitively normal older individuals, people with early or late MCI, and people with early AD. The follow up duration of each group is specified in the protocols for ADNI-1, ADNI-2 and ADNI-GO. Subjects originally recruited for ADNI-1 and ADNI-GO had the option to be followed in ADNI-2. For up-to-date information, see www.adni-info.org.
As part of our study of CC atrophy, we downloaded the “3-Year Complete standardized data set” [60] from the ADNI database, which includes longitudinal 1.5T structural MRI scans of 148 individuals initially diagnosed as MCI. Summaries of demographic, psychometric and diagnostic data were downloaded in October, 2013. The MCI subjects were divided into two groups, those whose diagnoses indicated a conversion to AD at any time after their initial evaluation (MCI-C) and those who did not convert (MCI-NC). Baseline demographic and psychometric information for these groups appear in Table 2.
Table 2.
Demographic data.
| MCI-NC | MCI-C | p-value | |
|---|---|---|---|
|
| |||
| n (M/F) | 57 (46/11) | 81 (51/30) | 0.025¶ |
| Age±SD (yr) | 74.1±7.4 | 74.1±6.9 | NS |
| Education±SD (yrs) | 15.8±3.0 | 16.0±3.0 | NS |
| CDRSB±SD | 1.25±0.54 | 1.65±0.92 | 0.002§ |
| MMSE±SD | 27.7±1.7 | 26.7±1.8 | 0.001§ |
| †Delay±SD (yr) | 1.00±0.06 | 1.01±0.04 | NS |
NS: Not significant; SD: standard deviation
χ2 test
t-test
Time period between baseline and follow-up scans
MRI imaging
Subject scans were 1.5T, T1-weighted magnetization prepared rapid gradient echo (MP-RAGE) images, using matrix sizes of 192×192×160–170 or 256×256×166–184. The in-plane voxel dimensions were 0.94 to 1.25 mm, while the slice thickness was kept very close to 1.2 mm. Repetition time values were 2300–2400 ms for multicoil phased array head coils and 3000 ms for birdcage or volume head coils. Inversion time was 1000 ms and flip angle was 8 degrees. Phase encodes were in the anterior-to-posterior direction. Detailed information about MRI acquisition and pre-processing procedures is available in Jack et al. [47].
CC segmentation
The CC was segmented using our Automatic Registration Toolbox (ART) software module yuki. This software is freely available online (http://www.nitrc.org/projects/art). Given a 3D T1-weighted structural MRI volume, yuki segments the mid-sagittal cross-sectional area of the CC by performing the following steps. (1) A MSP is automatically determined as the plane that maximizes bilateral symmetry [61]. (2) The coordinates of the anterior and posterior commissures (AC and PC) are automatically located on the MSP [62] (Fig. 1a). (3) From the original MRI volume, a single standardized MSP image of matrix size 512×512 and pixel size 0.5×0.5 mm2 is reconstructed by tri-linear interpolation. The location and orientation of this image is standardized so that the image left-to-right axis corresponds to subject’s anterior-to-posterior axis parallel to the AC-PC line, the image top-to-bottom axis is the subject’s superior-to-inferior axis, and field-of-view center coincides with the mid-point between AC and PC (Fig. 1a). (4) From a set of over 600 atlases available and distributed with the software, a subset of 49 atlases are selected automatically based on correlation between the atlas and the test image inside a rectangular sub-image containing the CC on the standardized MSP reconstructed in step 3 as shown in Fig. 1a. (5) The 49 selected atlases are non-linearly registered to the test volume’s MSP using ART’s non-linear registration approach [63]. The CC labels of the 49 atlases are projected onto the test MSP using the resulting non-linear transformations. The projected labels are averaged to obtain a fuzzy segmentation of the CC on the MSP of the test volume. (6) Finally, the fuzzy label map obtained in step 5 is thresholded using an automatically determined threshold level to yield the final binary CC segmentation (Fig. 1). The threshold level is selected such that the Fisher’s linear discriminant ratio (FLDR) [64] between the intra- and extra-callosal pixels within the support of the fuzzy label set in step 5 is maximized. The entire segmentation process takes about 7 seconds on a 2.4 GHz Dual Quad-Core Linux workstation.
Since baseline-to-follow-up changes in CC shape and size are small during the roughly one year delay period from baseline to follow-up, it is important to have a consistent CC segmentation technique. To this end, it is very important to perform the above segmentation steps on the same MSP on both baseline and follow-up images. In addition, it is important to use the same selected 49 atlases and the same threshold level determined from FLDR analysis. To ensure this, we implemented the following protocol. (a) The baseline and follow-up volumes of each subject were registered using ART’s rigid-body registration software atra, which is an inverse-consistent rigid-body registration method, that is, the exact same linear transformation matrix is obtained regardless of whether the baseline or the follow-up volume is taken as the reference in the registration process. (b) Using the registration matrix obtained in step a, the baseline and follow-up images were averaged to obtain a single image per subject. (c) The CC segmentation software yuki was applied to the average image in step b saving as auxiliary information the linear transformation that defines the standardized MSP, the list of 49 automatically selected atlases, and the value of the FLDR derived threshold. (d) Finally, the CC was segmented using yuki on the baseline and follow-up images independently, while disabling automatic MSP detection, atlases selection, and FLDR analysis. Instead, yuki was instructed to use the auxiliary information saved in step c for both baseline and follow-up segmentations. This way, both the baseline and follow-up scans were treated in exactly the same way in the CC segmentation process. We have shown using analysis of structural MRI volumes taken in two separate scanning sessions from the same set of subjects on the same day that this approach has significantly higher test-retest reliability as compared to the case where the two images are segmented independently (results not presented).
The results of CC segmentation were visually inspected in all 148 cases. Ten subjects were excluded from further analysis because CC segmentations were deemed inaccurate on baseline and/or follow-up scans. Although most of these problems were minor and could be corrected by manual editing, we decided to simply exclude the 10 subjects from further analysis to avoid possible noise and bias that may be introduced by manual intervention. Thus, there remained 138 subjects (Table 2) who had been diagnosed as MCI at the time of their initial ADNI scan with fully automatic segmentations of the CC at baseline and follow-up scans.
CC measurements
Total CC cross-sectional area (CCA) and CC circularity (CIR) were measured from baseline and one-year follow-up scans to obtain their rate of change over time. CIR is a measure of CC shape defined as 4π×CCA/CCP2 where CCP denotes the CC circumference. CIR values range from 0 for a line to 1 for a perfect circle. In our previous study [7] we showed that CIR is more sensitive to disease progression than CCA due to the non-uniform shrinkage of CC which may lead to simultaneous decease in CCA and increase CCP.
The sub-regions of segmented CC were defined automatically using a method proposed by Hampel et al. [65]. In this method, first a horizontal line that is tangent to the inferior points of both the splenium and the rostrum is located. Then two vertical tangent lines are drawn, one tangent to the most anterior point of the genu and one tangent to the most posterior point of the splenium. The mid-point between the intersection points of the two vertical tangents and the lower horizontal tangent is determined and used as the center of a set of radii that divide the CC into five equi-angular (36°) sectors: genu (CC1), anterior body (CC2), mid-body (CC3), posterior body (CC4) and splenium (CC5). These regions are depicted in Fig. 1b.
The percent baseline to follow-up rate of change per year (the annual percent change (APC)) of a quantity, say CIR, was computed as: rCIR=(100/Δt)×(CIRf-CIRb)/CIRb where CIRb and CIRf denote the measured quantity at baseline and follow-up, respectively, and Δt represents time delay in years between the scans.
Statistical analysis
We used t-tests for the demographic differences between the MCI-NC and MCI-C groups in age or education. A χ2 test was applied to test sex difference between the two groups. We assessed these demographic effects on the comparisons between the two groups with respect to all CC measures based on general linear models. The CC measures included rates of atrophy of CCA, CIR and 5 CC sub-regions. To be specific, the CC measures were modeled as a linear function of age, education, sex, group (MCI-NC vs. MCI-C) and the sex-by-group interaction. A significant interaction of sex and group would indicate that the difference in the CC measures depends on sex. In such significant effects, comparisons between the two groups followed for each sex. If the effect of an independent variable were not significant, the model was refitted without the non-significant variable. Statistical significance level was set at 0.05 two-tailed. P-values are reported without adjustment for multiple comparisons.
RESULTS
Of the 138 MCI subjects with both baseline and follow-up CC segmentations 81 (59%) converted to AD with a mean (±SD) baseline-to-conversion time of 2.3 (±1.4) years, while the diagnosis of 57 subjects remained as MCI over the mean (±SD) observation period of 5.4 (±1.6) years.
Statistical analysis of the demographic data given in Table 2 showed that the MCI-NC and MCI-C groups were not statistically different in age or education. However, the male/female ratio was significantly different between groups (p=0.025). The two groups also differed significantly in their mean CDRSB (p=0.002) as well as mean MMSE scores (p=0.001). The mean delay period of roughly one year between baseline and follow-up scans was not statistically different between the MCI-NC and MCI-C groups.
From the total of 41 female MCI subjects, 30 (73%) converted to AD, while 51 of 97 male subjects (53%) converted. The MCI-C to MCI-NC ratio was significantly different between male and female subjects (p=0.025). Thus, the odds of conversion for females were 30/11 and those for males were 51/46 (odd ratio=2.5).
The APCs and their 95% confidence intervals obtained for the measured variables: circularity (rCIR), total CC cross sectional area (rCCA), genu/rostrum (rCC1), anterior body (rCC2), mid-body (rCC3), posterior body (rCC4) and splenium (rCC5) are given in Table 3. In this Table, rates that were significantly different from zero are shown in bold and displayed graphically in Figures 2 and 3. Where a group by sex interaction existed, the mean rates are given for female and male subjects separately in Table 3.
Table 3.
APC (mean ± 95% confidence interval) in MCI-NC and MCI-C groups
| MCI-NC | MCI-C | §p-value | Cohen’s d | |
|---|---|---|---|---|
|
| ||||
| rCIR | −0.89±0.37 a | −1.85±0.31 a | 0.0002 | 0.67 |
| †rCCA (female) | 0.02±0.60 | −1.22±0.36 a | 0.0006 | 0.61 |
| †rCCA (male) | −0.64±0.29 a | −0.75±0.28 a | NS | NS |
| †rCC1 (female) | −0.02±1.20 | −2.03±0.73 a | 0.005 | 0.49 |
| †rCC1 (male) | −0.98±0.59 b | −1.23±0.56 a | NS | NS |
| rCC2 | −0.73±0.63 c | −0.59±0.53 d | NS | NS |
| rCC3 | −0.43±0.62 | 0.09±0.52 | NS | NS |
| rCC4 | −0.02±0.69 | 0.04±0.58 | NS | NS |
| †rCC5 (female) | 0.02±0.96 | −1.75±0.58 a | 0.002 | 0.54 |
| †rCC5 (male) | −0.41±0.47 | −0.82±0.44 e | NS | NS |
NS: not significant
Group by sex interaction
Significance of difference between MCI-NC and MCI-C groups
Measurements in bold are significantly different from zero.
p<0.0001;
p<0.001;
p=0.025;
p=0.031;
p=0.0004
Fig. 2.

rCCA and rCIR in MCI-NC and MCI-C groups. Error bars indicate the 95% confidence interval.
Fig. 3.

rCC1-rCC5 in MCI-C and MCI-NC. Error bars indicate the 95% confidence interval.
Circularity
There were no associations between rCIR and age, education, or sex. The rCIR was significantly different from zero in both MCI-C (t=−11.66, df=136, β±SE=−1.85±0.16, p<0.0001) and MCI-NC (t=−4.73, df=136, β±SE=−0.89±0.19, p<0.0001) groups. In addition, rCIR was significantly different between the MCI-C and MCI-NC groups (t=−3.88, df=136, β±SE=−0.96±0.25, p=0.0002).
Total CC area
There were no associations between rCCA and age or education. However, There was a significant group×sex interaction in rCCA (F=7.68, dfn=1, dfd=134, p=0.006). The rCCA were significantly different from zero in MCI-C females (t=−6.65, df=134, β±SE=−1.22±0.18, p<0.0001), MCI-C males (t=−5.36, df=134, β±SE=−0.75±0.14, p<0.0001), and MCI-NC males (t=−4.35, df=134, β±SE=−0.64±0.15, p<0.0001) (shown in bold in Table 3), but not in MCI-NC females. In addition, the rCCA in females was significantly different between MCI-C and MCI-NC groups (t=−3.51, df=134, β±SE=−1.24±0.35, p=0.0006). However, in males rCCA did not differ between MCI-C and MCI-NC groups.
Genu/rostrum
With respect to the sub-regional measures, there were no associations between rCC1 and age or education. However, there was a significant group×sex interaction in rCC1 (F=4.63, dfn=1, dfd=134, p=0.03). The rCC1 were significantly different from zero in MCI-C females (t=−5.55, df=134, β±SE=−2.03±0.37, p<0.0001), MCI-C males (t=−4.37, df=134, β±SE=−1.23±0.28, p<0.0001), and MCI-NC males (t=−3.29, df=134, β±SE=−0.98±0.30, p=0.001) (shown in bold in Table 3), but not in MCI-NC females. In addition, the rCC1 in females was significantly different between MCI-C and MCI-NC groups (t=−2.84, df=134, β±SE=−2.01±0.71, p=0.005). However, in males rCC1 did not differ between MCI-C and MCI-NC groups.
Anterior body
We found no associations between rCC2 and age, education, sex, or group. However, rCC2 was significantly different from zero in both MCI-C (t=−2.18, df=136, β±SE=−0.59±0.27, p=0.031) and MCI-NC (t=−2.27, df=136, β±SE=−0.73±0.32, p=0.025) groups. Since there was no group difference and variances were equal by Levene’s test for equality of variances, the groups were combined in a follow-up analysis. The entire MCI cohort (n=138) had a rate of CC2 atrophy significantly different from zero (p=0.002).
Mid-body
We found no associations with age, sex, or group in rCC3. However, there was a significant association with education (t=2.44, df=136, β±SE=0.16±0.07, p<0.02) whereby CC3 atrophy rate decreased as the level of education increased. Mean rCC3 was not statistically different from zero in either MCI-C or MCI-NC groups.
Posterior body
We found no associations with age, education, sex, or group in rCC4, which includes the isthmus. Moreover, mean rCC4 did not significantly differ from zero in either MCI-C or MCI-NC groups.
Splenium
Finally, there were no associations with age or education in rCC5. However, there was a significant group×sex interaction in rCC5 (F=4.35, dfn=1, dfd=134, p<0.04). The rCC5 were significantly different from zero in MCI-C females (t=−5.99, df=134, β±SE=−1.75±0.29, p<0.0001) and males (t=−3.66, df=134, β±SE=−0.82±0.22, p=0.0004) (shown in bold in Table 3), but not in MCI-NC females or males. In addition, the rCC4 in females was significantly different between MCI-C and MCI-NC groups (t=−3.14, df=134, β±SE=-−1.78±0.57, p=0.002), while rCC5 did not differ between MCI-C and MCI-NC in males.
DISCUSSION
There have been three previous longitudinal studies comparing CC morphological changes between AD and HC [8, 12, 39]. However, to the best of our knowledge, this is the first longitudinal study in MCI subjects. Furthermore, the average time period between the baseline and follow-up scans in the previous studies were approximately two years, whereas in this study the average baseline-to-follow-up period was approximately one year. Previously, it was not clear whether changes in CC morphology were large enough to be detectable over a one-year period on structural MRI scans, which are commonly acquired at approximately 1 mm3 resolution. The results of this study confirm the feasibility of detecting these changes over a one-year period using a common structural MRI scanning protocol. This finding suggests CC size and shape measures could be used for pre-trial sample enrichment, as outcome measures in clinical trials, or as a biomarker for monitoring disease progression in clinical settings.
In the MCI cohort studied in this paper, four measures differentiated between MCI-C and MCI-NC subjects: rCIR, rCCA, rCC1, and rCC5 (Table 3). The latter three measures (rCCA, rCC1, and rCC5) did so only in the female subjects. Also, the effect size of rCIR (0.67) is larger than the other three measures. Therefore, our results suggest the temporal rate of change of CC circularity, a relatively novel measure of shape [7, 8], to be the most sensitive marker of MCI to AD conversion amongst these measures.
In our previous two-year longitudinal study of HC and very mild/mild AD [8], we also found that the rCIR was the most sensitive measure for separating the two groups. Data from that study showed that rCIR was −0.83% per year in HC and −1.91% per year in AD patients. In the present study, we found rCIR to be −0.89% per year in MCI-NC and −1.85% per year in MCI-C. The rates obtained in the present study are remarkably close to those obtained in our pervious study [8], which was based on the OASIS database [44]. Comparison of these rates suggest that the CC in the MCI-NC group is aging normally while the changes in the CC morphology in the MCI-C group is at the level of very mild/mild AD.
The spatial patterns of CC decline in the current study using the ADNI database (Fig. 3) are also very similar to those obtained in our previous study [8] using the OASIS database. The decline in CC with age mainly occurs in the anterior (CC1 and CC2) and the posterior (CC5) regions. Despite demonstrating comparable spatial patterns, HC/MCI-NC and AD/MCI-C groups are distinguished by the temporal rates of decline that are almost twice as fast in AD/MCI-C and are best captured by the measure of CC circularity. In other words, morphological CC changes in prodromal and very mild/mild AD appear as accelerated aging.
Precision of our data analysis was achieved using an enhanced automated CC segmentation method by ART software module yuki which is freely available online. The methodology is designed particularly for longitudinal studies. Essentially the aim is to keep as many parameters constant as possible in the segmentation process of the baseline and follow-up scans. In particular, we ensured that (1) the same MSP was defined on both baseline and follow-up scans, (2) the same set of atlases was used in the multi-atlas based segmentation, and (3) the same threshold level (derived from FLDR) was applied in the final label fusion step. We have shown in a separate study (results not reported) that the test-retest reliability of this approach is significantly higher than if the scans were segmented manually or if they were segmented automatically but independently (e.g., without ensuring that the same MSP is analyzed). Since we are observing small changes on the order of 1% per year, utilizing a segmentation method such as yuki which is designed specifically for longitudinal image segmentation is imperative.
The results of this study suggest sex effects in MCI to AD conversion. Firstly, in our sample, a significantly higher percentage of female subjects (73%) than male subjects (53%) converted from MCI to AD (p=0.025). In addition, we found group by sex interactions in the APCs of the total CC area (CCA), genu/rostrum (CC1), and splenium (CC5). These rates were significantly different between the female MCI-C and MCI-NC subgroups but not significantly different between the male MCI-C and MCI-NC subgroups. If confirmed in future studies that are specifically designed to address sex differences in CC morphological changes in MCI, the present results suggest that abnormal decline rates in CCA, CC1, and CC5 would be a marker of future conversion to AD particularly in female MCI subjects.
An interesting result of the present study was that the number of years of education was inversely related to the atrophy rate in the mid-body of the CC (CC3). This finding is consistent with studies showing a protective role of education in the clinical trajectory preceding Alzheimer’s dementia [66].
The corpus callosum size and shape in AD has been mostly studied in cross-sectional imaging data. The present study is one of only a few longitudinal studies, with the advantage of having more sensitivity in detecting differences between groups and the ability to measure temporal rates of change of CC shape and size. In addition, this is the first study of CC size and shape in MCI patients. Another advantage of this study is its use of a fully automated and unbiased platform for segmentation of CC. In particular, care was taken to treat the baseline and follow-up volumes in a symmetric way so as not to bias the results towards either. Bias could be introduced for example if in the registration process one image is taken as reference and the other as the floating image that is would be resliced to match the reference, in which case interpolation is only applied to the floating image. The registration method used in this paper, atra, avoids this problem by using an inverse-consistent method of registration whereby both baseline and follow-up scans are resliced to match to an intermediate space representing the halfway point between their positions and orientations. A limitation of this work is that we did not study the predictive accuracy of CC shape or size for MCI-to-AD conversion. In a recent paper [67], we used a logistic regression model with a fused lasso penalty term for classification of very mild/mild AD subjects from controls using the CC thickness profile as the feature vector. Classification accuracy was estimated to be 84% by cross-validation. We plan to study similar multi-variate models in the future using longitudinal data in MCI and possibly including variables such as hippocampus size in predicting MCI-to-AD conversion. Another limitation of this analysis is that we did not study associations between neurocognitive measures such as MMSE or CDRSB and genotype (APOE e4) with CC shape and size. Future work requires such analyses given larger sample sizes.
In conclusion, we have shown that the spatial and temporal patterns of CC morphological change in MCI-NC are similar to HC, while those in MCI-C are similar to very mild/mild AD. We also verified that CC atrophy is quantifiable in a one-year longitudinal observation period, making this a practical imaging biomarker both for use as an outcome measure of group differences in clinical trials. Amongst the measures considered, circularity proved to be the most sensitive marker of group differences between MCI-to-AD convertors and non-convertors regardless of their gender.
Table 1.
Acronym definitions
| AC | Anterior commissure |
| AD | Alzheimer’s disease |
| ADNI | Alzheimer’s Disease Neuroimaging Initiative |
| APC | Annual percent change |
| CC | Corpus callosum |
| CCi | Area of CC sub-regions i (i=1,2,3,4,5) |
| CCA | Total cross-sectional area of the CC |
| CCP | CC circumference |
| CDRSB | Clinical dementia rating sum of boxes |
| CIR | CC circularity: 4π×CCA/CCP2 |
| df | Degrees of freedom |
| dfn | Numerator df |
| dfd | Denominator df |
| FLDR | Fisher’s linear discriminant ratio |
| HC | Healthy controls |
| MCI | Mild cognitive impairment |
| MCI-C | MCI converters |
| MCI-NC | MCI non-converters |
| MMSE | Mini-Mental State Exam |
| MRI | Magnetic resonance imaging |
| MSP | Mid-sagittal plane |
| PC | Posterior commissure |
| rCCA | APC of CCA (% per yr) |
| rCCi | APC of CCi (% per yr) |
| rCIR | APC of CIR (% per yr) |
| SE | Standard error |
Acknowledgments
Data collection and sharing for this project was funded by the Alzheimer’s Disease Neuroimaging Initiative (ADNI) (National Institutes of Health Grant U01 AG024904) and DOD ADNI (Department of Defense award number W81XWH-12-2-0012). ADNI is funded by the National Institute on Aging, the National Institute of Biomedical Imaging and Bioengineering, and through generous contributions from the following: Alzheimer’s Association; Alzheimer’s Drug Discovery Foundation; Araclon Biotech; BioClinica, Inc.; Biogen Idec Inc.; Bristol-Myers Squibb Company; Eisai Inc.; Elan Pharmaceuticals, Inc.; Eli Lilly and Company; EuroImmun; F. Hoffmann-La Roche Ltd and its affiliated company Genentech, Inc.; Fujirebio; GE Healthcare; IXICO Ltd.; Janssen Alzheimer Immunotherapy Research & Development, LLC.; Johnson & Johnson Pharmaceutical Research & Development LLC.; Medpace, Inc.; Merck & Co., Inc.; Meso Scale Diagnostics, LLC.; NeuroRx Research; Neurotrack Technologies; Novartis Pharmaceuticals Corporation; Pfizer Inc.; Piramal Imaging; Servier; Synarc Inc.; and Takeda Pharmaceutical Company. The Canadian Institutes of Health Research is providing funds to support ADNI clinical sites in Canada. Private sector contributions are facilitated by the Foundation for the National Institutes of Health (www.fnih.org). The grantee organization is the Northern California Institute for Research and Education, and the study is coordinated by the Alzheimer’s Disease Cooperative Study at the University of California, San Diego. ADNI data are disseminated by the Laboratory for Neuro Imaging at the University of Southern California. The analytic work at the Nathan Kline Institute was supported, in part, by a grant from the NIDCD R01 DC007658 to J. Sidtis.
Footnotes
All acronyms used in this paper are defined in Table 1.
References
- 1.Aboitiz F, Scheibel AB, Fisher RS, Zaidel E. Fiber composition of the human corpus callosum. Brain Res. 1992;598(1–2):143–53. doi: 10.1016/0006-8993(92)90178-c. [DOI] [PubMed] [Google Scholar]
- 2.Hoptman MJ, Davidson RJ. How and why do the two cerebral hemispheres interact? Psychol Bull. 1994;116(2):195–219. doi: 10.1037/0033-2909.116.2.195. [DOI] [PubMed] [Google Scholar]
- 3.Sidtis JJ, Volpe BT, Holtzman JD, Wilson DH, Gazzaniga MS. Cognitive interaction after staged callosal section: Evidence for transfer of semantic activation. Science. 1981;212(4492):344–6. doi: 10.1126/science.6782673. [DOI] [PubMed] [Google Scholar]
- 4.Innocenti GM. General organization of callosal connections in the cerebral cortex. In: Jones EG & Peters A (Editors), Sensory-Motor Areas and Aspects of Cortical Connectivity. Cerebral Cortex. 1986;5:291–353. [Google Scholar]
- 5.de Lacoste MC, Kirkpatrick JB, Ross ED. Topography of the human corpus callosum. J Neuropathol Exp Neurol. 1985;44(6):578–91. doi: 10.1097/00005072-198511000-00004. [DOI] [PubMed] [Google Scholar]
- 6.Hofer S, Frahm J. Topography of the human corpus callosum revisited--comprehensive fiber tractography using diffusion tensor magnetic resonance imaging. Neuroimage. 2006;32(3):989–94. doi: 10.1016/j.neuroimage.2006.05.044. [DOI] [PubMed] [Google Scholar]
- 7.Ardekani BA, Bachman AH, Figarsky K, Sidtis JJ. Corpus callosum shape changes in early Alzheimer’s disease: an MRI study using the OASIS brain database. Brain Struct Funct. 2014;219(1):343–52. doi: 10.1007/s00429-013-0503-0. [DOI] [PMC free article] [PubMed] [Google Scholar]
- 8.Bachman AH, Lee SH, Sidtis JJ, Ardekani BA. Corpus Callosum Shape and Size Changes in Early Alzheimer’s Disease: A Longitudinal MRI Study Using the OASIS Brain Database. J Alzheimers Dis. 2014;39(1):71–8. doi: 10.3233/JAD-131526. [DOI] [PMC free article] [PubMed] [Google Scholar]
- 9.Di Paola M, Luders E, Di Iulio F, Cherubini A, Passafiume D, Thompson PM, Caltagirone C, Toga AW, Spalletta G. Callosal atrophy in mild cognitive impairment and Alzheimer’s disease: different effects in different stages. Neuroimage. 2010;49(1):141–9. doi: 10.1016/j.neuroimage.2009.07.050. [DOI] [PMC free article] [PubMed] [Google Scholar]
- 10.Frederiksen KS, Garde E, Skimminge A, Ryberg C, Rostrup E, Baaré WF, Siebner HR, Hejl AM, Leffers AM, Waldemar G. Corpus callosum atrophy in patients with mild Alzheimer’s disease. Neurodegener Dis. 2011;8(6):476–82. doi: 10.1159/000327753. [DOI] [PubMed] [Google Scholar]
- 11.Hampel H, Teipel SJ, Alexander GE, Horwitz B, Teichberg D, Schapiro MB, Rapoport SI. Corpus callosum atrophy is a possible indicator of region- and cell type-specific neuronal degeneration in Alzheimer disease: a magnetic resonance imaging analysis. Arch Neurol. 1998;55(2):193–8. doi: 10.1001/archneur.55.2.193. [DOI] [PubMed] [Google Scholar]
- 12.Teipel SJ, Bayer W, Alexander GE, Zebuhr Y, Teichberg D, Kulic L, Schapiro MB, Möller HJ, Rapoport SI, Hampel H. Progression of corpus callosum atrophy in Alzheimer disease. Arch Neurol. 2002;59(2):243–8. doi: 10.1001/archneur.59.2.243. [DOI] [PubMed] [Google Scholar]
- 13.Zhu M, Gao W, Wang X, Shi C, Lin Z. Progression of corpus callosum atrophy in early stage of Alzheimer’s disease: MRI based study. Acad Radiol. 2012;19(5):512–7. doi: 10.1016/j.acra.2012.01.006. [DOI] [PMC free article] [PubMed] [Google Scholar]
- 14.Collinson SL, Gan SC, Woon PS, Kuswanto C, Sum MY, Yang GL, Lui JM, Sitoh YY, Nowinski WL, Sim K. Corpus callosum morphology in first-episode and chronic schizophrenia: combined magnetic resonance and diffusion tensor imaging study of Chinese Singaporean patients. Br J Psychiatry. 2014;204:55–60. doi: 10.1192/bjp.bp.113.127886. [DOI] [PubMed] [Google Scholar]
- 15.Meisenzahl EM, Frodl T, Greiner J, Leinsinger G, Maag KP, Heiss D, Hahn K, Hegerl U, Möller HJ. Corpus callosum size in schizophrenia--a magnetic resonance imaging analysis. Eur Arch Psychiatry Clin Neurosci. 1999;249(6):305–12. doi: 10.1007/s004060050104. [DOI] [PubMed] [Google Scholar]
- 16.Walterfang M, Yung A, Wood AG, Reutens DC, Phillips L, Wood SJ, Chen J, Velakoulis D, McGorry PD, Pantelis C. Corpus callosum shape alterations in individuals prior to the onset of psychosis. Schizophr Res. 2008;103(1–3):1–10. doi: 10.1016/j.schres.2008.04.042. [DOI] [PubMed] [Google Scholar]
- 17.Kalincik T, Vaneckova M, Tyblova M, Krasensky J, Seidl Z, Havrdova E, Horakova D. Volumetric MRI markers and predictors of disease activity in early multiple sclerosis: a longitudinal cohort study. PLoS One. 2012;7(11):e50101. doi: 10.1371/journal.pone.0050101. [DOI] [PMC free article] [PubMed] [Google Scholar]
- 18.Manson SC, Palace J, Frank JA, Matthews PM. Loss of interhemispheric inhibition in patients with multiple sclerosis is related to corpus callosum atrophy. Exp Brain Res. 2006;174(4):728–33. doi: 10.1007/s00221-006-0517-4. [DOI] [PubMed] [Google Scholar]
- 19.Mesaros S, Rocca MA, Riccitelli G, Pagani E, Rovaris M, Caputo D, Ghezzi A, Capra R, Bertolotto A, Comi G, Filippi M. Corpus callosum damage and cognitive dysfunction in benign MS. Hum Brain Mapp. 2009;30(8):2656–66. doi: 10.1002/hbm.20692. [DOI] [PMC free article] [PubMed] [Google Scholar]
- 20.Estruch R, Nicolás JM, Salamero M, Aragón C, Sacanella E, Fernández-Solà J, Urbano-Márquez A. Atrophy of the corpus callosum in chronic alcoholism. J Neurol Sci. 1997;146(2):145–51. doi: 10.1016/s0022-510x(96)00298-5. [DOI] [PubMed] [Google Scholar]
- 21.Oishi M, Mochizuki Y, Shikata E. Corpus callosum atrophy and cerebral blood flow in chronic alcoholics. J Neurol Sci. 1999;162(1):51–5. doi: 10.1016/s0022-510x(98)00279-2. [DOI] [PubMed] [Google Scholar]
- 22.Pfefferbaum A, Lim KO, Desmond JE, Sullivan EV. Thinning of the corpus callosum in older alcoholic men: a magnetic resonance imaging study. Alcohol Clin Exp Res. 1996;20(4):752–7. doi: 10.1111/j.1530-0277.1996.tb01682.x. [DOI] [PubMed] [Google Scholar]
- 23.Tarnowska-Dziduszko E, Bertrand E, Szpak GM. Morphological changes in the corpus callosum in chronic alcoholism. Folia Neuropathol. 1995;33(1):25–9. [PubMed] [Google Scholar]
- 24.Di Paola M, Caltagirone C, Spalletta G. What does the corpus callosum tell us about brain changes in the elderly? Expert Rev Neurother. 2011;11(11):1557–60. doi: 10.1586/ern.11.130. [DOI] [PubMed] [Google Scholar]
- 25.Ryberg C, Rostrup E, Paulson OB, Barkhof F, Scheltens P, van Straaten EC, van der Flier WM, Fazekas F, Schmidt R, Ferro JM, Baezner H, Erkinjuntti T, Jokinen H, Wahlund LO, Poggesi A, Pantoni L, Inzitari D, Waldemar G LADIS study group . Corpus callosum atrophy as a predictor of age-related cognitive and motor impairment: a 3-year follow-up of the LADIS study cohort. J Neurol Sci. 2011;307(1–2):100–5. doi: 10.1016/j.jns.2011.05.002. [DOI] [PubMed] [Google Scholar]
- 26.Di Paola M, Di Iulio F, Cherubini A, Blundo C, Casini AR, Sancesario G, Passafiume D, Caltagirone C, Spalletta G. When, where, and how the corpus callosum changes in MCI and AD: a multimodal MRI study. Neurology. 2010;74(14):1136–42. doi: 10.1212/WNL.0b013e3181d7d8cb. [DOI] [PubMed] [Google Scholar]
- 27.Herron TJ, Kang X, Woods DL. Automated measurement of the human corpus callosum using MRI. Front Neuroinform. 2012;6:25. doi: 10.3389/fninf.2012.00025. [DOI] [PMC free article] [PubMed] [Google Scholar]
- 28.Lee C, Huh S, Ketter TA, Unser M. Automated segmentation of the corpus callosum in midsagittal brain magnetic resonance images. Optical Engineering. 2000;39(4):924–35. [Google Scholar]
- 29.Lee SP, Cheng JZ, Chen CM, Tseng WY. An automatic segmentation approach for boundary delineation of corpus callosum based on cell competition. Conf Proc IEEE Eng Med Biol Soc. 2008;2008:5514–7. doi: 10.1109/IEMBS.2008.4650463. [DOI] [PubMed] [Google Scholar]
- 30.Li Y, Mandal M, Ahmed SN. Fully automated segmentation of corpus callosum in midsagittal brain MRIs. Conf Proc IEEE Eng Med Biol Soc. 2013;2013:5111–4. doi: 10.1109/EMBC.2013.6610698. [DOI] [PubMed] [Google Scholar]
- 31.Vachet C, Yvernault B, Bhatt K, Smith RG, Gerig G, Hazlett HC, Styner M. Automatic corpus callosum segmentation using a deformable active Fourier contour model. Proc. Soc Photo Opt Instrum Eng. 2012;2012:8317. doi: 10.1117/12.911504. [DOI] [PMC free article] [PubMed] [Google Scholar]
- 32.Hallam BJ, Brown WS, Ross C, Buckwalter JG, Bigler ED, Tschanz JT, Norton MC, Welsh-Bohmer KA, Breitner JC. Regional atrophy of the corpus callosum in dementia. J Int Neuropsychol Soc. 2008;14(3):414–23. doi: 10.1017/S1355617708080533. [DOI] [PubMed] [Google Scholar]
- 33.Hensel A, Wolf H, Kruggel F, Riedel-Heller SG, Nikolaus C, Arendt T, Gertz HJ. Morphometry of the corpus callosum in patients with questionable and mild dementia. J Neurol Neurosurg Psychiatry. 2002;73(1):59–61. doi: 10.1136/jnnp.73.1.59. [DOI] [PMC free article] [PubMed] [Google Scholar]
- 34.Janowsky JS, Kaye JA, Carper RA. Atrophy of the corpus callosum in Alzheimer’s disease versus healthy aging. J Am Geriatr Soc. 1996;44(7):798–803. doi: 10.1111/j.1532-5415.1996.tb03736.x. [DOI] [PubMed] [Google Scholar]
- 35.Thomann PA, Wustenberg T, Pantel J, Essig M, Schroder J. Structural changes of the corpus callosum in mild cognitive impairment and Alzheimer’s disease. Dement Geriatr Cogn Disord. 2006;21(4):215–20. doi: 10.1159/000090971. [DOI] [PubMed] [Google Scholar]
- 36.Tomimoto H, Lin JX, Matsuo A, Ihara M, Ohtani R, Shibata M, Miki Y, Shibasaki H. Different mechanisms of corpus callosum atrophy in Alzheimer’s disease and vascular dementia. J Neurol. 2004;251(4):398–406. doi: 10.1007/s00415-004-0330-6. [DOI] [PubMed] [Google Scholar]
- 37.Wang PJ, Saykin AJ, Flashman LA, Wishart HA, Rabin LA, Santulli RB, McHugh TL, MacDonald JW, Mamourian AC. Regionally specific atrophy of the corpus callosum in AD, MCI and cognitive complaints. Neurobiol Aging. 2006;27(11):1613–7. doi: 10.1016/j.neurobiolaging.2005.09.035. [DOI] [PMC free article] [PubMed] [Google Scholar]
- 38.Yamauchi H, Fukuyama H, Harada K, Nabatame H, Ogawa M, Ouchi Y, Kimura J, Konishi J. Callosal atrophy parallels decreased cortical oxygen metabolism and neuropsychological impairment in Alzheimer’s disease. Arch Neurol. 1993;50(10):1070–4. doi: 10.1001/archneur.1993.00540100061017. [DOI] [PubMed] [Google Scholar]
- 39.Zhu M, Wang X, Gao W, Shi C, Ge H, Shen H, Lin Z. Corpus callosum atrophy and cognitive decline in early Alzheimer’s disease: Longitudinal MRI study. Dement Geriatr Cogn Disord. 2013;37(3–4):214–222. doi: 10.1159/000350410. [DOI] [PubMed] [Google Scholar]
- 40.Ardekani BA, Figarsky K, Sidtis JJ. Sexual dimorphism in the human corpus callosum: an MRI study using the OASIS brain database. Cereb Cortex. 2013;23(10):2514–20. doi: 10.1093/cercor/bhs253. [DOI] [PMC free article] [PubMed] [Google Scholar]
- 41.Witelson SF, Goldsmith CH. The relationship of hand preference to anatomy of the corpus callosum in men. Brain Res. 1991;545(1–2):175–82. doi: 10.1016/0006-8993(91)91284-8. [DOI] [PubMed] [Google Scholar]
- 42.Sullivan EV, Pfefferbaum A, Adalsteinsson E, Swan GE, Carmelli D. Differential rates of regional brain change in callosal and ventricular size: a 4-year longitudinal MRI study of elderly men. Cereb Cortex. 2002;12(4):438–45. doi: 10.1093/cercor/12.4.438. [DOI] [PubMed] [Google Scholar]
- 43.Schlaug G, Forgeard M, Zhu L, Norton A, Norton A, Winner E. Training-induced neuroplasticity in young children. Ann N Y Acad Sci. 2009;1169:205–8. doi: 10.1111/j.1749-6632.2009.04842.x. [DOI] [PMC free article] [PubMed] [Google Scholar]
- 44.Marcus DS, Fotenos AF, Csernansky JG, Morris JC, Buckner RL. Open Access Series of Imaging Studies: Longitudinal MRI data in nondemented, and demented older adults. Journal of Cognitive Neuroscience. 2010;22:2677–84. doi: 10.1162/jocn.2009.21407. [DOI] [PMC free article] [PubMed] [Google Scholar]
- 45.Mueller SG, Weiner MW, Thal LJ, Peterson RC, Jack CR, Jagust W, Trojanowski JQ, Toga AW, Beckett L. Ways toward an early diagnosis in Alzheimer’s disease: the Alzheimer’s Disease Neuroimaging Initiative (ADNI) Alzheimer’s & Dementia. 2005;1:55–66. doi: 10.1016/j.jalz.2005.06.003. [DOI] [PMC free article] [PubMed] [Google Scholar]
- 46.Petersen RC, Aisen PS, Beckett LA, Donohue MC, Gamst AC, Harvey DJ, et al. Alzheimer’s Disease Neuroimaging Initiative (ADNI): clinical characterization. Neurology. 2010;74:201–9. doi: 10.1212/WNL.0b013e3181cb3e25. [DOI] [PMC free article] [PubMed] [Google Scholar]
- 47.Jack CR, Bernstein MA, Fox NC, Thompson P, Alexander G, Harvey D, Borowski B, Britson PJ, Whitwell JL, Ward C, Dale AM, Felmlee JP, Gunter JL, Hill DLG, Killiany R, Schuff N, Fox- Bosetti S, Lin C, Studholme C, DeCarli CS, Krueger G, Ward HA, Metzger GJ, Scott KT, Mallozzi R, Blezek D, Levy J, Debbins JP, Fleisher AS, Albert M, Green R, Bartzokis G, Glover G, Mugler J, Weiner MW. The Alzheimer’s disease neuroimaging initiative (ADNI): MRI methods. Journal of Magnetic Resonance Imaging. 2008;27(4):685–91. doi: 10.1002/jmri.21049. [DOI] [PMC free article] [PubMed] [Google Scholar]
- 48.WWW.ADNI-info.org/and WWW.loni.ucla.edu/
- 49.Petersen RC, Smith GE, Waring SC, Ivnik RJ, Tangalos EG, Kokmen E. cognitive impairment: clinical characterization and outcome. Arch Neurol. 1999;56(3):303–8. doi: 10.1001/archneur.56.3.303. [DOI] [PubMed] [Google Scholar]
- 50.Petersen RC, Smith GE, Ivnik, Tangalos EG, Schaid DJ, Thibodeau SN, Kokmen E, Waring SC, Kurland LT. Apolipoprotein E status as a predictor of the development of Alzheimer’s disease in memory-impaired individuals. JAMA. 1995;273(16):1274–8. [PubMed] [Google Scholar]
- 51.Tierney MC, Szalai JP, Snow WG, Fisher RH, Nores A, Nadon G, Dunn E, St George-Hyslop PH. Prediction of probable Alzheimer’s disease in memory-impaired patients: a prospective longitudinal study. Neurology. 1996;46(3):661–5. doi: 10.1212/wnl.46.3.661. [DOI] [PubMed] [Google Scholar]
- 52.Daly E, Zaitchik D, Copeland M, Schmahmann J, Gunther J, Albert M. Predicting conversion to Alzheimer disease using standardized clinical information. Arch Neurol. 2000;57(5):675–80. doi: 10.1001/archneur.57.5.675. [DOI] [PubMed] [Google Scholar]
- 53.Small GW, La Rue A, Komo S, Kaplan A, Mandelkern MA. Predictors of cognitive change in middle-aged and older adults with memory loss. Am J Psychiatry. 1995;152(12):1757–64. doi: 10.1176/ajp.152.12.1757. [DOI] [PubMed] [Google Scholar]
- 54.Morris JC, Storandt M, Miller JP, McKeel DW, Price JL, Rubin EH, Berg L. Mild Cognitive Impairment Represents Early-Stage Alzheimer Disease. Arch Neurol. 2001;58(3):397–405. doi: 10.1001/archneur.58.3.397. [DOI] [PubMed] [Google Scholar]
- 55.Jack CR, Jr, Petersen RC, Xu YC, O’Brien PC, Smith GE, Ivnik RJ, Boeve BF, Waring SC, Tangalos EG, Kokmen E. Prediction of AD with MRI-based hippocampal volume in mild cognitive impairment. Neurology. 1999;52 (7):1397–403. doi: 10.1212/wnl.52.7.1397. [DOI] [PMC free article] [PubMed] [Google Scholar]
- 56.Du AT, Schuff N, Amend D, Laakso MP, Hsu YY, Jagust WJ, Yaffe K, Kramer HJ, Reed B, Norman D, Chui HC, Weiner MW. Magnetic resonance imaging of the entorhinal cortex and hippocampus in mild cognitive impairment and Alzheimer’s disease. J Neurol Neurosurg Psychiatry. 2001;71(4):441–7. doi: 10.1136/jnnp.71.4.441. [DOI] [PMC free article] [PubMed] [Google Scholar]
- 57.Risacher SL, Saykin AJ, West JD, Shen L, Firpi HA, McDonald BC Alzheimer’s Disease Neuroimaging Initiative (ADNI) . Baseline MRI Predictors of Conversion from MCI to Probable AD in the ADNI Cohort. Current Alzheimer Research. 2009;6(4):347–61. doi: 10.2174/156720509788929273. [DOI] [PMC free article] [PubMed] [Google Scholar]
- 58.Aksu Y, Miller DJ, Kesidis G, Bigler DC, Yang QX. An MRI-Derived Definition of MCI-to-AD Conversion for Long-Term, Automatic Prognosis of MCI Patients. PLoS One. 2011;6(10):e25074. doi: 10.1371/journal.pone.0025074. [DOI] [PMC free article] [PubMed] [Google Scholar]
- 59.Davatzikosa C, Bhatta P, Shawb LM, Batmanghelicha KN, Trojanowskib JQ. Prediction of MCI to AD conversion, via MRI, CSF biomarkers, pattern classification. Neurobiol Aging. 2011;32(12):2322.e19–27. doi: 10.1016/j.neurobiolaging.2010.05.023. [DOI] [PMC free article] [PubMed] [Google Scholar]
- 60.Wyman BT, Harvey DJ, Crawford K, Bernstein MA, Carmichael O, Cole PE, Crane PK, DeCarli C, Fox NC, Gunter JL, Hill D, Killiany RJ, Pachai C, Schwarz AJ, Schuff N, Senjem ML, Suhy J, Thompson PM, Weiner M, Jack CR, Jr Alzheimer’s Disease Neuroimaging Initiative . Standardization of analysis sets for reporting results from ADNI MRI data. Alzheimers Dement. 2013;9(3):332–7. doi: 10.1016/j.jalz.2012.06.004. [DOI] [PMC free article] [PubMed] [Google Scholar]
- 61.Ardekani BA, Kershaw J, Braun M, Kanno I. Automatic detection of the mid-sagittal plane in 3-D brain images. IEEE Trans Med Imaging. 1997;16(6):947–52. doi: 10.1109/42.650892. [DOI] [PubMed] [Google Scholar]
- 62.Ardekani BA, Bachman AH. Model-based automatic detection of the anterior and posterior commissures on MRI scans. Neuroimage. 2009;46(3):677–82. doi: 10.1016/j.neuroimage.2009.02.030. [DOI] [PMC free article] [PubMed] [Google Scholar]
- 63.Ardekani BA, Guckemus S, Bachman A, Hoptman MJ, Wojtaszek M, Nierenberg J. Quantitative comparison of algorithms for inter-subject registration of 3D volumetric brain MRI scans. J Neurosci Methods. 2005;142(1):67–76. doi: 10.1016/j.jneumeth.2004.07.014. [DOI] [PubMed] [Google Scholar]
- 64.Fisher RA. The Use of Multiple Measurements in Taxonomic Problems. Annals of Eugenics. 1936;7(2):179–88. [Google Scholar]
- 65.Hampel H, Teipel SJ, Alexander GE, Pogarell O, Rapoport SI, Moller HJ. In vivo imaging of region and cell type specific neocortical neurodegeneration in Alzheimer’s disease. Perspectives of MRI derived corpus callosum measurement for mapping disease progression and effects of therapy. Evidence from studies with MRI, EEG and PET. J Neural Transm. 2009;109(5–6):837–55. doi: 10.1007/s007020200069. [DOI] [PubMed] [Google Scholar]
- 66.Amieva H, Mokri H, Le Goff M, Meillon C, Jacqmin-Gadda H, Foubert-Samier A, Orgogozo JM, Stern Y, Dartigues JF. Compensatory mechanisms in higher-educated subjects with Alzheimer’s disease: a study of 20 years of cognitive decline. Brain. 2014;137(Pt 4):1167–75. doi: 10.1093/brain/awu035. [DOI] [PubMed] [Google Scholar]
- 67.Lee SH, Yu D, Bachman AH, Lim J, Ardekani BA. Application of fused lasso logistic regression to the study of corpus callosum thickness in early Alzheimer’s disease. J Neurosci Methods. 2014;221:78–84. doi: 10.1016/j.jneumeth.2013.09.017. [DOI] [PMC free article] [PubMed] [Google Scholar]