

Summary
Innate defense behaviors (IDBs) evoked by threatening sensory stimuli are essential for animal survival. Although subcortical circuits are implicated in IDBs, it remains largely unclear whether sensory cortex modulates IDBs and what are the underlying neural pathways. Here, we show that optogenetic silencing of corticotectal projections from layer 5 (L5) of the mouse primary visual cortex (V1) to the superior colliculus (SC) significantly reduces a SC-dependent innate behavior, i.e. temporary suspension of locomotion upon a sudden flash of light as short as milliseconds. Surprisingly, optogenetic activation of SC-projecting neurons in V1 or their axon terminals in SC sufficiently elicits the behavior, in contrast to other major L5 corticofugal projections. Thus, via the same corticofugal projection, visual cortex not only modulates the light-induced arrest behavior, but also can directly drive the behavior. Our results suggest that sensory cortex may play a previously unrecognized role in the top-down initiation of sensory-motor behaviors.
Introduction
Innate defense behaviors invoked by natural threatening sensory stimuli (Bordi and LeDoux, 1992; LeDoux, 2012; Motta et al., 2009; Yilmaz and Meister, 2013) are essential for animal survival. In nocturnal rodents, an expanding dark visual stimulus above the animal, which is analogous to a looming shadow indicating an approaching aerial predator, triggers two types of protective behavior: the animal either dashes for cover underneath an opaque nest (Wallace et al., 2013; Yilmaz and Meister, 2013), or stops moving and stands completely motionless for an extended period of time (Yilmaz and Meister, 2013). The latter behavior, called “freezing”, may render the detection of the prey animal more difficult. Simpler visual stimuli such as increasing illumination can also evoke a variety of behaviors that may indicate fear or anxiety. For instance, lighting differentials evoke a preference for dark, whereby rats tend to avoid brightly illuminated places (Godsil and Fanselow, 2004; Williams, 1971). Bright illumination evokes thigmotaxis (a tendency to stay near walls), a behavior that can reduce detectability and threats of attack from behind and above (Godsil and Fanselow, 2004; Valle, 1970). In an open field arena, the onset and termination of bright light temporarily increase locomotion in rats, and this has been thought as an exploratory response geared at investigating surroundings, which is a protective behavior before encountering predators (Godsil and Fanselow, 2004). These studies suggest that bright light may be a danger signal for rodents.
Midbrain structures including the superior colliculus (SC), inferior colliculus (IC) and periaqueductal grey (PAG) have been implicated in the production of unconditioned or innate defense behaviors (Brandao et al., 2005; McHaffie et al., 2005; Sahibzada et al., 1986; Schenberg et al., 2005; Sudre et al., 1993). Anatomically midbrain colliculi receive abundant corticofugal projections from sensory cortices (Comoli et al., 2012; McHaffie et al., 1993; Oh et al., 2014; Wang and Burkhalter, 2013). The superficial layers of SC receive massive inputs from the primary visual cortex (V1), and visual inputs to the deeper layers of SC arise predominantly from the secondary visual cortices (Comoli et al., 2012; Harting et al., 1992; Harvey and Worthington, 1990). It is natural to speculate that sensory cortex may relay processed information, e.g. contextual information and information on the evaluated threatening nature of stimuli, to the colliculi. However, the role of sensory cortex in naturally induced innate behaviors and the neural circuits underlying the cortical impacts on these behaviors have remained poorly understood.
In this study, we intended to develop a behavioral assay that is amenable to easy quantification of response levels. This allowed us to investigate the neural pathways underlying an identified visually-induced innate behavior, i.e. temporary suspension of locomotion upon a sudden flash of light. By combining optogenetic manipulations of activity of different neural structures, we revealed that the behavior depended on intact SC activity and that specific corticofugal circuits played a critical role in modulating and driving this behavior.
Results
Light-induced temporary arrest behavior
We first examined visually-induced behavioral reactions using simple stimuli such as a flash. We observed that when a mouse was running in a tunnel connecting two chambers, a sudden flash of white light (1 s duration) at the end of the tunnel in front of it induced a fast transient stop of the animal, which then resumed running through the tunnel (Figure 1A, 1B). Such quick suspension of locomotion upon an unanticipated stimulus, which we termed “temporary arrest behavior”, appeared distinct from the freezing behavior under looming stimuli, which is characterized by complete and sustained immobilization (Yilmaz and Meister, 2013). Nonetheless, the arrest behavior is possibly defensive and protective similar as freezing, as it allows the animal to avoid immediate threats and to have a better surveillance of its surroundings. It occurred on the first trial in each tested animal, and could be reliably induced in all the animals (Figure 1C). Thus we reason that such behavior is most likely innate.
Figure 1. A light-induced temporary arrest behavior.
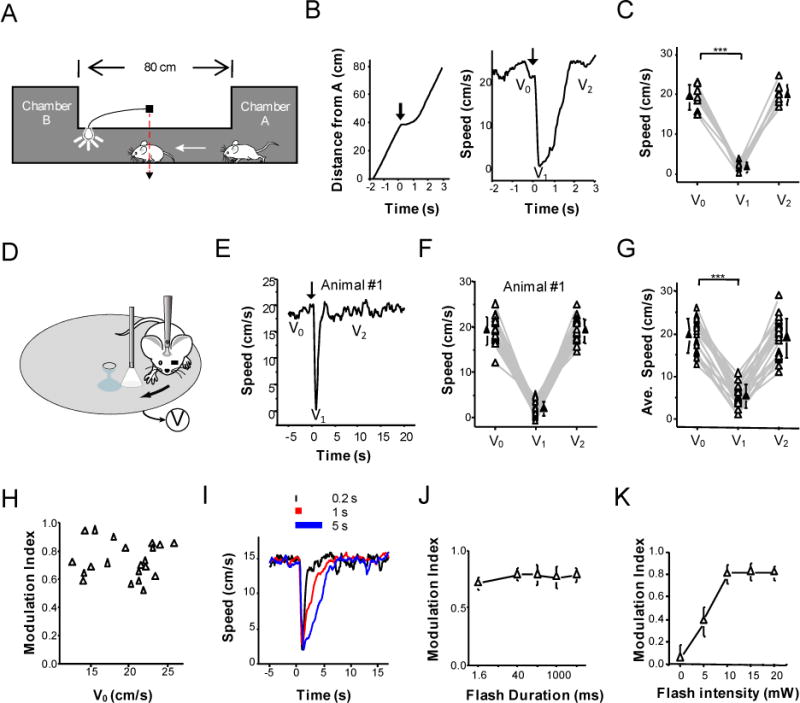
(A) Schematic drawing of a running test. Two housing chambers were connected with a tunnel. While the mouse was running in the tunnel, its passing an infrared sensor (red dash line) triggered a flash of white light (1-s duration) at the end of the tunnel in front of it. The mouse stopped transiently and then resumed running through the tunnel.
(B) Left, time course of the distance of the animal from chamber A for a representative mouse. Arrow marks the onset of flash (time zero). Right, running speed of the same animal. V0, V1 and V2 represent the baseline speed, minimum speed due to the suspension of motion and recovered speed respectively.
(C) Plot of V0, V1 and V2 for 8 animals. Data points for the same animal are connected with lines. ***, p < 0.001, paired t-test.
(D) Head-fixed preparation. The mouse was restrained via a head post and was allowed to run freely on a rotatable plate. While the animal was running, a flash of light was applied via an optic fiber in front of the right eye with the left eye blocked. The running speed (V) was monitored in real time.
(E) Record of speed for a representative mouse (averaged over 20 trials). Time zero is the onset of flash.
(F) Plot of V0, V1 and V2 over 20 trials for the same animal. Data points for the same trial are connected with lines.
(G) Plot of average V0, V1 and V2 for 21 animals. Solid symbol represents mean. Bar = SD. ***, p < 0.001, paired t-test.
(H) Plot of modulation index (MI) versus V0. Correlation coefficient = −0.025.
(I) Example speed records of a mouse in response to 0.2 s, 1 s and 5 s flash respectively.
(J) Comparison of modulation indices under 1.6 ms, 0.04 s, 0.2 s, 1 s, and 5 s flash. There is no significant difference (p > 0.05, one-way ANOVA test, n = 6 animals in each group). Bar = SD.
(K) MI versus intensity of flash. Bar = SD. N = 5 animals.
To study the neural circuits underlying the observed behavior, we employed a head-fixed preparation so that the response could be easily quantified. The mouse was trained to run on a rotatable plate, and the running speed was recorded in real time (Figure 1D). Similar to what was observed for freely moving mice, a 1-s flash of light in front of the right eye (with the left eye blocked) resulted in a fast reduction of its running speed to nearly zero within 1 second after the onset of flash, after which the animal quickly resumed running, as reflected by the recovered speed (Figure 1E and Supplementary Video). Such quick suspension of motion could be observed reliably in every testing trial in an individual animal (Figure 1F), and was observed for all the animals tested (n = 21 mice, Figure 1G). On average, the reduction of speed started at 0.55 ± 0.08 sec (n = 21) after the onset of flash, and it took another 0.12 ± 0.09 sec for the reduction to reach the half-maximum level. To quantify the magnitude of the behavioral response, we used a modulation index (MI), which was defined as the change of running speed relative to the baseline speed (V0−V1) divided by the V0. MI = 0 indicates no change in running speed and MI =1 indicates a full stop of the animal. In our tested population of mice, a great majority of them exhibited an MI > 0.6, with a mean value of 0.73 ± 0.12 (Figure 1H). In addition, there was no correlation between MI and V0 (Figure 1H). These data indicate that the suspension of motion was nearly complete, and was relatively independent of the running status of the animal. Flash durations as short as 0.2 sec and even 1.6 ms resulted in a similar response level, and increasing the duration to 5 sec did not further increase the response magnitude (Figure 1I, 1J), although it took the animal longer to recover its speed as the duration of flash increased (time to recover to the half level: 0.90 ± 0.63 s for 1.6-ms flash; 0.96 ± 0.57 s for 0.2-s flash; 1.50 ± 0.47 s for 1-s flash; 3.19 ± 0.48 s for 5-s flash). On the other hand, the behavioral response depended critically on the intensity of flash, and appeared saturated at moderately high intensity levels (Figure 1K). Finally, the response magnitude was relatively stable within a 30-min testing window, after which there was a progressive adaptation of the behavior (Figure S1A). However, a 30-min resting period without applying flash stimulation allowed a full recovery of the behavior (Figure S1A). Based on this information, we limited the duration of our testing sessions to 30 min in the following experiments.
Dependency of the arrest behavior on SC
The SC has been implicated in the production of innate defense behaviors (Schenberg et al., 2005). We next examined whether visual pathways through the SC mediated the behavior currently observed. Since the retinal input to the SC is bilateral with a dense contralateral projection and a sparse ipsilateral one (Dhande and Huberman, 2014; Lemke and Reber, 2005), we silenced the SC bilaterally by local injections of muscimol (see Experimental Procedures). Using fluorescent muscimol, we confirmed that the drug was largely restricted within the SC structure after the injection (Figure 2A). The effectiveness of muscimol was demonstrated by the blockade of spike responses to flash stimuli in the SC contralateral to the eye stimulated (Figure 2B). Silencing of the SC greatly suppressed the behavior (Figure 2C). On average, its magnitude was reduced by 76% (Figure 2D). This reduction could not be attributed to the behavioral adaption over time, since the animal was allowed to rest for at least 30 min before testing again after muscimol injections. The small residual response might be explained by two reasons: 1) the SC structure might not be completely silenced because of its relatively large volume; 2) visual pathways through structures other than the SC might also contribute to the behavior. In any case, our results suggest that SC is a major contributor in mediating the temporary arrest behavior.
Figure 2. Dependence on SC and modulation by the corticotectal projection to SC.
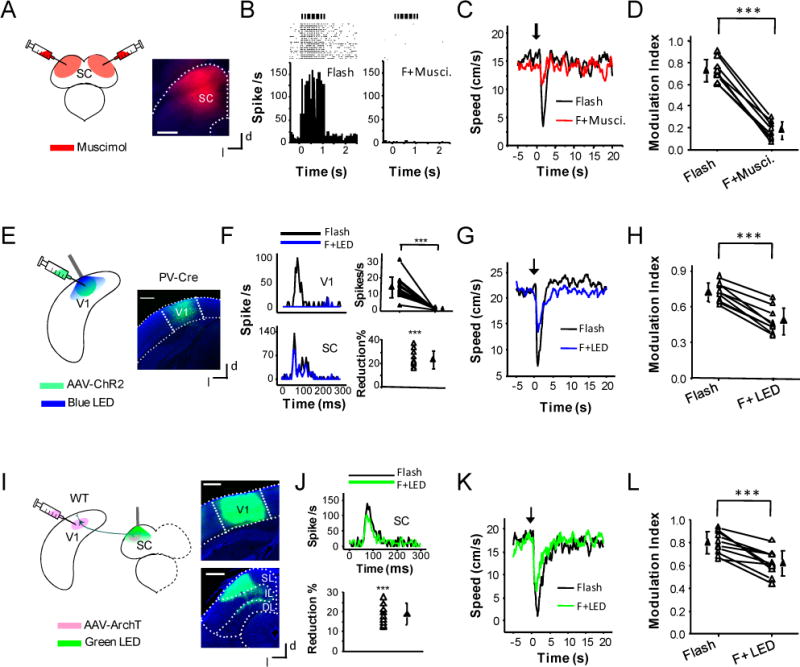
(A) Experimental condition: fluorescent muscimol was injected into the SC bilaterally. Right, image showing the spread of muscimol. Scale bar: 500 μm. d, dorsal; l, lateral.
(B) Raster plot (upper) and peri-stimulus spike time histogram (PSTH) for multi-unit spike responses (20 trials, bin size = 5ms) to a train of flashes (50 ms duration, 10 Hz, each pulse marked by a vertical bar) before (left) and after (right) the bilateral injections of muscimol into the SC, recorded in the superficial layer of SC.
(C) Average speed profile of a mouse before (black) and after (red) the muscimol injection.
(D) Comparison of modulation indices before and after silencing the SC. ***, p < 0.001, paired t-test. N = 8 animals. Data points for the same animal are connected with a line.
(E) Experimental condition: AAV-DIO-ChR2 was injected into the V1 region of PV-Cre mice. Weeks later, blue LED light was applied onto the surface of the visual cortex. Right, confocal image of a brain slice showing the expression of ChR2-EYFP in the V1 region (outlined by two dotted lines). Scale bar: 500 μm.
(F) Upper left, PSTHs for spike responses (bin size = 2 ms) of a V1 L5 neuron to flash stimulation (0.2 s) without (black) and with (blue) co-applying LED illumination (20 ms pulse duration, 25 Hz, 0.2 s long). Upper right, summary of average spike rates evoked by flash stimulation without (Flash) and with (F+LED) co-applying LED illumination for 13 cells in 5 animals. Lower panel, PSTHs for spike responses of a neuron in the superficial layer of SC to flash stimulation without (black) and with (blue) co-applying LED illumination on the visual cortex (left), and summary of percentage reduction of flash evoked spike rate under co-application of LED illumination for 11 cells in 5 animals (right). ***, p < 0.001, paired t-test.
(G) Average speed profile of a mouse without (black) and with (blue) LED illumination on the visual cortex.
(H) Summary of modulation indices without and with LED illumination for 9 animals. ***, p < 0.001, paired t-test.
(I) Experimental condition: AAV-ArchT was injected into the V1 of wild-type mice. Weeks later, green LED light was applied onto the SC surface. Right, images showing ArchT expression in the V1 region (top) and corticofugal axon terminations in the SC (bottom). Scale: 500 μm. SL: superficial layer; IL, intermediate layer; DL, deep layer.
(J) Top, PSTHs for spike responses of a neuron in the superficial layer of SC to flash stimulation (0.2 s) without (black) and with (green) co-applying LED illumination (0.2 s). Bottom, percentage reduction of evoked spike rate under co-application of LED illumination, recorded from 11 cells in 10 animals. ***, p < 0.001, paired t-test.
(K) Average speed profile of an example animal without (black) and with (green) LED illumination.
(L) Comparison of modulation indices without and with LED illumination for 10 animals. ***, p < 0.001, paired t-test.
Modulation of the temporary arrest behavior by V1
The SC receives direct input from the ipsilateral primary visual cortex (V1) and surrounding regions (Comoli et al., 2012; Harvey and Worthington, 1990; McHaffie et al., 1993; Oh et al., 2014). A straightforward question is whether V1 also plays a role in the visually evoked behavior. To silence the V1, we optogenetically activated parvalbumin (PV)-positive inhibitory neurons (Li et al., 2013b; Lien and Scanziani, 2013). We injected an adeno-associated viral vector encoding double-floxed inverted channelrhodopsin 2 (ChR2) fused with EYFP (i.e. AAV-DIO-ChR2-EYFP) (Fenno et al., 2011) into the V1 of PV-Cre mice (Figure 2E). Weeks later, blue LED light (470 nm) was applied to the visual cortical surface through an optic fiber, with the tip of the fiber covered by dark stained agar to minimize the leakage of LED light (see Experimental Procedures). Loose-patch recordings from fast-spiking cells confirmed that PV neurons could be activated by the LED light (Figure S2A–C). Loose-patch recordings in L5 of the V1 contralateral to the stimulated eye further confirmed that excitatory cell responses to flash could be completely silenced by a train of LED light pulses (20 ms pulse, at 25 Hz) (Figure 2F, top panel). When the V1 was optogenetically silenced, visually evoked responses of neurons in the SC on the same side was significantly reduced (Figure 2F, bottom panel). This result suggests that V1 activity enhances SC responses in normal conditions, and is consistent with a recent study showing that the magnitude of SC responses to looming shadows is reduced after the V1 is silenced (Zhao et al., 2014). To test the effect of V1 silencing on the behavior, we interleaved flash stimulation without and with LED illumination. We found that LED illumination resulted in a robust reduction of the behavioral response induced by flash stimulation (Figure 2G). On average, MI was reduced by 33% (Figure 2H). This result indicates that V1 indeed contributes to the arrest behavior by modulating, and to be more specific, enhancing its amplitude.
V1 modulation through corticofugal projections to the SC
To test if V1 modulates the arrest behavior through corticofugal projections to the SC, we injected AAV–CAG-FLEX-ArchT-GFP into the V1 of wild-type mice (Figure 2I). This labeled corticotectal axons in the SC, which were found distributed primarily in the superficial layer of this structure (Figure 2I, right), consistent with previous anatomical studies (Harting et al., 1992; Harvey and Worthington, 1990). Green LED light (530 nm) was applied to the surface of the SC ipsilateral to the injected V1 (Figure S2D), as to suppress activity of ArchT-expressing corticotectal axons. Notably, the LED illumination significantly reduced the spike responses of SC neurons to flash stimulation (Figure 2J), although at a moderate level. In the meanwhile, it clearly reduced the amplitude of the behavior evoked by flash stimulation (Figure 2K). On average, MI was reduced by 22% (Figure 2L). In contrast, the same LED illumination applied to control mice where GFP was expressed in corticotectal axons did not significantly affect their arrest behaviors (Figure S2E–F). Together, these results strongly suggest that the V1 corticofugal projection to the SC does play a role in mediating its modulation of the light-induced behavior.
Initiation of the arrest behavior by V1 activation
Our data above indicate that cortical activity enhances the visually-evoked behavior. Would it be possible that this is achieved, at least partially, by directly driving the behavior via the corticotectal projection to the SC? To test this possibility, we injected the AAV-DIO-ChR2-EYFP into the V1 of a L5-specific Cre mouse line, Rpb4-Cre (Madisen et al., 2012), considering that corticotectal projections originate mainly from L5 (Harvey and Worthington, 1990; Oh et al., 2014). The EYFP-labeled L5 neurons exhibited a characteristic apical dendrite extending into L1 (Figure 3A), consistent with their known morphology (Feng et al., 2000; Sugino et al., 2006). Blue LED light applied to the cortical surface could induce spiking activity of ChR2-expressing L5 neurons, as demonstrated by loose-patch recordings (Figure 3B). Notably, the optic activation of L5 neurons (50 ms on and 50 ms off, at 10 Hz, duration = 1s) alone resulted in a marked reduction in running speed (Figure 3C, 3D), similar to the effect under flash stimulation. MI resulting from LED illumination (0.72 ± 0.12, mean ± SD, n = 8) was comparable to that from flash stimulation (p > 0.05, t test). Finally, control mice injected with AAV-GFP did not respond to the same LED illumination (Figure S3A–C), indicating that the optogenetically induced behavior could not be attributed to an effect through stimulating the retina under our experimental condition. Based on the above results, we reasoned that the visual cortex might amplify the sensory-induced arrest behavior and drive the behavior in the absence of sensory input through a common neural pathway.
Figure 3. V1 can directly drive an arrest behavior via the corticotectal projection to SC.
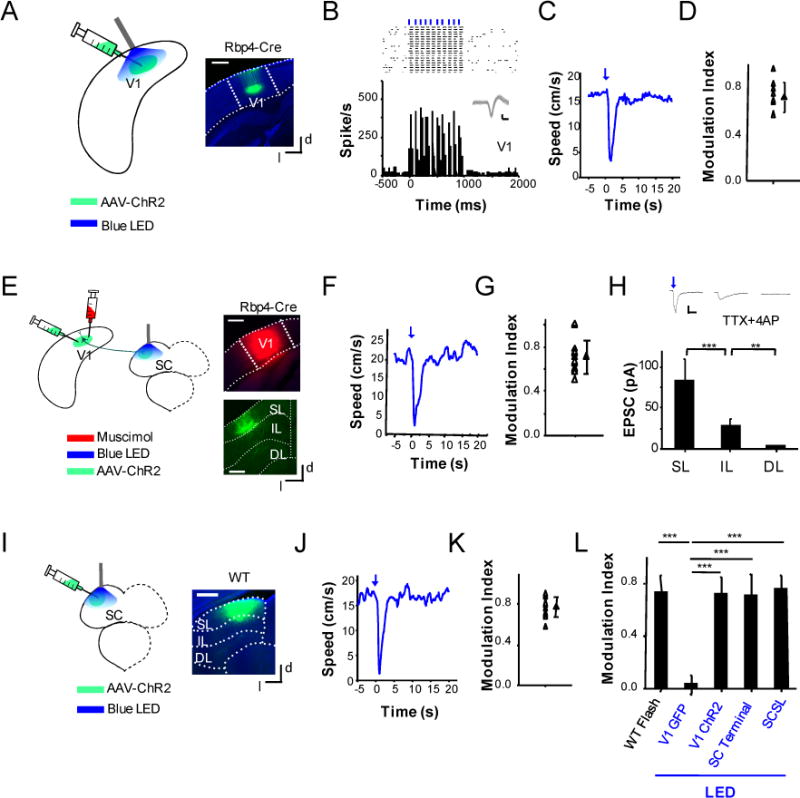
(A) Experimental condition: AAV-DIO-ChR2 was injected into the V1 of Rbp4-Cre mice. Weeks later, blue LED light was applied to the cortical surface. Right, image showing the expression of ChR2 in the V1 region. Scale bar: 500 μm.
(B) Top, raster plot of spikes of a V1 L5 neuron in response to 10 pulses of LED light (50 ms pulse duration, 10 Hz). Each blue vertical bar indicates one LED pulse. Bottom, corresponding PSTH. Inset, 50 superimposed individual spike waveforms. Scale: 50 pA, 1 ms.
(C) Average speed profile of an example animal in response to LED stimulation alone without flash.
(D) Summary of modulation indices resulting from LED stimulation only for 8 animals.
(E) Experimental condition: AAV-DIO-ChR2 was injected into the V1 of Rbp4-Cre mice. Weeks later, blue LED light was applied onto the SC while V1 was silenced with muscimol. Right, images showing the spread of muscimol in the cortex (top) and EYFP-labeled corticotectal axons in the SC (bottom). Scale: 500 μm.
(F) Average speed profile of an example animal in response to LED illumination (50 ms pulse duration, 10 Hz, 1 s long) on the SC without flash.
(G) Summary of modulation indices under LED illumination alone for 12 animals.
(H) Average monosynaptic excitatory postsynaptic currents (EPSCs) recorded from SL (n = 14), IL (n = 14) and DL (n = 11) SC neurons in the same slices evoked by optical activation of corticotectal projections. ***, p < 0.001; **, p < 0.01, t-test. Top inset, average EPSCs of example neurons in each corresponding layer of SC. Scale: 25 pA, 30 ms.
(I) Experimental condition: AAV-CamKIIa-ChR2 was injected into the superficial layer of SC. Weeks later, blue LED illumination was applied to the SC surface. Right, image showing the expression of ChR2-EYFP in SC. Scale: 500 μm.
(J) Average speed profile of an example animal in response to LED illumination on the SC without flash.
(K) Summary of modulation indices under LED stimulation alone for 12 animals.
(L) Comparison of modulation indices under different conditions. V1 GFP: AAV-GFP was injected into V1, which serves as a control (n = 5 animals). ***, p < 0.001, one-way ANOVA post hoc test.
V1 drives the arrest behavior via corticotectal projections to the SC
To determine if the optogenetically-induced behavior was also mediated by corticotectal projections to the SC, in the Rpb4-Cre mice injected with AAV-DIO-ChR2-EYFP in the V1, we applied LED illumination onto the SC surface (see Figure S2D), while silenced the V1 with muscimol as to prevent potential antidromic stimulation of L5 neurons (Figure 3E). Loose-patch recordings confirmed that spiking activity of V1 L5 neurons could be silenced after injections of muscimol (Figure S3D–E). Indeed, the optical activation of corticotectal projections from L5 alone resulted in a transient reduction of running speed, with the resulting MI (0.71 ± 0.15, mean ± SD, n =12) similar to that induced by flash stimulation (p > 0.05, t test) (Figure 3F, 3G). As mentioned above, the corticotectal projections mainly terminated in the superficial layer of SC (Figure 2I, 3E). We next examined whether SC neurons indeed received cortical input directly. In brain slices prepared from Rpb4-Cre mice injected with AAV-DIO-ChR2-EYFP in the V1, we performed whole-cell voltage-clamp recordings from SC neurons in the superficial (SL), intermediate (IL) and deep (DL) layers, while applied wide-field LED illumination to activate ChR2-expressing corticotectal axons. The slices were bathed in 1 μM TTX and 1 mM 4-AP so that only monosynaptic responses could be recorded (Cruikshank et al., 2010; Petreanu et al., 2009). We found that SC neurons in the SL and IL but not DL received direct excitatory input from the corticotectal axons (Figure 3H). In addition, the input to SL neurons was much stronger than that to IL neurons (Figure 3H). Based on these results, we next tested whether the SL of SC mediated the arrest behavior downstream of corticotectal projections. We injected AAV-CaMKIIα-ChR2-EYFP into the SL of SC to express ChR2 in principal neurons (Figure 3I). Blue LED illumination applied to the surface of SC induced a reduction of running speed, with the resulting MI (0.78 ± 0.13, mean ± SD, n = 12) comparable to that under flash stimulation (p > 0.05, t test) (Figure 3J, 3K). Since the SL of SC also receives direct retinal input (Sanes and Zipursky, 2010), our results suggest that this layer can integrate visual information from the retina and the cortex to generate visually induced behaviors. Figure 3I summarizes the magnitudes of behavioral responses under different experimental conditions.
Neuronal correlates of behavior in L5 and SC
To understand neuronal correlates of the behavior, we carried out loose-patch recordings in the L5 of V1 and SL of SC in wild-type animals, while applying flashes of different durations and intensities. As shown in Figure 4A, a typical L5 neuron exhibited a distinct onset response, which appeared not much affected by shorting the flash duration from 1 s to 1.6 ms. Quantification of firing rates within a 100-ms window beginning from the onset of spiking response to flash indicated that the amplitude of the onset response remained roughly the same across testing flash durations (Figure 4B, solid symbol). Similarly, a typical SC neuron also exhibited an easily identifiable onset response (Figure 4C), with its amplitude staying the same across testing flash durations (Figure 4D, upper panel). These results well explain why the magnitude of the behavioral response is not exceptionally sensitive to flash duration, and highlight the remarkable sensitivity of the visual system to detect a stimulus as long as its strength reaches a threshold. In addition, the SC-neuron responses were reduced by a similar factor across different stimuli after V1 was silenced by muscimol (Figure 4D, bottom panel), which is consistent with the idea that cortical input mainly exerts a gain control function (Zhao et al., 2014). Different from the results with varying flash durations, we found that the onset responses of both L5 and SC neurons were much more sensitive to the intensity of flash. The amplitude of the onset response increased with increasing intensities, and became saturated at moderately high intensities (Figure 4E–H). These neuronal responses agreed well with the behavioral data (Figure 1J, K).
Figure 4. Characterization of neuronal responses in L5 and SC.
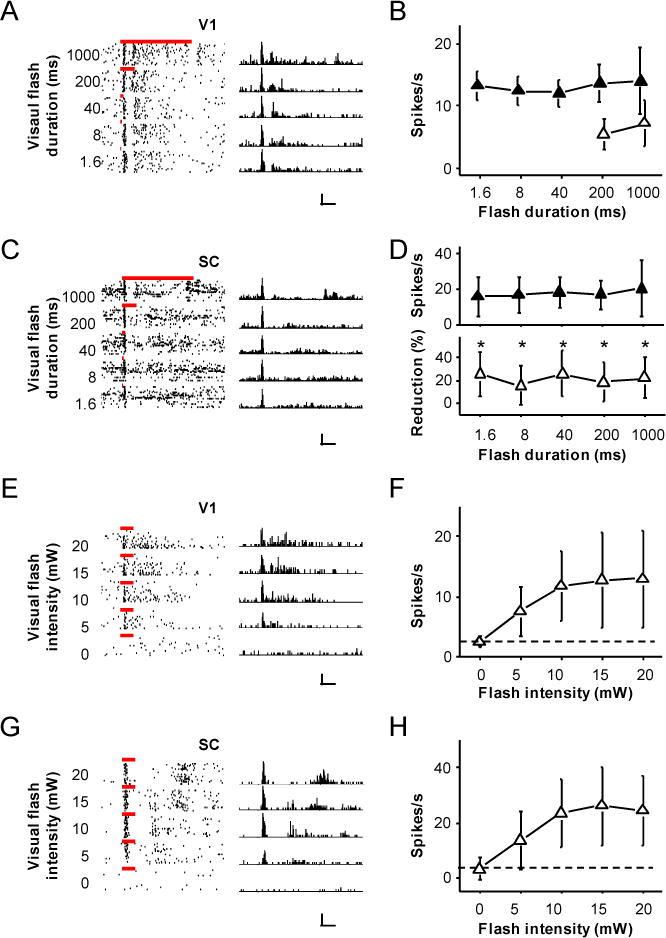
(A) Spike responses of a V1 L5 neuron to flash stimulation of different durations. Left, raster plots. Bars mark the duration of flash. Right, corresponding PSTHs (bin size = 10 ms). Scale: 70 Hz, 250 ms.
(B) Summary of firing rates at different durations (n = 11 V1 L5 neurons). Solid symbol, firing rate was measured within a 100 ms window after the onset of response. Open symbol, firing rate was measured within a time window equivalent to the length of stimulus duration after the onset of response. Bar = SD.
(C) Responses of a SC neuron to flash stimulation of different durations. Scale: 150 Hz, 250 ms.
(D) Upper panel, summary of firing rates at different durations (n = 11 SC neurons). Firing rate was measured within a 100 ms window after the onset of response. Lower panel, average percentage reduction of firing rates of SC neurons after silencing the V1 (n = 11). Bar = SD. *, p < 0.05, paired t-test.
(E) Responses of a V1 L5 neuron to flash stimulation of different intensities (duration = 200 ms). Scale: 50 Hz, 250 ms.
(F) Summary of firing rates at different intensities (n = 10 V1 cells). Dash line indicates spontaneous spike rate.
(G) Responses of a SC neuron to flash stimulation of different intensities. Scale: 60 Hz, 250 ms.
(F) Summary of firing rates at different intensities (n = 14 SC cells).
To further understand neural correlates of the optogenetically induced behavior, we identified corticofugal L5 neurons by searching for their spiking responses to LED illumination, using Rpb4-Cre mice injected with AAV-DIO-ChR2-EYFP and the same stimulation pattern in the aforementioned experiments. As shown by a typical L5 neuron (Figure 5A), spiking responses were reliably elicited by each 50-ms pulse of LED light. Firing rates were quickly reduced with decreasing LED intensities, and no evoked response was observed at zero intensity (Figure 5A–B). The response-intensity curve was largely consistent with the behavioral data when LED intensity was modulated (Figure 5C). Since both V1 and SC neurons exhibited transient onset responses which explained behaviors, we reasoned that just one pulse of LED light might be sufficient to simulate the flash-induced responses. Indeed, one pulse of LED light elicited a transient spike response of 19 ± 8 Hz in V1 neurons (Figure 5D), comparable to their onset responses evoked by flash stimulation (Figure 4B, solid symbol). Interestingly, just one pulse of LED light evoked an arrest behavior of a similar magnitude as that evoked by a train of LED pulses (Figure 5D). This raises an interesting possibility that the magnitude of the behavioral response may be determined critically by the transient spike rate increase close to the stimulus onset.
Figure 5. Characterization of V1 responses to LED stimulation.
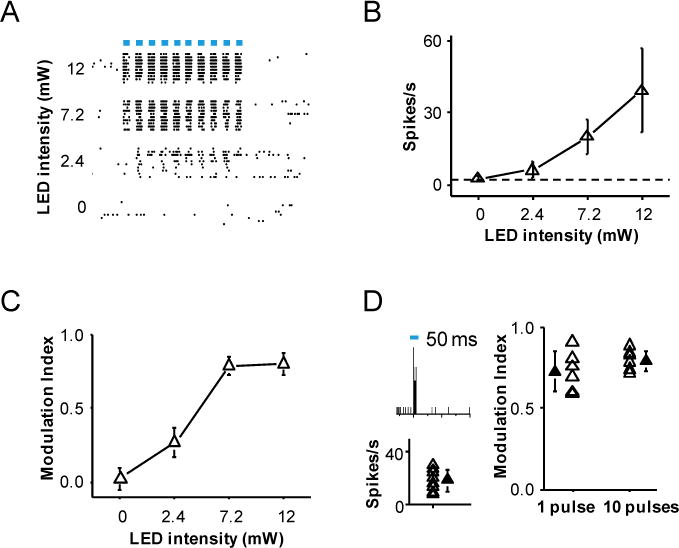
(A) Raster plots of spike responses of a ChR2-expressing L5 neuron (Rpb4-Cre) to a train of LED pulses (10 pulses at 10 Hz) at different intensity levels. Bar labels the duration of each LED pulse (50 ms).
(B) Summary of firing rates at different intensity levels of LED stimulation (n = 17 V1 L5 neurons). Firing rate was measured within the entire time window for the LED train.
(C) MIs measured at different LED intensity levels. Data points for the same animal are connected by lines. N = 7 animals.
(D) Left panel, PSTH for spikes of a L5 neuron to one pulse (50 ms) of LED stimulation (top, intensity = 7.2 mW), and summary spike rates of 9 L5 neurons (bottom). Right panel, comparison of MIs measured at one pulse (n = 6) vs. 10 pulses (n = 7) of LED stimulation. Each open symbol represents one animal. Solid symbol represents mean ± SD.
Functional specificity of V1 corticofugal projections
The corticofugal projections from L5 of V1 terminate not only in the SC, but also in the lateral posterior thalamic nucleus (LP) and dorsomedial striatum, as revealed by the anterograde tracing of EYFP-labeled L5 axons (Figure 6A). This observation is consistent with previous anatomical studies (Feng et al., 2000; Larsen et al., 2007; Sugino et al., 2006). To understand how much V1 neurons projecting to different target regions might overlap, we injected retrograde tracers of different colors into the SC, LP and dorsomedial striatum respectively (Figure 6B). We found that V1 neurons targeting the three different regions exhibited little overlap. In general, only about 2.5% of labeled corticofugal neurons targeted more than one region (Figure 6C). In addition, neurons targeting different regions exhibited differential laminar distribution patterns (Figure 6B). The striatum-projecting neurons were located in L5 and upper L2/3, the LP-projecting neurons were in L5 and deep L6, and the SC-projecting neurons were in L5 only. While these projection patterns suggest segregated corticofugal outputs, we further examined potential involvements of the projections to the LP and striatum in the arrest behavior. In brain slices prepared from Rbp4-Cre mice injected with AAV-DIO-ChR2-EYFP in the V1, we performed whole-cell recordings while illuminating corticofugal axons in the LP and striatal regions respectively (Figure 6D, 6H). The recordings confirmed that LP as well as dorsomedial striatal neurons received direct excitatory input from corticofugal axons (Figure 6E, 6I). In the head-fixed animals, we implanted an optic fiber to illuminate the LP or dorsomedial striatum respectively, while silenced the V1 with muscimol (Figure 6D, 6H). The optical activation of corticofugal projections in none of these areas induced an obvious change in running speed, although the animals were able to respond to flash stimulation normally (Figure 4F, 4G, 4J, 4K). Together, our data indicate that L5 corticofugal projections to the LP and striatum are unlikely to account for the light-induced arrest behavior. These results support a concept that L5 corticofugal neurons are segregated into different subpopulations depending on their targets, which may be specialized for distinct functions.
Figure 6. Corticofugal projections to other targets are unlikely account for the arrest behavior.
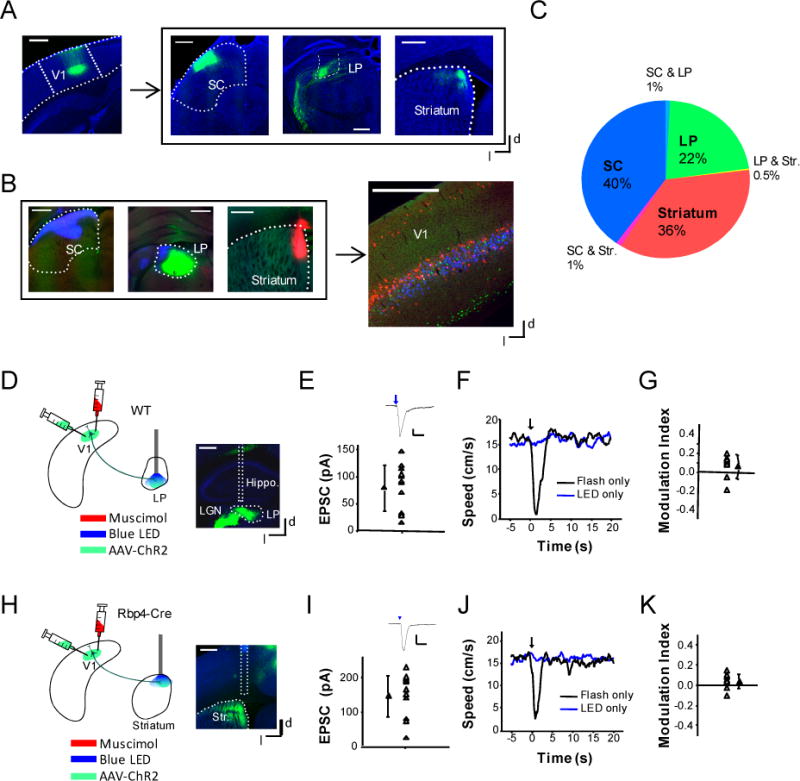
(A) Left, image of ChR2-EYFP expressing neurons in the V1 of a Rbp4-Cre mouse. Right, fluorescence labeled corticofugal axons in the SC, LP, and striatum (outlined) respectively. Scale: 500 μm.
(B) Retrograde tracing of corticofugal neurons. Left, retrograde tracers of blue, green and red colors were injected into the superficial SC, LP and dorsomedial striatum respectively. Right, distribution of labeled neurons in the V1. Scale: 500 μm.
(C) Quantification of overlap between corticofugal neurons projecting to different targets. Neuron numbers were normalized to the total number of labeled corticofugal neurons.
(D) Experimental condition for head-fixed animals: AAV-ChR2 was injected into the V1 of wildtype mice. Weeks later, blue LED light was applied to the LP via an implanted optic fiber and the V1 was silenced by muscimol. Right, image showing the track of the implanted optic fiber. Scale: 500 μm. Hippo., hippocampus.
(E) Average monosynaptic EPSC amplitudes recorded from 12 LP neurons (in 5 slices) in response to a blue LED pulse (20 ms duration). Bar = s.d. Top inset, average EPSC trace of an example neurons. Arrow marks the onset of LED pulse. Scale: 20 pA, 50 ms.
(F) Average speed trace of an example animal under flash only (black) or LED illumination of the LP only (blue).
(G) Summary of modulation indices under LED illumination of the LP. There is no significant difference from zero (p > 0.05, one-sample t-test, n = 8 sessions from 4 animals).
(H) LED illumination was applied to the dorsomedial striatum (str.). Right, image showing the track of the implanted optic fiber. Scale: 500 μm.
(I) Average monosynaptic EPSC amplitudes recorded from 15 dorsomedial striatal neurons (in 5 slices) in response to optical stimulation of corticofugal axons in the striatum. Scale for top inset: 50 pA, 50 ms.
(J) Average speed trace of an example animal in response to flash only (black) and to LED illumination of the striatum only (blue).
(K) Summary of modulation indices under LED illumination. There is no significant difference from zero (p > 0.05, one-sample t-test, n = 9 sessions from 4 animals).
Discussion
In this study, we developed a head-fixed preparation to investigate neural pathways underlying sensory-evoked innate behaviors. We found that upon a sudden flash of light as short as milliseconds, a running mouse transiently suspended locomotion. This behavior is likely related to, or is a component of defense responses to aversive stimuli, as bright light signals potential dangers to rodents and suspension of locomotion allows the animals to have a better investigation of its surroundings. It is also possible that the behavior reflects a change of attention, as it has been reported previously that the SC can be involved in shifting attention without any overt movements (Kustov and Robinson, 1996). The animal resumes running while the light is still on, probably because no tangible danger occurs. The arrest behavior depends critically on the normal activity of SC. By reversible optogenetic inactivation, we demonstrated that V1 activity increases the magnitude of the behavioral response via its corticotectal projections to the SC, by (at least partially) enhancing the SC-neuron responses to the visual stimulus that evokes the behavior. More importantly, optogenetic activation of V1 L5 neurons, their corticotectal axons in the SC, or SC neurons receiving corticotectal inputs directly triggers the behavior, confirming the roles of these neural substrates in its production.
In a previous open-field study, it has been found that the onset of bright light temporarily increases locomotion of rats (Godsil and Fanselow, 2004). Here we showed that bright light temporarily reduces locomotion of mice. Several factors may contribute to the discrepancy of the results. First, the speed recording in our experiment was in real time and had a high temporal resolution, while in the previous study the behaviors were manually scored with time scales of minutes, which may fail to detect transient changes in behavior. Second, we used relatively brief flashes of light, while in the previous study light was on for minutes. It is possible that extended light exposure would eventually increase locomotion. Third, we tested behaviors of running animals while in the previous study the initial behavioral state was not selected. In animals with initial non-running states, we did observe that light flashes resulted running in a small percentage of trials (Figure S1B–C). The temporary arrest behavior observed in this study also appears different from the looming-evoked freezing behavior. In freezing the animal stands completely motionless as long as the looming stimulus is still present (Yilmaz and Meister, 2013), whereas in the temporary arrest behavior the animal may not be completely motionless (see the Supplementary Video), and motion quickly recovers. It is likely that looming signals a much higher level of danger than a flash of light, and that freezing represents a much stronger fear response than the transient arrest of motion. Interestingly, a similar arrest behavior was also observed when a decrement of light was applied (Figure S1D–E), suggesting that the animal is highly sensitive to sudden changes of its visual environment.
The SC is generally thought as a sensory-motor center (Gandhi and Katnani, 2011). It plays a prominent role in a variety of visually guided orientation as well as defensive behaviors (Gandhi and Katnani, 2011; McHaffie et al., 2005; Schenberg et al., 2005). Consistent with this notion, we found that SC activity can largely account for the light-evoked arrest behavior. SC neurons respond robustly to the visual stimulus that evokes the behavior, and the sensitivity of SC-neuron responses to physical features of the stimulus is in accordance with that of the behavioral response. Most importantly, silencing SC neuron spiking essentially eliminates the behavior. While the finding that SC mediates the visually induced behavior is not surprising, it would be interesting to identify the structures downstream of SC producing the behavior in future studies.
By optogenetically silencing the V1, we demonstrated that V1 activity contributes to about 1/3 of the behavioral response evoked by flash stimulation (Figure 2H). On the other hand, photo-activation of the V1 alone evokes behavioral responses at a similar level as those evoked by sensory stimuli (Figure 3L). We noticed that the photo-simulation in our experiments elicited stronger V1 responses than the sensory stimulus (30 Hz versus 8 Hz, compare Figure 5B and Figure 4B open symbol). This may explain the different levels of V1 contribution to the behavioral response. Indeed, by reducing the intensity of LED light, we did observe a smaller behavioral response to the activation of V1 alone (Figure 5C). It is worth noting that V1 is not the only source of corticotectal inputs to the SC, as secondary visual cortical areas also project axons to the SC, which mainly terminate in its intermediate layer. Thus the total cortical contribution to the behavior is likely higher than what is estimated by silencing the V1. There are at least seven extrastriate areas in the mouse visual cortex (Marshel et al., 2011; Andermann et al., 2011; Wang et al., 2011; Polack et al., 2012). To delineate the contribution of each of these areas to the behavior will be an interesting topic for future studies.
A number of previous studies have investigated the impact of cortical inputs on SC responses to visual stimuli (Hoffmann and Straschill, 1971; Ogasawara et al., 1984; Rosenquist and Palmer, 1971; Wang et al., 2010; Wickelgren and Sterling, 1969), with some reporting facilitating or suppressive effects, others reporting no effect. In the cat, Sprague and colleagues reported that following unilateral ablation of the entire visual cortex the animal ignores the visual stimuli on the affected visual field (Sprague, 1966). But the visual deficit is alleviated after blocking inputs to the SC from the contralateral SC or other structures (Ciaramitaro et al., 1997; Durmer and Rosenquist, 2001; Sprague, 1966; Wallace et al., 1989). This raises an interesting hypothesis that the cortex may provide excitatory input to the SC to counterbalance inhibition from the contralateral SC or other sources (Sprague, 1966). More recently, a study in awake mice (Zhao et al., 2014) has shown that visual cortical input approximately doubles looming-evoked responses of SC neurons, and pointed out that the previous inconsistent results could be due to differences in anesthesia and method to remove cortical input (ablation versus acute silencing). Here in awake mice using a similar optogenetic silencing method, we found that responses of SC neurons to flash stimuli were reduced by on average 23% after silencing the V1. Although the reduction is smaller compared to Zhao et al. study, which may be due to different stimuli applied, our results support the notion that visual cortex strengthens SC responses by providing direct excitatory input via corticotectal projections, therefore enhances the SC-dependent behavioral output. In addition, our results are consistent with expected effects of shifting the balance between cortical excitation and inhibition from the contralateral SC or other sources, as proposed for the “Sprague effect”. Since the cortex is subject to profound regulation by animal’s internal state (Gentet et al., 2010; Niell and Stryker, 2010; Xu et al., 2012; Zhou et al., 2014), this cortex-SC interaction may provide a neural substrate for voluntary modulation of innate visual behaviors. Similar visual cortical modulation through corticotectal projections may also mediate looming-induced defense behaviors.
Surprisingly, the presumably modulatory corticofugal projection can be strong enough to directly drive the behavior by its activation alone. This finding highlights the likelihood that the primary sensory cortex can initiate motor behaviors through the same corticofugal projections that play a role in its modulating sensory induced behaviors. Considering that V1 itself receives projections from many higher cognitive areas, e.g. anterior cingulate and orbitofrontal cortex (Zhang et al., 2014; Zingg et al., 2014), it is possible that through top-down controls of the V1 and then midbrain sensory-motor centers, even in the absence of immediate threatening stimuli the animals are able to produce defense behaviors as to prepare for anticipated dangers. Taken together, our study reveals a previously unrecognized role of corticofugal systems in controlling innate defense-related behaviors. It remains to be investigated whether this role is general across different sensory systems.
Experimental Procedures
Head-fixed animal preparation
All experimental procedures used in this study were approved by the Animal Care and Use Committee at the University of Southern California. C57BL/6J mice aged 10–16 weeks were used in this study. Both male and female animals were used. Mice were housed with reversed light-dark cycles with light on from 9:00 PM to 9:00 AM. Flying saucer pet exercise wheels were placed in their home cages. One week before behavioral tests, mice were anesthetized with isoflurane (1.5% by volume) and a screw for head fixation was mounted on top of the skull with dental cement, as previously described (Olsen et al., 2012; Xiong et al., 2013; Zhou et al., 2014). Afterwards 0.1mg/kg buprenorphine was injected subcutaneously before they were returned to home cages. During the recovery period, the mice were trained to run on the recording plate for 3–4 days. The plate was flat and could rotate smoothly around its center. To fix the head, the head screw was tightly fit into a metal post. Only well-trained animals which spent most of time (>80%) running on the plate were used later for behavioral assays. One day before electrophysiological recordings or some behavioral tests that did not require implantation of cannula, the mouse was anesthetized with isoflurane and craniotomy was made over the V1 (2.6 mm, lateral to midline; 3.9 mm posterior to bregma), SC (0.8 mm, lateral to midline; 3.9 mm posterior to bregma), LP (1.37 mm, lateral to midline; 1.75 mm posterior to bregma), or dorsomedial Striatum (1.25 mm, lateral to midline; 0.5 mm anterior to bregma) region accordingly. The eyelid for the left eye was sutured. The following recordings and tests were all performed in a sound-attenuation booth (Acoustic Systems) during the dark cycle.
Behavioral tests in head-fixed animals
The animal was fixed via a metal post. The left eye was further patched by a piece of black tape. Each behavioral test session lasted for half an hour and contained usually 20–25 trials. Between sessions the animals were allowed to rest for at least half an hour. Each animal was tested for no more than 5 sessions each day. Each animal was tested for at least 20 trials for individual experimental conditions. The animals were given drops of 5% sucrose between sessions. During the test, the rotation speed of the plate was detected by an optical sensor and recorded in real time (Zhou et al., 2014). The behavior of the animal was also monitored with a video camera. The speed profile of the animal was aligned according to the onset of flash and averaged by trials. In the average speed profile, V0 and V2 were measured as the average speed within a 3-s window immediately before and 10 s after the onset of flash. To measure V1, the minimum speed was first identified within 2-s window after the onset of flash. V1 was calculated as the average speed within 0.5 s window centered on the time point for this minimum speed.
Behavioral test in freely moving animals
To test light-triggered behaviors in freely moving mice, two boxes connected by a tube were used. A white LED source was attached to one end of the tube. An infrared sensor was placed in the middle of the tube. A camera was used to record the location of the animal. The animal was placed in the box environment several hours before the behavioral test. During the test, when the animal was running through the tunnel, its passing the infrared sensor occasionally triggered turning on of a 1-s light flash in front of the animal. The location of the animal was analyzed offline, and its moving speed was calculated from video images. Each animal was tested for 5 trials, with inter-trial intervals varying between 5–15 min. V1 was calculated as the average speed within 0.5 s window centered on the time point for the minimum speed identified within 2- s window after the onset of flash. V0 and V2 were measured as the average speed within 1-s window immediately before flash and when speed appeared recovered.
In vivo recordings in awake animals
Loose-patch and multi-unit recordings were performed with patch pipettes, as previously described (Xiong et al., 2013; Zhou et al., 2014). For loose-patch recording, pipette was filled with an artificial cerebral spinal fluid (ACSF; 126 mM NaCl, 2.5 mM KCl, 1.25 mM Na2PO4, 26 mM NaHCO3, 1 mM MgCl2, 2 mM CaCl2, and 10 mM glucose). For multi-unit recording, pipette was filled with 1mM NaCl. Signals were recorded with an Axopatch 200B amplifier (Molecular Devices) under voltage-clamp mode. Signals were filtered with a 100–5,000 Hz band-pass filter. For recording from PV cells, we used glass pipettes with a relatively small tip opening (10 MΩ) which increased chances of encountering inhibitory neurons. PV cells expressing ChR2 were searched and identified based on their responses to blue LED stimulation. Pyramidal neurons in L5 were blindly recorded with pipettes of a larger tip opening (4 MΩ). We have shown previously that this pipette parameter would result in biased sampling almost exclusively from pyramidal neurons (Wu et al., 2008). L5 cells expressing ChR2 were searched and identified based on their responses to blue LED stimulation. The depth of the recording was determined based on the pipette travel distance from the pia, and was confirmed in a few cases with histology.
Viral injection
Viral injections were performed as we previously described (Li et al., 2013a; Li et al., 2013b). Adult Rbp4-Cre (MMRRC), Pvalb-Cre × Ai14 tdTomato reporter (The Jackson Laboratory) and wild type C57BL/6J (The Jackson Laboratory) mice were anesthetized with 1.5% isoflurane. A small cut was made on the skin covering the left V1 or SC. A ~0.2 mm craniotomy was made over the V1 (2.6 mm, lateral to midline; 3.9 mm posterior to bregma; 0.6 mm down from pia) or SC (0.8 mm, lateral to midline; 3.9 mm posterior to bregma; 1.4 mm down from pia) region. The following adeno-associated viral (AAV) vectors encoding ChR2, ArchT or GFP were used depending on the purpose of experiments and strain of mice: AAV1.CaMKIIa.hChR2(H134R)-eYFP.WPRE.hGH (UPenn vector core, Addgene 26969), AAV9.EF1α.DIO.hChR2(H134R)-EYFP.WPRE.hGH (UPenn vector core, Addgene 20298), AAV1-CAG-FLEX-ArchT-GFP (UNC vector core, Addgene 28307) and AAV1.CamKII0.4.eGFP.WPRE.rBG (UPenn vector core). Viral solution was delivered using a beveled glass micropipette (tip diameter: ~40 μm) attached to a microsyringe pump (World Precision Instruments). For each injection, 100 nl of viral solution was injected at a rate of 20 nl/min. Right after each injection, the pipette was allowed to rest for 4 minutes before withdrawal. The scalp was then sutured. Following the surgery, 0.1mg/kg buprenorphine was injected subcutaneously before returning the animals back to their home cages. Mice were allowed to recover for at least 3 weeks.
Retrograde tracer injection and imaging
For retrograde tracer injections into the SC, LP (1.37 mm, lateral to midline; 1.75 mm posterior to bregma; 2.75 mm down from pia) and dorsomedial striatum (1.25 mm, lateral to midline; 0.5 mm posterior to bregma; 2.2 mm down from pia), 80 nl of fluorescently conjugated Cholera Toxin subunit B (CTb 488, 555 or 647, 0.25%; Invitrogen) was injected into each location respectively through a pulled glass micropipette using the pressure injection method (Zingg et al., 2014). After 5–7 days, the animal was deeply anesthetized and transcardially perfused with 4% paraformaldehyde. Brain tissue was sliced into 150 μm sections using a vibratome and sections were mounted onto glass slides and imaged using a confocal microscope (Olympus).
Flash and LED stimulation
Software for the control of flash, LED stimulation and data acquisition was custom-developed in LabVIEW (National Instruments). For behavioral tests of varying flash intensities, white light from a LED source at five intensities (0–20 mW, spaced at 5 mW) was delivered pseudo-randomly. In all other experiments, flash intensity was fixed at 10 mW. Only when the inter-stimulus interval (ISI) became ≥ 1 min and the animal ran at a speed of > 10 cm/s for at least two seconds, a trigger signal for flash was given. Flash stimulation was repeated for at least 20 trials to generate an average time-dependent speed profile.
To activate ChR2, a 1-s (or 0.2-s) long train of blue (470 nm) LED light pulses (pulse duration = 50 ms or 20 ms, at 10 Hz or 25 Hz) was delivered. For behavioral tests with varying LED intensities, LED light at four intensities (0, 2.4, 7.2, 12 mW, measured at the tip of the optic fiber) was delivered pseudo-randomly. In all other experiments, LED intensity was fixed 12 mW. To activate ArchT, a 1-s (or 0.2-s) long green (530 nm) LED pulse (12 mV) was delivered. The trials with flash stimulation only and with flash plus LED stimulation were interleaved.
To activate PV neurons or L5 neurons in the V1, an optic fiber (400 μm, Thorlabs) connecting to a LED source (470 nm, Thorlabs) was positioned close to the surface of V1. The tip of the optic fiber was covered first by clear agar and then by thick agar stained with black pigments to prevent light leakage. To stimulate deeper structures such as the SC, LP and striatum, an optic fiber patch cord (400 μm Core, 0.39 NA, Thorlabs) connecting the LED light source to the implanted cannula was secured by a hard plastic sleeve (Thorlabs). The implantation was made in the mouse anesthetized with isoflurane (1.5%) and mounted to the head-fix apparatus. A craniotomy over the target area (SC, LP and striatum) was made. The cannula was lowered with a motion controller (Siskiyou) to the desired depth (SCSL: 800 μm; LP: 2400 μm; striatum: 1750 μm) according to the coordinates in mouse brain atlas. The cannula was then secured on the skull by dental cement. All implants were made in the left hemisphere. For SC stimulation, since the part of SC under study (medial SC) was overlaid largely by the retrosplenial cortex, there was little damage to the visual cortex, especially V1. However, potential damage to the retrosplenial cortex could not be excluded. The animal was allowed to rest for at least 2 days before behavioral test sessions. After each experiment, the brain was sectioned and imaged with a fluorescence microscope to confirm the expression of ChR2-EYFP or ArchT-GFP.
Silencing of brain structures
We used two methods. In the first method, fluorescent muscimol (1.5 mM, Life Technologies), an agonist of GABAA receptors, was used to silence a targeted brain region (Liu et al., 2007). The fluorescent muscimol solution (0.5 mM in ACSF with 5% DMSO) was injected via a glass micropipette with a tip opening of about 2 μm in diameter. To silence the V1, the pipette was inserted to a depth of 400 μm below the cortical surface. For SC silencing, the pipette was inserted to a depth of 1400 μm. Solutions were injected under a pressure of 2–3 psi for 5 min. The injected volume was estimated to be around 100–150 nl, as measured in mineral oil. The spread of muscimol (Allen et al., 2008) could be precisely measured by fluorescence imaging. One hour after the injection, the animal was transcardially perfused with 4% paraformaldehyde in phosphate-buffered saline (PFA). 100-μm coronal brain sections were made with a vibratome (Leica Microsystems) and imaged under a confocal microscope (Olympus). For optogenetic silencing, AAV9.EF1α.DIO.hChR2(H134R)-EYFP.WPRE.hGH was injected into the V1 of Pvalb-Cre × Ai14 mice. Although the primary visual cortical region was targeted, viral infection was often observed in the regions surrounding the V1 as well. In each animal, injections were made in 2 sites at 2 depths (300, 600 μm below the surface). After a recovery period, blue LED light was applied to cortical surface to activate PV neurons, which in turn silenced the cortical excitatory neurons (Li et al., 2013a; Li et al., 2013b).
Slice preparation and recording
Acute brain slices were prepared from viral injected mice after behavioral tests. Following the urethane anesthesia, the animal was decapitated and the brain was rapidly removed and immersed in an ice-cold dissection buffer (composition: 60 mM NaCl, 3mM KCl, 1.25 mM NaH2PO4, 25 mM NaHCO3, 115 mM sucrose, 10 mM glucose, 7 mM MgCl2, 0.5 mM CaCl2; bubbled with 95% O2 and 5% CO2; pH= 7.4). Brain slices of 350 μm thickness containing the SC, LP or striatal regions were cut in a coronal plane using a vibrating microtome (Leica VT1000s). Slices were allowed to recover for 30 min in a submersion chamber filled with warmed (35 °C) ACSF and then to cool gradually to the room temperature until recording. Cells were visualized with IR-DIC microscopy (Olympus BX51 WI). Patch pipettes (Kimax) with ~4–5 MΩ impedance were used for whole-cell recordings. Recording pipettes contained: 130 mM K-gluconate, 4 mM KCl, 2 mM NaCl, 10 mM HEPES, 0.2 mM EGTA, 4 mM ATP, 0.3 mM GTP, and 14 mM phosphocreatine (pH, 7.25; 290 mOsm). Signals were recorded with an Axopatch 200B amplifier (Molecular Devices) under voltage clamp mode (clamping potential = −70 mV), filtered at 2 kHz and sampled at 10 kHz. 1 μM TTX and 1 mM 4-aminopyridine (4-AP) was added to the external solution in order to block polysynaptic responses (Cruikshank et al., 2010; Petreanu et al., 2009). For optic activation of ChR2, a mercury Arc lamp was used as the light source. The light was collimated and coupled to the microscope’s epifluorescence pathway, and was passed through a blue filter. A calibrated aperture placed at the conjugated focal plane of the imaged slice was used to control the size of the illumination area, which covered the entire region of interest. A pulse of blue light (5 ms duration) was delivered through an electronic shutter (Vincent Associates).
Supplementary Material
Highlights.
Flash light induces a transient suspension of locomotion in running mice
The arrest of locomotion is critically dependent on superior colliculus (SC) activity
V1 enhances the arrest behavior and SC responses via corticotectal projections
V1 directly drives the behavior via activation of corticotectal projections to the SC
Acknowledgments
This work was supported by the National Eye Institute at the National Institutes of Health (RO1 EY019049 and R21 EY022478 to H.W.T.) and the Kirchgessner Foundation. L.I.Z. was supported by the National Institute of Health (RO1 DC008983) and the David and Lucile Packard Foundation. B.Z. was supported by a NIH training grant T32DC009975 (to SW Bottjier and N Segil).
Footnotes
Publisher's Disclaimer: This is a PDF file of an unedited manuscript that has been accepted for publication. As a service to our customers we are providing this early version of the manuscript. The manuscript will undergo copyediting, typesetting, and review of the resulting proof before it is published in its final citable form. Please note that during the production process errors may be discovered which could affect the content, and all legal disclaimers that apply to the journal pertain.
Author contributions
H.W.T. and L.I.Z. conceived and designed experiments. F.L. and X.R.X performed the behavioral experiments and all the data analysis. B.Z. performed neural tracing and anatomical experiments. X.Y.J. performed slice recording experiments and data analysis. H.W.T. and L.I.Z. wrote the manuscript.
References
- Allen TA, Narayanan NS, Kholodar-Smith DB, Zhao Y, Laubach M, Brown TH. Imaging the spread of reversible brain inactivations using fluorescent muscimol. Journal of neuroscience methods. 2008;171:30–38. doi: 10.1016/j.jneumeth.2008.01.033. [DOI] [PMC free article] [PubMed] [Google Scholar]
- Andermann ML, Kerlin AM, Roumis DK, Glickfeld LL, Reid RC. Functional specialization of mouse higher visual cortical areas. Neuron. 2011;72:1025–1039. doi: 10.1016/j.neuron.2011.11.013. [DOI] [PMC free article] [PubMed] [Google Scholar]
- Bordi F, LeDoux J. Sensory tuning beyond the sensory system: an initial analysis of auditory response properties of neurons in the lateral amygdaloid nucleus and overlying areas of the striatum. The Journal of neuroscience: the official journal of the Society for Neuroscience. 1992;12:2493–2503. doi: 10.1523/JNEUROSCI.12-07-02493.1992. [DOI] [PMC free article] [PubMed] [Google Scholar]
- Brandao ML, Borelli KG, Nobre MJ, Santos JM, Albrechet-Souza L, Oliveira AR, Martinez RC. Gabaergic regulation of the neural organization of fear in the midbrain tectum. Neuroscience and biobehavioral reviews. 2005;29:1299–1311. doi: 10.1016/j.neubiorev.2005.04.013. [DOI] [PubMed] [Google Scholar]
- Ciaramitaro VM, Todd WE, Rosenquist AC. Disinhibition of the superior colliculus restores orienting to visual stimuli in the hemianopic field of the cat. The Journal of comparative neurology. 1997;387:568–587. doi: 10.1002/(sici)1096-9861(19971103)387:4<568::aid-cne7>3.0.co;2-0. [DOI] [PubMed] [Google Scholar]
- Comoli E, Das Neves Favaro P, Vautrelle N, Leriche M, Overton PG, Redgrave P. Segregated anatomical input to sub-regions of the rodent superior colliculus associated with approach and defense. Frontiers in neuroanatomy. 2012;6:9. doi: 10.3389/fnana.2012.00009. [DOI] [PMC free article] [PubMed] [Google Scholar]
- Cruikshank SJ, Urabe H, Nurmikko AV, Connors BW. Pathway-specific feedforward circuits between thalamus and neocortex revealed by selective optical stimulation of axons. Neuron. 2010;65:230–245. doi: 10.1016/j.neuron.2009.12.025. [DOI] [PMC free article] [PubMed] [Google Scholar]
- Dhande OS, Huberman AD. Retinal ganglion cell maps in the brain: implications for visual processing. Current opinion in neurobiology. 2014;24:133–142. doi: 10.1016/j.conb.2013.08.006. [DOI] [PMC free article] [PubMed] [Google Scholar]
- Durmer JS, Rosenquist AC. Ibotenic acid lesions in the pedunculopontine region result in recovery of visual orienting in the hemianopic cat. Neuroscience. 2001;106:765–781. doi: 10.1016/s0306-4522(01)00321-9. [DOI] [PubMed] [Google Scholar]
- Feng G, Mellor RH, Bernstein M, Keller-Peck C, Nguyen QT, Wallace M, Nerbonne JM, Lichtman JW, Sanes JR. Imaging neuronal subsets in transgenic mice expressing multiple spectral variants of GFP. Neuron. 2000;28:41–51. doi: 10.1016/s0896-6273(00)00084-2. [DOI] [PubMed] [Google Scholar]
- Fenno L, Yizhar O, Deisseroth K. The development and application of optogenetics. Annual review of neuroscience. 2011;34:389–412. doi: 10.1146/annurev-neuro-061010-113817. [DOI] [PMC free article] [PubMed] [Google Scholar]
- Gandhi NJ, Katnani HA. Motor functions of the superior colliculus. Annual review of neuroscience. 2011;34:205–231. doi: 10.1146/annurev-neuro-061010-113728. [DOI] [PMC free article] [PubMed] [Google Scholar]
- Gentet LJ, Avermann M, Matyas F, Staiger JF, Petersen CC. Membrane potential dynamics of GABAergic neurons in the barrel cortex of behaving mice. Neuron. 2010;65:422–435. doi: 10.1016/j.neuron.2010.01.006. [DOI] [PubMed] [Google Scholar]
- Godsil BP, Fanselow MS. Light stimulus change evokes an activity response in the rat. Learning & behavior. 2004;32:299–310. doi: 10.3758/bf03196029. [DOI] [PubMed] [Google Scholar]
- Harting JK, Updyke BV, Van Lieshout DP. Corticotectal projections in the cat: anterograde transport studies of twenty-five cortical areas. The Journal of comparative neurology. 1992;324:379–414. doi: 10.1002/cne.903240308. [DOI] [PubMed] [Google Scholar]
- Harvey AR, Worthington DR. The projection from different visual cortical areas to the rat superior colliculus. The Journal of comparative neurology. 1990;298:281–292. doi: 10.1002/cne.902980303. [DOI] [PubMed] [Google Scholar]
- Hoffmann KP, Straschill M. Influences of cortico-tectal and intertectal connections on visual responses in the cat’s superior colliculus. Experimental brain research. 1971;12:120–131. doi: 10.1007/BF00234310. [DOI] [PubMed] [Google Scholar]
- Kustov A, Robinson D. Shared neural control of attentional shifts and eye movements. Nature. 1996;384:74–77. doi: 10.1038/384074a0. [DOI] [PubMed] [Google Scholar]
- Larsen DD, Wickersham IR, Callaway EM. Retrograde tracing with recombinant rabies virus reveals correlations between projection targets and dendritic architecture in layer 5 of mouse barrel cortex. Frontiers in neural circuits. 2007;1:5. doi: 10.3389/neuro.04.005.2007. [DOI] [PMC free article] [PubMed] [Google Scholar]
- LeDoux J. Rethinking the emotional brain. Neuron. 2012;73:653–676. doi: 10.1016/j.neuron.2012.02.004. [DOI] [PMC free article] [PubMed] [Google Scholar]
- Lemke G, Reber M. Retinotectal mapping: new insights from molecular genetics. Annual review of cell and developmental biology. 2005;21:551–580. doi: 10.1146/annurev.cellbio.20.022403.093702. [DOI] [PubMed] [Google Scholar]
- Li LY, Li YT, Zhou M, Tao HW, Zhang LI. Intracortical multiplication of thalamocortical signals in mouse auditory cortex. Nature neuroscience. 2013a;16:1179–1181. doi: 10.1038/nn.3493. [DOI] [PMC free article] [PubMed] [Google Scholar]
- Li YT, Ibrahim LA, Liu BH, Zhang LI, Tao HW. Linear transformation of thalamocortical input by intracortical excitation. Nature neuroscience. 2013b;16:1324–1330. doi: 10.1038/nn.3494. [DOI] [PMC free article] [PubMed] [Google Scholar]
- Lien AD, Scanziani M. Tuned thalamic excitation is amplified by visual cortical circuits. Nature neuroscience. 2013;16:1315–1323. doi: 10.1038/nn.3488. [DOI] [PMC free article] [PubMed] [Google Scholar]
- Liu BH, Wu GK, Arbuckle R, Tao HW, Zhang LI. Defining cortical frequency tuning with recurrent excitatory circuitry. Nature neuroscience. 2007;10:1594–1600. doi: 10.1038/nn2012. [DOI] [PMC free article] [PubMed] [Google Scholar]
- Madisen L, Mao T, Koch H, Zhuo JM, Berenyi A, Fujisawa S, Hsu YW, Garcia AJ, 3rd, Gu X, Zanella S, et al. A toolbox of Cre-dependent optogenetic transgenic mice for light-induced activation and silencing. Nature neuroscience. 2012;15:793–802. doi: 10.1038/nn.3078. [DOI] [PMC free article] [PubMed] [Google Scholar]
- Marshel JH, Garrett ME, Nauhaus I, Callaway EM. Functional specialization of seven mouse visual cortical areas. Neuron. 2011;72:1040–1054. doi: 10.1016/j.neuron.2011.12.004. [DOI] [PMC free article] [PubMed] [Google Scholar]
- McHaffie JG, Norita M, Dunning DD, Stein BE. Corticotectal relationships: direct and “indirect” corticotectal pathways. Progress in brain research. 1993;95:139–150. [PubMed] [Google Scholar]
- McHaffie JG, Stanford TR, Stein BE, Coizet V, Redgrave P. Subcortical loops through the basal ganglia. Trends in neurosciences. 2005;28:401–407. doi: 10.1016/j.tins.2005.06.006. [DOI] [PubMed] [Google Scholar]
- Motta SC, Goto M, Gouveia FV, Baldo MV, Canteras NS, Swanson LW. Dissecting the brain’s fear system reveals the hypothalamus is critical for responding in subordinate conspecific intruders. Proceedings of the National Academy of Sciences of the United States of America. 2009;106:4870–4875. doi: 10.1073/pnas.0900939106. [DOI] [PMC free article] [PubMed] [Google Scholar]
- Niell CM, Stryker MP. Modulation of visual responses by behavioral state in mouse visual cortex. Neuron. 2010;65:472–479. doi: 10.1016/j.neuron.2010.01.033. [DOI] [PMC free article] [PubMed] [Google Scholar]
- Ogasawara K, McHaffie JG, Stein BE. Two visual corticotectal systems in cat. Journal of neurophysiology. 1984;52:1226–1245. doi: 10.1152/jn.1984.52.6.1226. [DOI] [PubMed] [Google Scholar]
- Oh SW, Harris JA, Ng L, Winslow B, Cain N, Mihalas S, Wang Q, Lau C, Kuan L, Henry AM, et al. A mesoscale connectome of the mouse brain. Nature. 2014;508:207–214. doi: 10.1038/nature13186. [DOI] [PMC free article] [PubMed] [Google Scholar]
- Petreanu L, Mao T, Sternson SM, Svoboda K. The subcellular organization of neocortical excitatory connections. Nature. 2009;457:1142–1145. doi: 10.1038/nature07709. [DOI] [PMC free article] [PubMed] [Google Scholar]
- Polack PO, Contreras D. Long-range parallel processing and local recurrent activity in the visual cortex of the mouse. The Journal of neuroscience: the official journal of the Society for Neuroscience. 2012;32:11120–11131. doi: 10.1523/JNEUROSCI.6304-11.2012. [DOI] [PMC free article] [PubMed] [Google Scholar]
- Rosenquist AC, Palmer LA. Visual receptive field properties of cells of the superior colliculus after cortical lesions in the cat. Experimental neurology. 1971;33:629–652. doi: 10.1016/0014-4886(71)90133-6. [DOI] [PubMed] [Google Scholar]
- Sahibzada N, Dean P, Redgrave P. Movements resembling orientation or avoidance elicited by electrical stimulation of the superior colliculus in rats. The Journal of neuroscience: the official journal of the Society for Neuroscience. 1986;6:723–733. doi: 10.1523/JNEUROSCI.06-03-00723.1986. [DOI] [PMC free article] [PubMed] [Google Scholar]
- Sanes JR, Zipursky SL. Design principles of insect and vertebrate visual systems. Neuron. 2010;66:15–36. doi: 10.1016/j.neuron.2010.01.018. [DOI] [PMC free article] [PubMed] [Google Scholar]
- Schenberg LC, Povoa RM, Costa AL, Caldellas AV, Tufik S, Bittencourt AS. Functional specializations within the tectum defense systems of the rat. Neuroscience and biobehavioral reviews. 2005;29:1279–1298. doi: 10.1016/j.neubiorev.2005.05.006. [DOI] [PubMed] [Google Scholar]
- Sprague JM. Interaction of cortex and superior colliculus in mediation of visually guided behavior in the cat. Science. 1966;153:1544–1547. doi: 10.1126/science.153.3743.1544. [DOI] [PubMed] [Google Scholar]
- Sudre EC, de Barros MR, Sudre GN, Schenberg LC. Thresholds of electrically induced defence reaction of the rat: short- and long-term adaptation mechanisms. Behavioural brain research. 1993;58:141–154. doi: 10.1016/0166-4328(93)90099-c. [DOI] [PubMed] [Google Scholar]
- Sugino K, Hempel CM, Miller MN, Hattox AM, Shapiro P, Wu C, Huang ZJ, Nelson SB. Molecular taxonomy of major neuronal classes in the adult mouse forebrain. Nature neuroscience. 2006;9:99–107. doi: 10.1038/nn1618. [DOI] [PubMed] [Google Scholar]
- Valle FP. Effects of strain, sex, and illumination on open-field behavior of rats. The American journal of psychology. 1970;83:103–111. [PubMed] [Google Scholar]
- Wallace DJ, Greenberg DS, Sawinski J, Rulla S, Notaro G, Kerr JN. Rats maintain an overhead binocular field at the expense of constant fusion. Nature. 2013;498:65–69. doi: 10.1038/nature12153. [DOI] [PubMed] [Google Scholar]
- Wallace SF, Rosenquist AC, Sprague JM. Recovery from cortical blindness mediated by destruction of nontectotectal fibers in the commissure of the superior colliculus in the cat. The Journal of comparative neurology. 1989;284:429–450. doi: 10.1002/cne.902840309. [DOI] [PubMed] [Google Scholar]
- Wang L, Sarnaik R, Rangarajan K, Liu X, Cang J. Visual receptive field properties of neurons in the superficial superior colliculus of the mouse. The Journal of neuroscience: the official journal of the Society for Neuroscience. 2010;30:16573–16584. doi: 10.1523/JNEUROSCI.3305-10.2010. [DOI] [PMC free article] [PubMed] [Google Scholar]
- Wang Q, Burkhalter A. Stream-related preferences of inputs to the superior colliculus from areas of dorsal and ventral streams of mouse visual cortex. The Journal of neuroscience: the official journal of the Society for Neuroscience. 2013;33:1696–1705. doi: 10.1523/JNEUROSCI.3067-12.2013. [DOI] [PMC free article] [PubMed] [Google Scholar]
- Wang Q, Gao E, Burkhalter A. Gateways of ventral and dorsal streams in mouse visual cortex. The Journal of neuroscience: the official journal of the Society for Neuroscience. 2011;31:1905–1918. doi: 10.1523/JNEUROSCI.3488-10.2011. [DOI] [PMC free article] [PubMed] [Google Scholar]
- Wickelgren BG, Sterling P. Influence of visual cortex on receptive fields in the superior colliculus of the cat. Journal of neurophysiology. 1969;32:16–23. doi: 10.1152/jn.1969.32.1.16. [DOI] [PubMed] [Google Scholar]
- Williams DI. Maze exploration in the rat under different levels of illumination. Animal behaviour. 1971;19:365–367. doi: 10.1016/s0003-3472(71)80018-0. [DOI] [PubMed] [Google Scholar]
- Wu GK, Arbuckle R, Liu BH, Tao HW, Zhang LI. Lateral sharpening of cortical frequency tuning by approximately balanced inhibition. Neuron. 2008;58:132–143. doi: 10.1016/j.neuron.2008.01.035. [DOI] [PMC free article] [PubMed] [Google Scholar]
- Xiong XR, Liang F, Li H, Mesik L, Zhang KK, Polley DB, Tao HW, Xiao Z, Zhang LI. Interaural level difference-dependent gain control and synaptic scaling underlying binaural computation. Neuron. 2013;79:738–753. doi: 10.1016/j.neuron.2013.06.012. [DOI] [PMC free article] [PubMed] [Google Scholar]
- Xu NL, Harnett MT, Williams SR, Huber D, O’Connor DH, Svoboda K, Magee JC. Nonlinear dendritic integration of sensory and motor input during an active sensing task. Nature. 2012;492:247–251. doi: 10.1038/nature11601. [DOI] [PubMed] [Google Scholar]
- Yilmaz M, Meister M. Rapid innate defensive responses of mice to looming visual stimuli. Current biology: CB. 2013;23:2011–2015. doi: 10.1016/j.cub.2013.08.015. [DOI] [PMC free article] [PubMed] [Google Scholar]
- Zhang S, Xu M, Kamigaki T, Hoang Do JP, Chang WC, Jenvay S, Miyamichi K, Luo L, Dan Y. Selective attention. Long-range and local circuits for top-down modulation of visual cortex processing. Science. 2014;345:660–665. doi: 10.1126/science.1254126. [DOI] [PMC free article] [PubMed] [Google Scholar]
- Zhao X, Liu M, Cang J. Visual cortex modulates the magnitude but not the selectivity of looming-evoked responses in the superior colliculus of awake mice. Neuron. 2014;84:202–213. doi: 10.1016/j.neuron.2014.08.037. [DOI] [PMC free article] [PubMed] [Google Scholar]
- Zhou M, Liang F, Xiong XR, Li L, Li H, Xiao Z, Tao HW, Zhang LI. Scaling down of balanced excitation and inhibition by active behavioral states in auditory cortex. Nat Neurosci. 2014 doi: 10.1038/nn.3701. [DOI] [PMC free article] [PubMed] [Google Scholar]
- Zingg B, Hintiryan H, Gou L, Song MY, Bay M, Bienkowski MS, Foster NN, Yamashita S, Bowman I, Toga AW, et al. Neural networks of the mouse neocortex. Cell. 2014;156:1096–1111. doi: 10.1016/j.cell.2014.02.023. [DOI] [PMC free article] [PubMed] [Google Scholar]
Associated Data
This section collects any data citations, data availability statements, or supplementary materials included in this article.