
Figure 4. Characterization of neuronal responses in L5 and SC.
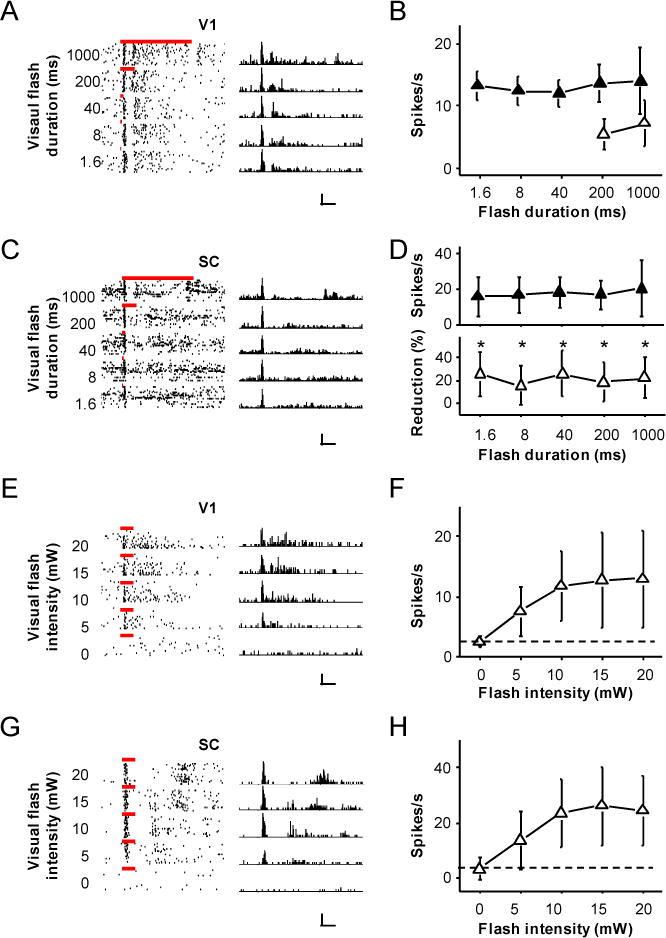
(A) Spike responses of a V1 L5 neuron to flash stimulation of different durations. Left, raster plots. Bars mark the duration of flash. Right, corresponding PSTHs (bin size = 10 ms). Scale: 70 Hz, 250 ms.
(B) Summary of firing rates at different durations (n = 11 V1 L5 neurons). Solid symbol, firing rate was measured within a 100 ms window after the onset of response. Open symbol, firing rate was measured within a time window equivalent to the length of stimulus duration after the onset of response. Bar = SD.
(C) Responses of a SC neuron to flash stimulation of different durations. Scale: 150 Hz, 250 ms.
(D) Upper panel, summary of firing rates at different durations (n = 11 SC neurons). Firing rate was measured within a 100 ms window after the onset of response. Lower panel, average percentage reduction of firing rates of SC neurons after silencing the V1 (n = 11). Bar = SD. *, p < 0.05, paired t-test.
(E) Responses of a V1 L5 neuron to flash stimulation of different intensities (duration = 200 ms). Scale: 50 Hz, 250 ms.
(F) Summary of firing rates at different intensities (n = 10 V1 cells). Dash line indicates spontaneous spike rate.
(G) Responses of a SC neuron to flash stimulation of different intensities. Scale: 60 Hz, 250 ms.
(F) Summary of firing rates at different intensities (n = 14 SC cells).