

Abstract
Background
Body mass index (BMI) is a convenient measure used to assess obesity and is used to select candidates for kidney donation. Glomerulomegaly is an early indicator of obesity-related kidney disease. Whether obesity assessment by BMI best reflects underlying glomerulomegaly and is predictive of adverse changes in renal function postdonation is unclear.
Methods
We performed a retrospective study on a cohort of 1065 living donors at the Mayo Clinic in Rochester; obesity measures by BMI and by computed tomography were compared between 20 donors with largest to 20 donors with the smallest glomerular volumes (on implantation biopsy). In addition, the change in kidney function postdonation (mean 7 months) was compared across BMI groups (<25, 25-29, 30-34, ≥35 kg/m2) in about 500 donors.
Results
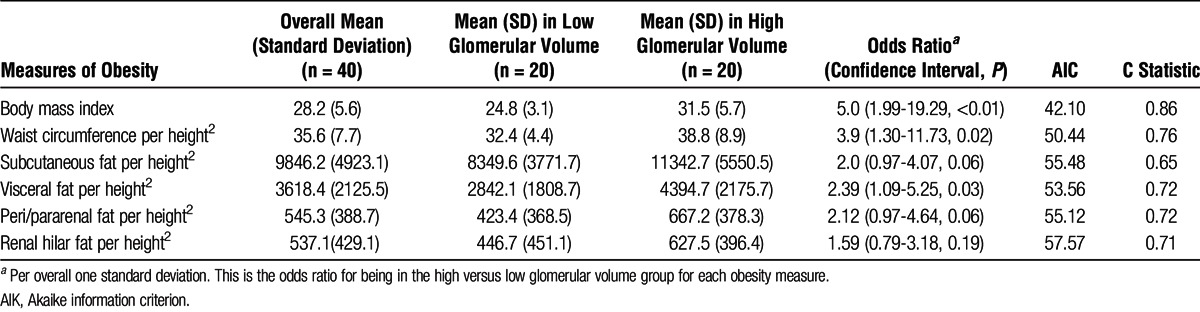
We observed that larger glomerular volume was more strongly associated with BMI per standard deviation (SD) (odds ratio [OR] =5.0, P = 0.002) than waist circumference/height2 per SD (OR = 3.9, P = 0.02), visceral fat/height2 per SD (OR = 2.4, P = 0.02), subcutaneous fat/height2 per SD (OR = 2.0, P = 0.06), renal hilar fat/height2 per SD (OR = 1.6, P = 0.19), or peri/pararenal fat/height2 per SD (OR = 1.5, P = 0.23). Postdonation changes in glomerular filtration rate, blood pressure, and albuminuria were similar across BMI categories.
Conclusions
The BMI outperforms various computed tomography measures of abdominal fat in detecting obesity-related glomerulomegaly. Despite this strong association with glomerulomegaly, short-term renal function outcomes are similar across BMI categories. Long-term follow-up is required to definitively define the impact of obesity on kidney function after donation.
Obesity is a risk factor for chronic kidney disease (CKD)1, 2 and end-stage renal disease (ESRD),3 hence obesity is a concern among living kidney donors. Although body mass index (BMI) is a commonly used measure of obesity, other measures of obesity may better predict CKD and ESRD.4 Alternative obesity measures include waist circumference, subcutaneous fat, visceral adiposity, peri/pararenal fat and renal hilar fat. In one 5-year longitudinal study, estimated body fat percentage based on bioelectrical impedance analyses rather than BMI or waist circumference was associated with the highest decline in estimated glomerular filtration rate (eGFR).5
Consistent with the increased prevalence of obesity in the general population, potential kidney donors are increasingly obese. In the Renal and Lung Living Donors Evaluation study of 8951 kidney donors who donated between 1963 and 2007 at 3 major U.S. transplant centers, the prevalence of BMI (≥35 kg/m2) among donors increased from 8% (1963-1974) to 26% (1997-2007).6 Previous data suggested that higher BMI impacts outcomes in subjects with reduced kidney mass. In patients undergoing unilateral nephrectomy for cause (e.g., malignancy), higher BMI increased the risk of future proteinuria and CKD.7, 8 Studies of obesity in kidney donor populations have had somewhat conflicting results with respect to risk of future kidney dysfunction.8 9,10 11 Glomerulomegaly is the early structural lesion of obesity-related kidney disease12 and is often present in patients with morbid obesity.13 Glomerulomegaly is associated with intraglomerular hypertension which may eventually promote glomerular tuft collapse and sclerosis (i.e., secondary focal segmental glomerulosclerosis).14, 15 We previously found that glomerulomegaly is correlated with lower predonation glomerular filtration rate (GFR) in a cohort of healthy kidney donors.16 Renal biopsies are not typically performed in evaluation of potential kidney donors. Thus, we conducted a study to determine which measure of obesity best reflects glomerulomegaly and if it predicted adverse changes in kidney function after donation. First, we compared BMI to several computed tomography (CT) measures of obesity (subcutaneous fat, visceral adiposity, peri/pararenal fat and renal hilar fat) to determine which was most closely associated with glomerulomegaly. Second, we assessed whether the identified obesity measure which most correlated with glomerulomegaly predicted adverse short-term outcomes.
MATERIALS AND METHODS
Study Cohort
With approval by the Institutional Review Board at Mayo Clinic, Rochester, MN, we identified kidney donors who had successfully donated a kidney between 2000 and 2008. Our standard practice for kidney donor evaluation includes a comprehensive clinical, laboratory, and abdominal CT angiogram evaluation. Additionally, an implant kidney biopsy (intraoperative) is performed immediately after revascularization of the kidney in the recipient. Donors in whom the CT angiogram or implant biopsy was not performed were excluded. All patients were invited to return for a follow-up clinic visit 3 to 12 months after donation.
Clinical and Laboratory Evaluation
All donors undergo a comprehensive clinical evaluation, which includes height, weight, and blood pressure (BP) measurement. Laboratory tests included fasting blood glucose, lipid profile, and uric acid. Kidney function was assessed by 24-hour urine albumin excretion and measured iothalamate clearance. These clinical and laboratory evaluations were repeated at the prescheduled follow-up visit 3 to 12 months after donation.
Measurement of Kidney Volumes
As described previously,17 a 4-channel Multidetector CT scanner (Qxi; GE Medical Systems, Little Chalfont, UK, www3.gehealthcare.com/en) was used from 2000 to 2005 and a 64-channel Multidetector CT scanner (Sensation 64; Siemens Medical Solutions, Malvern, PA, www.medical.siemens.com) was used from 2005 to 2008. The CT scanning was performed following standard clinical protocols. The CT images from the angiogram phase were downloaded into a local workstation for processing. We estimated the kidney cortical and medullary volumes using software (ITK-SNAP version 1.1, University of Pennsylvania, Philadelphia, PA, www.itksnap.org) 18 to semiautomatically segment the cortex and medulla from transverse images obtained during the angiogram (arterial) phase.
Measurement of Abdominal Fat
A subset of the donors also had fat quantified on their abdominal CT scans using Analyze (Mayo Clinic, Rochester MN, http://www.mayo.edu/research/labs/biomedical-imaging/software/analyze-software-system). 19 The subcutaneous and visceral fat areas (mm2) were measured on a single axial scan obtained at the umbilicus using the method similar to that described by Yoshizumi et al.20 We could not consistently distinguish peri- from pararenal fat. Instead, the combined peri/pararenal fat area was summed across cross-sectional scans at the hilum, the 25th percentile kidney length, and the 75th percentile kidney length for both kidneys. The renal hilar fat was segmented in the same manner as the kidney cortex and medulla with Insight Toolkit (ITK), a popular library of image analysis algorithms funded under the Visible Human Project by the U.S. National Library of Medicine, and summed between kidneys. The waist circumference was measured by the perimeter of the body contour at the umbilicus (Figure 1).
FIGURE 1.
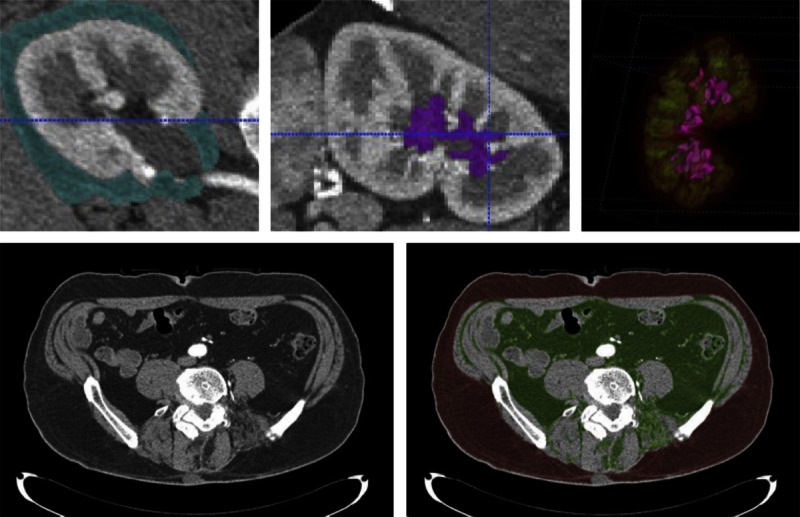
Segmented peri- and pararenal fat for right kidney shown in turquoise color (top left); renal sinus fat shown in magenta color on a sagittal slice (top middle). Top right picture shows the 3-dimensional view of renal sinus fat in magenta color, medulla in green, and cortex in red. Bottom left picture shows axial slice at umbilical level. Segmented subcutaneous fat (red) and visceral fat (green) are shown in the bottom right picture.
Histological Assessment of the Donor Kidney
Needle core renal biopsies were performed at the time of implantation (intraoperative) after revascularization of the kidney in the recipient. The tissue specimen was fixed in formalin and embedded into paraffin. A 3-μm-thick periodic acid-Schiff stained section was scanned into a high resolution digital image (Aperio XT system scanner, www.aperio.com) and magnified onto a tablet to manually outline the cortex and tufts of nonsclerotic glomeruli. The mean glomerular volume and glomerular density were calculated using the Weibel and Gomez method.21 The mean profile tubular area was also estimated as described previously.16 Biopsy sections were also manually inspected to estimate whether or not the proportion of the cortex with interstitial fibrosis was less than 5%.
Statistical Analyses
We first identified the 20 donors with the largest glomerular volumes and matched them on age (within 5 years) and sex to 20 donors with the lowest glomerular volumes. The measurements of abdominal fat on CT scan were only performed on these 40 donors. Because BMI is weight divided by height squared (m2), we also divided all the abdominal fat measures by height squared. The odds ratio for large versus small glomerular volume was compared between each of the obesity measures per standard deviation of BMI, visceral fat volume, waist circumference, subcutaneous fat, renal hilar fat, and para/perirenal fat (all but BMI divided by ht2) in logistic regression models, in which the Akaike information criterion and the C statistic were also evaluated. Lower Akaike information criterion and higher value in C statistic suggested better model performance. The C statistics between models were compared by the Mann-Whitney U test.22, 23The clinical, laboratory, biopsy, and radiographic characteristics of the entire study cohort were compared across 4 predonation BMI groups: less than 25, 25 to 29, 30 to 34, and 35 kg/m2 or greater. For dichotomous characteristics, the Cochran-Armitage test was used to evaluate whether there was a trend across the BMI groups. The association between other nominal variables and BMI was examined by the χ2 test. The Kruskal-Wallis test was used to assess group difference occurring in the continuous variables.
Among donors that returned for a follow-up visit, the change in kidney function and BP was assessed. This included the percentage change in GFR, 24-hour urine albumin, and systolic and diastolic BP. Albuminuria (24 hour urine albumin >20 mg) was dichotomized because of the high proportion with an undetectably low urine albumin. Thus, we could not analyze albuminuria as a continuous variable. Instead, we looked at the proportion with albuminuria at the second visit among those who did not have it at the first/baseline visit.
Changes in kidney function and BP were compared across BMI groups using analysis of variance and analysis of covariance to control for age and sex. Analyses were performed in SAS 9.3 (SAS Institute, Cary, North Carolina) and STATA 10 (StataCorp, College Station, TX). All tests were 2-sided, and P value less than 0.05 was considered statistically significant.
RESULTS
Among the entire cohort of 1065 successful kidney donors who were evaluated between May 1999 and September 2008, 31% (n = 332) were obese with BMI greater than 30 kg/m2.
Association of Obesity Indices and Glomerular Volume in Nonsclerotic Glomeruli
Among the subgroup of 40 donors with extremes of glomerular volume, the mean ± SD glomerular volume of the 20 with the largest glomerular volume was 0.006 ± 0.001 mm3 and that of the 20 kidney donors with the smallest glomerular volume was 0.001 ± 0.0003 mm3 (P < 0.001). The mean age and sex frequency of these 2 subgroups were the same (mean age 44 years and 70% female in each group). All of the measured indices of obesity were higher among the donors with larger glomerular volume; however, BMI was the obesity measurement that most strongly associated with the largest glomerular volumes: odds ratio = 5.03 (per 5 kg/m2 difference, 1 standard deviation), P = 0.002 (Table 1).
TABLE 1.
Association of Higher Glomerular Volume and Indices of Adiposity
Characteristics of Study Cohort at Time of Donation
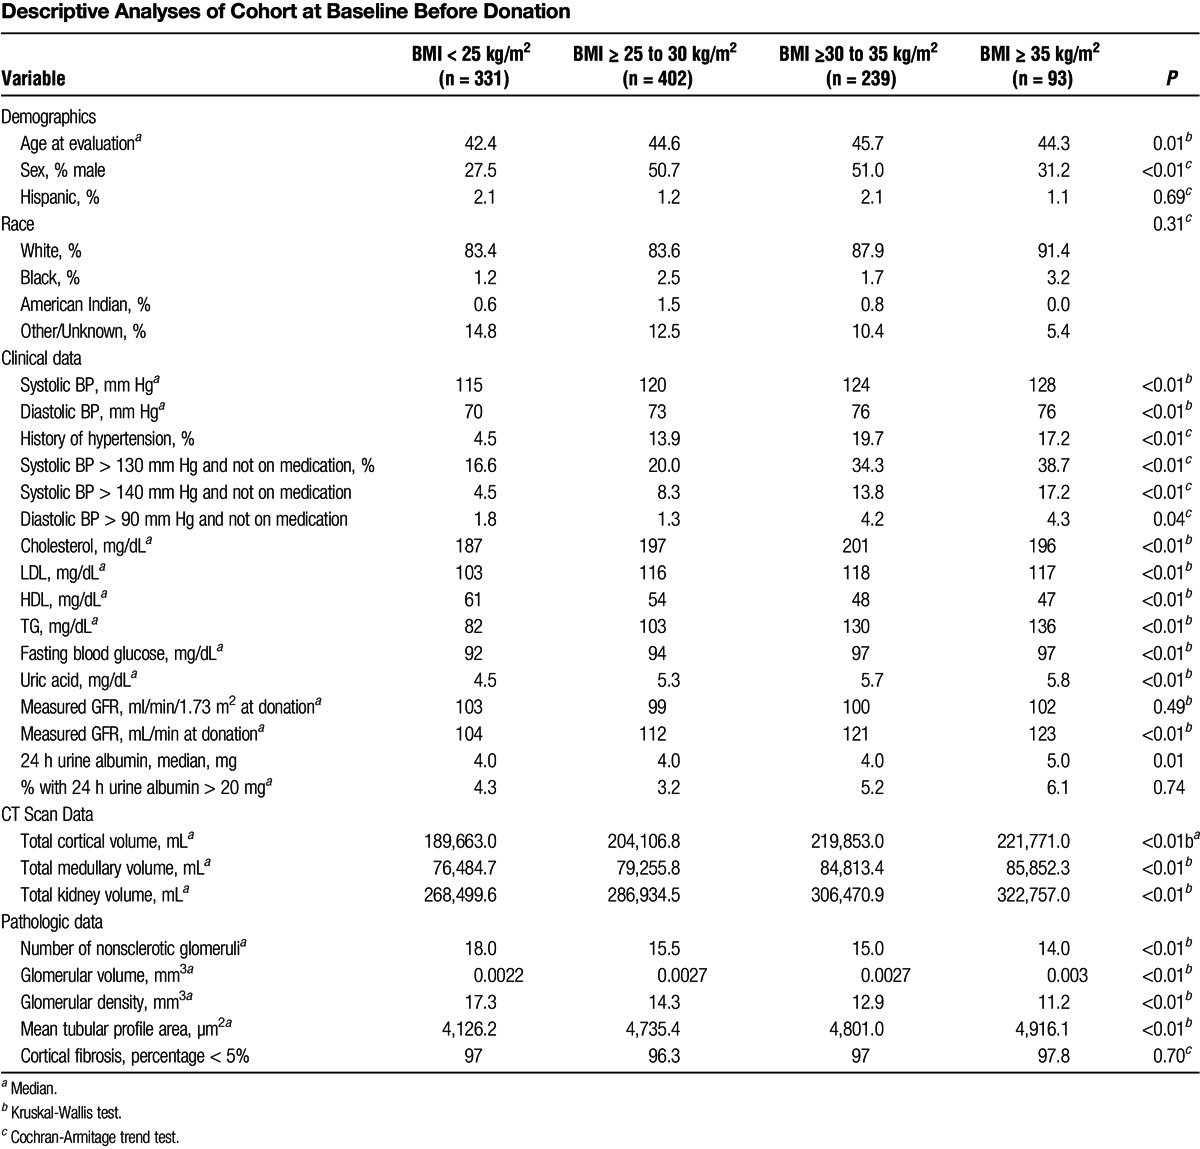
Donors were characterized by BMI as normal, overweight, obese, and severely obese: less than 25 kg/m2 (normal, n = 331), 25 to 30 kg/m2 (overweight, n = 402), 30 to 35 kg/m2 (obese, n = 239), and 35 kg/m2 or greater (severely obese, n = 93). Obese donors had higher systolic and diastolic BPs, worse lipid profiles, higher fasting blood glucose, and higher serum uric acid. Obese donors had higher GFR (in mL/min but not in mL/min/1.73 m2) and urine albumin excretion. They also had larger kidneys, larger glomeruli, larger renal tubules by mean profile tubular area, and larger nephrons by decreased glomerular density (Table 2).
TABLE 2.
Descriptive Analyses of Cohort at Baseline Before Donation
Association of BMI With Change in Kidney Function at Follow-Up
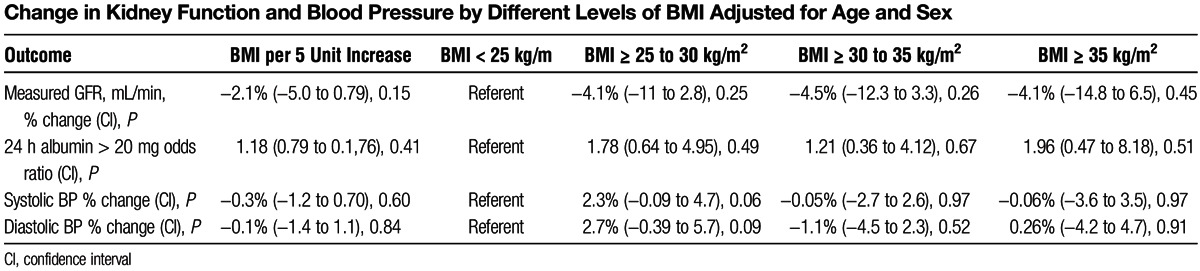
The mean follow-up time of the 500 (47%) donors that returned was 7 months. Mean GFR decreased after donation in all BMI groups. The percentage decline in GFR postdonation was not significantly different across BMI categories (Figure 2a). Although albumin excretion was higher in the higher BMI groups, the percentage change in postdonation albumin excretion did not significantly differ between BMI groups (Figure 2b). Similarly, postdonation changes in systolic and diastolic BP were not significantly different across BMI categories (P = 0.13 and 0.15, respectively). In a multivariate analyses adjusted for age and sex, BMI was not significantly associated with short-term changes in kidney function (GFR and albuminuria) or BP (Table 3). Because we looked at the proportion with albuminuria (24 hour urine albumin >20 mg) at the second visit among those who did not have it at the first/baseline visit, the estimation of odds ratio of 24 hour urine albumin was conducted by excluding 23 such patients with the measurements > 20 mg at baseline.
FIGURE 2.
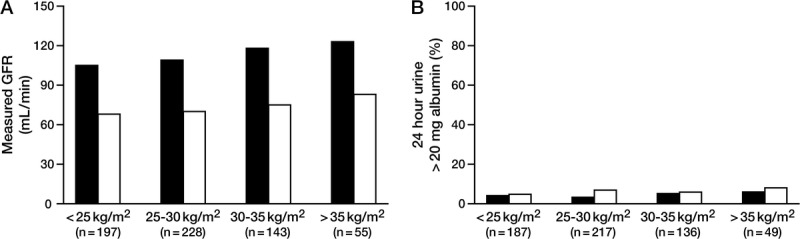
Percentage change in measured GFR (mL/min) before donation to after donation across BMI categories was not significant (P = 0.79). (A) Percentage difference in donors with 24 hour urine albumin greater than 20 mg before donation to after donation across BMI categories was not significant (P = 0.76).
TABLE 3.
Change in Kidney Function and Blood Pressure by Different Levels of BMI Adjusted for Age and Sex
DISCUSSION
In the 2 subsets selected for extremes of glomerular volume, BMI was more strongly associated with increased glomerular volume than were other more direct measures of adiposity by CT scan. The BMI correlated with BP and other adverse metabolic characteristics; however, short-term changes in renal function and BP after donation did not differ by BMI category. These findings suggest that while higher BMI associates with underlying structural changes in the kidney, this does not clearly correlate to alteration in renal adaptation after donor nephrectomy in the short term.
The BMI is a convenient measurement and surrogate marker of obesity and is one criterion used to determine kidney donor candidacy. There are no established consensus guidelines on a “safe” BMI threshold for kidney donation. The World Health Organization classification of obesity included Obese Class 1 (30-34.9 kg/m2, Obese Class 2 (35-39.9 kg/m2), and Obese Class 3 (≥40 kg/m2). Perhaps, based on these classifications and out of concern for an increased risk of kidney failure in obese donors, several centers have adopted an arbitrary threshold of BMI of 35 kg/m2 or higher for donor denial. The actual risk of kidney failure with kidney donation remains controversial. Much of the literature suggests that kidney donors have similar or even lower risk for development of ESRD or risk of mortality than that in the general population24 25,26 27; however, recent studies have raised questions on the risk of kidney failure among donors.28, 29
Previous studies on outcomes among obese donors were on small cohort groups, but had longer follow-up. They have generally reported outcomes that are consistent with our findings, showing that donor obesity has little or no impact on postdonation donor outcomes. Tavakol et al11 found that obese donors were more likely to develop albuminuria but not relatively lower renal function postdonation. Only age and lower GFR at donation were identified as risk factors for developing reduced renal function after donation. A study by Nogueira et al9 found no significant difference in the percent change of eGFR, presence of microalbuminuria, or hypertension among subjects with high BMI (≥35 kg/ m2) versus those with lower BMI (<35 kg/m2). However, in 39 black donors with 7 years of postdonation follow-up, BMI of 35 kg/m2 or greater was associated with a significant decline in eGFR compared to those with BMI less than 35 kg/m2.30 These data suggest that race may modify the risk of adverse renal outcomes with obese donors, although our study did not have a sufficient number of black donors for a meaningful subgroup analysis.
Another study comparing 41 nonobese donors (BMI < 30 kg/m2) and 49 obese donors (BMI ≥30 kg/m2) reported found no differences in glomerulopathy, intimal thickening, tubular atrophy, and interstitial fibrosis scores at baseline for these 2 groups. They reported significantly higher tubular dilatation but less tubular vacuolization and arterial hyalinosis among obese group. The obese donors had significantly higher systolic BP and iothalamate clearance before transplantation.31
The pathogenic mechanisms through which obesity induces proteinuria and kidney dysfunction are not entirely clear, though glomerulomegaly is an early manifestation. Although BMI and glomerular volume were weakly correlated in our otherwise healthy donors, we did not detect less GFR compensation in obese donors. It may be that factors other than obesity alone that promote increased glomerular volume are responsible for a decreased ability for the remaining postdonation renal mass to compensate. For instance, insulin resistance and hyperinsulinemia play a pathogenic role in glomerulomegaly through the preglomerular vasodilation induced by insulin. Glomerular gene expression profiles demonstrate that genes related to lipid metabolism, inflammatory cytokines, and insulin resistance are all significantly upregulated in subjects with glomerulopathy.32
There are some potential limitations to our study. Our study population was predominantly white, and meaningful comparison among different race groups was not possible. Additionally, follow-up was insufficient to address how obesity may impact long-term outcomes in kidney donors. Also, the data on the short-term follow-up was limited to around 50% of the donors, there was no identified systematic bias but we hypothesize that those who chose not to return, lived far off from the transplant center, working, young and healthy.
In conclusion, obesity is a concern in living donors and is associated with underlying structural changes in the kidney; however, in a relatively large sample of living donors, we found no relationship in the short-term between predonation BMI and adverse BP or kidney function changes with donation, even among donors with severe obesity (BMI ≥35 kg/m2). It is well established that obesity is a modifiable risk factor for kidney failure in the general population. Obese donors should be counseled on weight loss, but excluding obese donors from donation is not clearly justified based on available evidence. Long-term follow-up studies in obese donors are needed.
ACKNOWLEDGMENTS
The authors thank Ms. JoAnn McBroom of the Academic Office, Mayo Clinic in Arizona and Mr. Marvin Ruona from the Department of Graphics Design, Mayo Clinic in Arizona for their assistance in the preparation of this manuscript.
Footnotes
Published online 6 March 2015.
This study was supported with funding from the National Institutes of Health, National Institute of Diabetes and Digestive and Kidney Diseases (NIDDK) (R01 DK090358).
The authors declare no conflicts of interest.
H.A.C. participated in research design, performance of research, data analyses and writing paper. Y.-H.H. participated in research design, data analyses and writing paper. L.F.T. participated in writing paper. R.T.A. participated in data analyses and writing paper. H.A. participated in writing paper. L.O.L. participated in research design and writing paper. A.D. participated in data analyses and writing paper. A.D.R. participated in research design, performance of research, data analyses and writing paper.
REFERENCES
- 1. Gelber RP, Kurth T, Kausz AT, et al. Association between body mass index and CKD in apparently healthy men. Am J Kidney Dis 2005;46 (5):871. [DOI] [PubMed] [Google Scholar]
- 2. Kramer H, Luke A, Bidani A, Cao G, Cooper R, McGee D. Obesity and prevalent and incident CKD: the hypertension detection and follow-up program. Am J Kidney Dis 2005;46 (4):587. [DOI] [PubMed] [Google Scholar]
- 3. Hsu CY, McCulloch CE, Iribarren C, Darbinian J, Go AS. Body mass index and risk for end-stage renal disease. Ann Intern Med 2006;144 (1):21. [DOI] [PubMed] [Google Scholar]
- 4. Franca AK, Dos Santos AM, Salgado JV, Hortegal EV, da Silva AA, Salgado Filho N. Estimated visceral adipose tissue, but not body mass index, is associated with reductions in glomerular filtration rate based on cystatin C in the early stages of chronic kidney disease. Int J Nephrol 2014;2014:574267. [DOI] [PMC free article] [PubMed] [Google Scholar]
- 5. Oh SW, Ahn SY, Jianwei X, et al. Relationship between changes in body fat and a decline of renal function in the elderly. PLoS One 2014;9 (1):e84052. [DOI] [PMC free article] [PubMed] [Google Scholar]
- 6. Taler SJ, Messersmith EE, Leichtman AB, et al. Demographic, metabolic, and blood pressure characteristics of living kidney donors spanning five decades. Am J Transplant 2013;13 (2):390. [DOI] [PMC free article] [PubMed] [Google Scholar]
- 7. Gonzalez E, Gutierrez E, Morales E, et al. Factors influencing the progression of renal damage in patients with unilateral renal agenesis and remnant kidney. Kidney Int 2005;68 (1):263. [DOI] [PubMed] [Google Scholar]
- 8. Praga M, Hernandez E, Herrero JC, et al. Influence of obesity on the appearance of proteinuria and renal insufficiency after unilateral nephrectomy. Kidney Int 2000;58 (5):2111. [DOI] [PubMed] [Google Scholar]
- 9. Nogueira JM, Weir MR, Jacobs S, et al. A study of renal outcomes in obese living kidney donors. Transplantation 2010;90 (9):993. [DOI] [PubMed] [Google Scholar]
- 10. Rook M, Hofker HS, van Son WJ, Homan van der Heide JJ, Ploeg RJ, Navis GJ. Predictive capacity of pre-donation GFR and renal reserve capacity for donor renal function after living kidney donation. Am J Transplant 2006;6 (7):1653. [DOI] [PubMed] [Google Scholar]
- 11. Tavakol MM, Vincenti FG, Assadi H, et al. Long-term renal function and cardiovascular disease risk in obese kidney donors. Clin J Am Soc Nephrol 2009;4 (7):1230. [DOI] [PMC free article] [PubMed] [Google Scholar]
- 12. Kambham N, Markowitz GS, Valeri AM, Lin J, D'Agati VD. Obesity-related glomerulopathy: an emerging epidemic. Kidney Int 2001;59 (4):1498. [DOI] [PubMed] [Google Scholar]
- 13. Goumenos DS, Kawar B, El Nahas M, et al. Early histological changes in the kidney of people with morbid obesity. Nephrol Dial Transplant 2009;24 (12):3732. [DOI] [PubMed] [Google Scholar]
- 14. Rohatgi R, Flores D. Intratubular hydrodynamic forces influence tubulointerstitial fibrosis in the kidney. Curr Opin Nephrol Hypertens. 2010;19 (1):65. [DOI] [PMC free article] [PubMed] [Google Scholar]
- 15. Tsuboi N, Utsunomiya Y, Kanzaki G, et al. Low glomerular density with glomerulomegaly in obesity-related glomerulopathy. Clin J Am Soc Nephrol 2012;7 (5):735. [DOI] [PubMed] [Google Scholar]
- 16. Elsherbiny HE, Alexander MP, Kremers WK, et al. Nephron hypertrophy and glomerulosclerosis and their association with kidney function and risk factors among living kidney donors (in press). Clin J Am Soc Nephrol 2014;9. [DOI] [PMC free article] [PubMed] [Google Scholar]
- 17. Wang X, Vrtiska TJ, Avula RT, et al. Age, kidney function, and risk factors associate differently with cortical and medullary volumes of the kidney. Kidney Int 2014;85 (3):677. [DOI] [PMC free article] [PubMed] [Google Scholar]
- 18. Yushkevich PA, Piven J, Hazlett HC, et al. User-guided 3D active contour segmentation of anatomical structures: significantly improved efficiency and reliability. Neuroimage 2006;31 (3):1116. [DOI] [PubMed] [Google Scholar]
- 19. Robb RA, Hanson DP. A software system for interactive and quantitative visualization of multidimensional biomedical images. Australas Phys Eng Sci Med 1991;14 (1):9. [PubMed] [Google Scholar]
- 20. Yoshizumi T, Nakamura T, Yamane M, et al. Abdominal fat: standardized technique for measurement at CT. Radiology 1999;211 (1):283. [DOI] [PubMed] [Google Scholar]
- 21. Weibel ER, Gomez DM. A principle for counting tissue structures on random sections. J Appl Physiol 1962;17:343. [DOI] [PubMed] [Google Scholar]
- 22. DeLong ER, DeLong DM, Clarke-Pearson DL. Comparing the areas under two or more correlated receiver operating characteristic curves: a nonparametric approach. Biometrics 1988;44 (3):837. [PubMed] [Google Scholar]
- 23. Gonen M. Analyzing Receiving Operating Characteristic Curves With SAS (Sas Press Series). 1st ed SAS Institute, 2007. [Google Scholar]
- 24. Fehrman-Ekholm I, Elinder CG, Stenbeck M, Tyden G, Groth CG. Kidney donors live longer. Transplantation 1997;64 (7):976. [DOI] [PubMed] [Google Scholar]
- 25. Ibrahim HN, Foley R, Tan L, et al. Long-term consequences of kidney donation. N Engl J Med 2009;360 (5):459. [DOI] [PMC free article] [PubMed] [Google Scholar]
- 26. Ramcharan T, Matas AJ. Long-term (20–37 years) follow-up of living kidney donors. Am J Transplant 2002;2 (10):959. [DOI] [PubMed] [Google Scholar]
- 27. Segev DL, Muzaale AD, Caffo BS, et al. Perioperative mortality and long-term survival following live kidney donation. JAMA. 2010;303 (10):959. [DOI] [PubMed] [Google Scholar]
- 28. Mjoen G, Hallan S, Hartmann A, et al. Long-term risks for kidney donors. Kidney Int 2014;86 (1):162. [DOI] [PubMed] [Google Scholar]
- 29. Muzaale AD, Massie AB, Wang MC, et al. Risk of end-stage renal disease following live kidney donation. JAMA 2014;311 (6):579. [DOI] [PMC free article] [PubMed] [Google Scholar]
- 30. Nogueira JM, Weir MR, Jacobs S, et al. A study of renal outcomes in African American living kidney donors. Transplantation. 2009;88 (12):1371. [DOI] [PMC free article] [PubMed] [Google Scholar]
- 31. Rea DJ, Heimbach JK, Grande JP, et al. Glomerular volume and renal histology in obese and non-obese living kidney donors. Kidney Int 2006;70 (9):1636. [DOI] [PubMed] [Google Scholar]
- 32. Wu Y, Liu Z, Xiang Z, et al. Obesity-related glomerulopathy: insights from gene expression profiles of the glomeruli derived from renal biopsy samples. Endocrinology 2006;147 (1):44. [DOI] [PubMed] [Google Scholar]