Abstract
To improve the outcome of cancer chemotherapy, strategies to enhance the efficacy of anticancer drugs are required. Sorafenib is the only drug to prolong overall survival of the patients with hepatocellular carcinoma (HCC), however, the outcome is still not satisfactory. Retinoids, vitamin A derivatives, have been known to exhibit inhibitory effects on various cancers including HCC. In this study, we investigated the effects of combined treatment using sorafenib and retinoids including all-trans retinoic acid (ATRA), NIK-333, and Am80 on HCC cells. Cell viability assays in six HCC cell lines, HepG2, PLC/PRF/5, HuH6, HLE, HLF, and Hep3B, revealed that 5 and 10 μM ATRA, concentrations that do not exert cytotoxic effects, enhanced the cytotoxicity of sorafenib, being much more effective than NIK-333 and Am80. We found that ATRA induced AMP-activated protein kinase activation, which was followed by reduced intracellular ATP level. Gene expression analysis revealed that ATRA decreased the expression of glycolytic genes such as GLUT-1 and LDHA. In the combination treatment using ATRA and sorafenib, increased apoptosis, followed by the activation of p38 MAPK and JNK, the upregulation and translocation of Bax to mitochondria, and the activation of caspase-3, was observed. Suppression of AMP-activated protein kinase by siRNA restored the viability of the cells treated with ATRA and sorafenib. Our results thus indicate that ATRA is useful for enhancing the cytotoxicity of sorafenib against HCC cells by regulating the energy metabolism of HCC cells.
Keywords: AMPK, combination therapy, hepatocellular carcinoma, retinoic acid, sorafenib
Hepatocellular carcinoma is the sixth most common cancer and the third most frequent cause of cancer death worldwide.1 For patients who have advanced HCC, palliative treatments such as transarterial chemoembolization and sorafenib play a role in improving survival.1 Multitargeted kinase inhibitor sorafenib is the only drug approved for patients who have either failed transarterial chemoembolization or who present with more advanced HCC.2 However, sorafenib has been reported to be beneficial in only approximately 30% of patients and acquired resistance often develops within 6 months.3 Therefore, to improve the outcome of chemotherapy, the strategies that enhance the antitumor effect of sorafenib are urgently required.
Oncogenic mutations can result in the uptake of nutrients, particularly glucose, that meet or exceed the bioenergetics demands of cell growth and proliferation.4 Cancer cells rely more on glycolysis than oxidative phosphorylation to generate sufficient energy for rapidly proliferating tumor cells, even under normal oxygen concentration.4 This phenomenon, so-called Warburg effect, has been recognized as one of the hallmarks of cancer, being closely related with either inherent or acquired drug resistance.5,6 Therefore, targeting the energy metabolism of cancer cells may be a promising strategy to improve the outcome of chemotherapy. One of the links directly connecting cell metabolism and cancer is AMPK, a central metabolic switch that controls glucose and lipid metabolism. AMP-activated protein kinase becomes activated in response to an increased AMP/ATP ratio, a condition of energetic stress, and promotes the catabolic pathway, inhibiting cell proliferation.7 Many cancer cells show a loss of appropriate AMPK signaling to overcome this regulation in order to proliferate under abnormal nutrient conditions with an enhanced glycolytic phenotype.8 Therefore, activation of AMPK is a potential strategy to control tumor cell growth by regulating tumor cell metabolism.
Retinoids, which are vitamin A derivatives, have been reported to prevent cancer in various organs including stomach, breast, lung, prostate, and liver.9–15 Retinoic acid, a physiologically active form of retinoid, and its receptor RAR exert their effects by regulating expression of downstream genes in a RARE-dependent manner, namely through retinoid signaling.16 We previously reported that hepatocyte-specific inhibition of RA signaling caused steatohepatitis, iron accumulation, generation of oxidative stress, and HCC development in the liver of transgenic mice.17,18 Furthermore, we showed that retinoids improved insulin resistance, a known risk factor for HCC, by restoring leptin signaling in the liver of obesity model mice and HCC cells.19 Acyclic retinoid (NIK-333), one of the synthetic retinoids, has been reported to be effective in preventing HCC development in humans and diabetic db/db mice through activating AMPK.20,21 These observations helped us to develop the hypothesis that retinoids affect the energy metabolism of cancer cells and show anticancer effects on HCC cells. From this perspective, it is of great interest whether retinoids enhance the cytotoxic effect of anticancer drugs on HCC cells. In this study, we evaluated the effect of retinoids on the cytotoxicity of sorafenib, and found that suppression of glycolysis by retinoic acid sensitizes HCC cells to apoptosis induced by sorafenib through AMPK activation.
Materials and Methods
Cell viability assay
Cell viability was determined by the WST assay using Cell Counting Kit-8 (Dojin Chemical Co., Kumamoto, Japan) according to the manufacturer's instructions.
Western blot analysis
Western blot was carried out using the standard protocol. Primary antibodies used in this study are described in Document S1.
RNA isolation and gene expression analysis
Total RNA was extracted from cells using TRIzol Reagent (Invitrogen, Life Technologies, Tokyo, Japan). Complementary DNA was synthesized by using Superscript II reverse-transcriptase (Invitrogen) and mRNA expression was determined by the LightCycler System using gene-specific primers (Table S1).
Other methods
Additional methods are described in Document S1.
Results
Retinoids enhanced cytotoxic effect of anticancer drugs in HepG2 cells
To examine the effect of retinoids and sorafenib on HCC cell proliferation, cell viability assays were carried out using HepG2 cells. Three retinoids (ATRA, NIK-333, and Am80) and sorafenib significantly reduced cell viability in a dose- and time-dependent manner (Fig. S1). Next, to examine the effect of the combination treatment, HepG2 cells were treated with various concentrations of sorafenib (0–100 μM) alone or in combination with the retinoids. Retinoids were used at the concentrations of 5 and 10 μM, which showed no inhibitory effect on the proliferation of HepG2 cells up to 72 h after treatment (Fig. S1). As shown in Figure1, ATRA and NIK-333 increased the cytotoxicity of sorafenib, whereas Am80 showed little effect (Fig.1a–c). The effect of retinoids on the cytotoxicity of anticancer drugs was further investigated in another four drugs, namely adriamycin, mitomycin C, cisplatin, and 5-FU. Although ATRA enhanced the cytotoxic effect of these four drugs, NIK-333 was effective only in one case, when combined with adriamycin (Figs S2,S3). Am80 showed no obvious enhancing effect (Fig. S4). The enhancing effects of combination therapy using ATRA and sorafenib were further confirmed in an additional five HCC cell lines including PLC/PRF/5, HuH6, HLE, HLF, and Hep3B (Fig.1d). These data suggest that ATRA enhanced the cytotoxic effect of anticancer drugs in HCC cells, being much more effective than NIK-333 and Am80.
Fig 1.
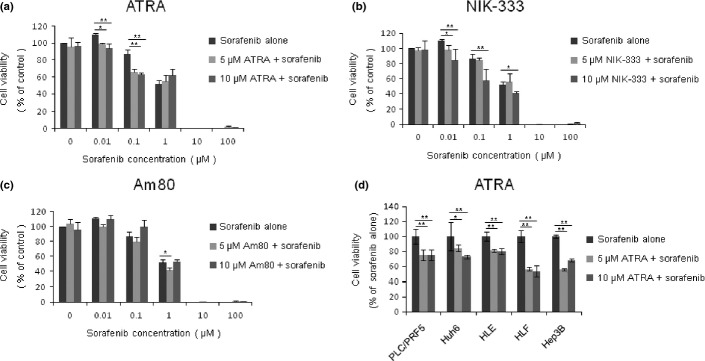
Cell viability assays of HepG2 hepatocellular carcinoma cells treated with retinoids and sorafenib. Cells were treated with sorafenib alone at the indicated concentrations, or in combination with 5 or 10 μM all-trans retinoic acid (ATRA) (a), NIK-333 (b), and Am80 (c) for 48 h. Cell viabilities were determined by WST assay and expressed as percentages of those of control (DMSO treatment). (d) Hepatocellular carcinoma cell lines (PLC/PRF/5, HuH6, HLE, HLF, and Hep3B) were treated with 1 μM sorafenib alone, or in combination with 5 or 10 μM ATRA for 48 h. Cell viabilities were expressed as percentages of those of control (sorafenib alone). *P < 0.05, **P < 0.01 versus control. Experiments were run in triplicate and carried out at least two times on separate occasions.
All-trans retinoic acid induced AMPK activation and reduced intracellular ATP level of HepG2 cells
To examine the involvement of metabolic modification to the enhancement of cytotoxicity by retinoids, we investigated the activation of AMPK in cells after treatment. As shown in Figure2, AMPK activation was observed in the cells treated with ATRA alone or in combination with sorafenib at 12, 24, and 48 h after treatment (Fig.2a). Other than sorafenib, drugs combined with ATRA showed only a minor effect on AMPK activation when the cells were treated with anticancer drugs such as adriamycin, cisplatin, mitomycin C, and 5-FU at concentrations at which their most potent cytotoxicity was observed in the WST assay (data not shown). In addition, AMPK activation was not observed in cells treated with NIK-333 (Fig.2b). Activation of AMPK has been known to be induced by decreased cellular ATP levels.7 Therefore, we next measured ATP levels in cells treated with retinoids and sorafenib. As shown in Figure2(c), decreased intracellular ATP levels were observed in cells treated with ATRA, whereas NIK-333 and sorafenib had no effect on ATP levels in either single or combination treatments. These data suggest that ATRA, but not NIK-333, induced AMPK activation by reducing intracellular ATP levels, enhancing the cytotoxic effect of sorafenib.
Fig 2.
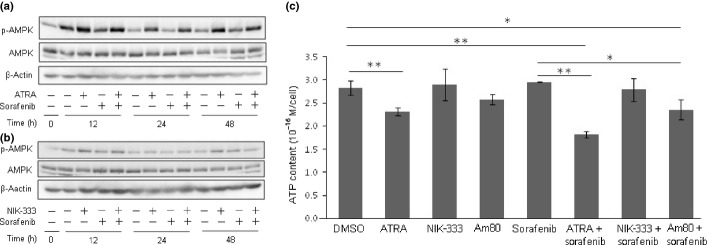
All-trans retinoic acid (ATRA) induces AMP-activated protein kinase (AMPK) activation and reduces intracellular ATP content in HepG2 hepatocellular carcinoma cells. (a) HepG2 cells were treated with 0.1 μM sorafenib and 10 μM ATRA alone, or in combination, for 0, 12, 24, or 48 h. Activation of AMPK was detected by immunoblot of phospho-AMPK (Thr-172). (b) HepG2 cells were treated with 0.1 μM sorafenib and 10 μM NIK-333 alone, or in combination. β-Actin served as a control of protein loading. (c) HepG2 cells were treated with 0.1 μM sorafenib and retinoids (ATRA and NIK-333, 10 μM; Am80, 5 μM) for 24 h. Intracellular ATP content was determined by a luciferase-based luminescent assay. *P < 0.05, **P < 0.01 versus DMSO. Experiments were run in triplicate and carried out at least three times on separate occasions.
Gene expression profiles of enzymes involved in glycolysis and TCA cycles
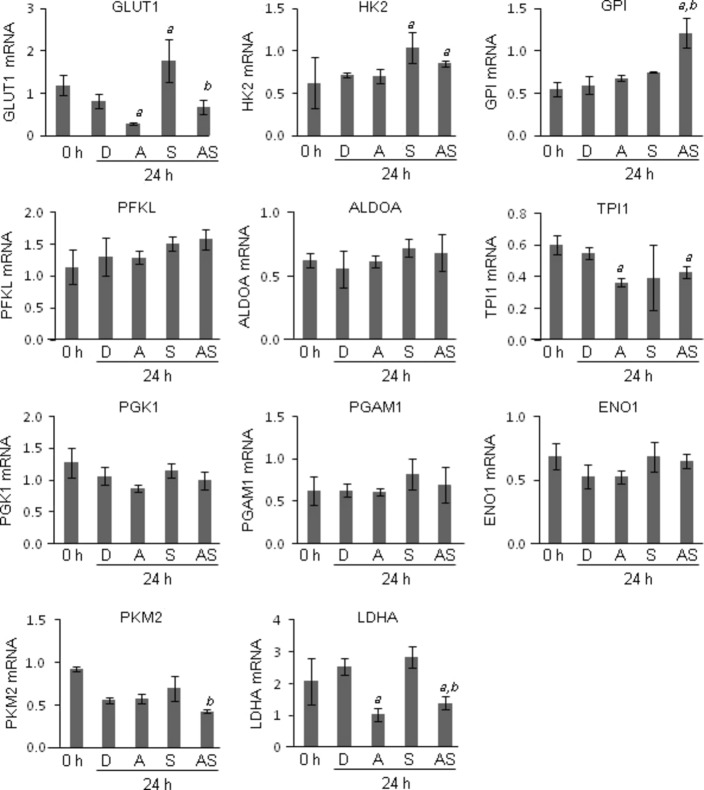
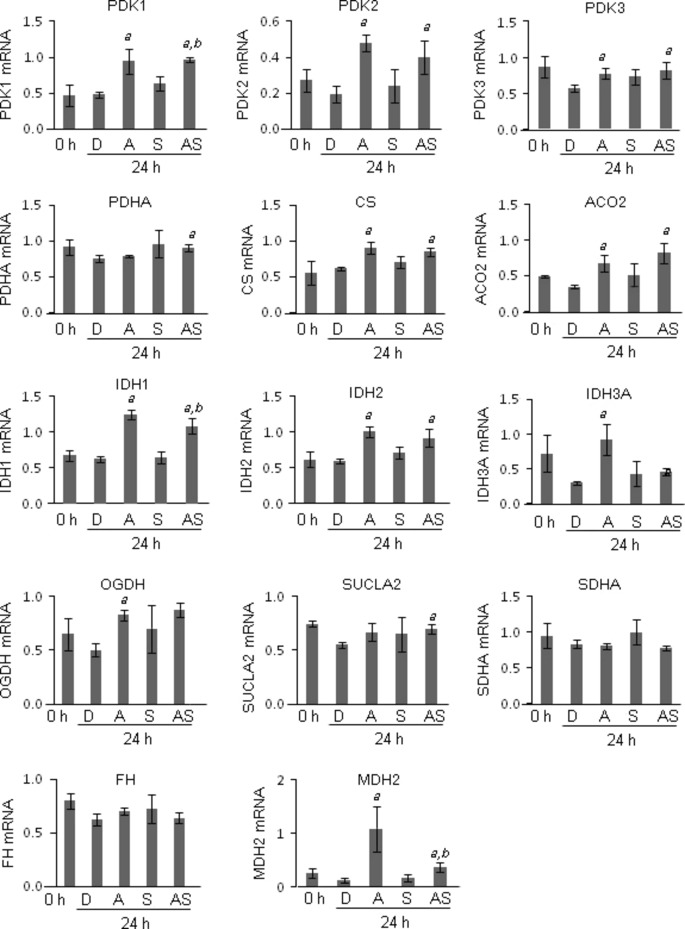
To explore the mechanism underlying the reduction of intracellular ATP by ATRA, mRNA expression of the enzymes involved in glycolysis and TCA cycles was measured by quantitative RT-PCR. Among the glycolytic genes, GLUT-1, TPI1, and LDHA mRNA were significantly downregulated by ATRA treatment compared to DMSO treatment (Fig.3). GLUT-1, PKM2, and LDHA mRNA were significantly downregulated in the cells treated with the combination of ATRA and sorafenib compared to those of sorafenib alone (Fig.3). Next, we investigated the mRNA expression of enzymes involved in the TCA cycle. Among the genes, PDK1, PDK2, PDK3, CS, ACO2, IDH1, IDH2, IDH3A, OGDH, and MDH2 were significantly upregulated compared to DMSO treatment (Fig.4). PDK1, IDH1, and MDH2 mRNA expression was significantly upregulated in cells treated with the combination of ATRA and sorafenib compared to those of sorafenib alone (Fig.4). In silico analysis revealed that putative RAREs (direct repeat 5) exist in the promoter region 10 kb upstream of these genes (Table S2). These data suggest that ATRA downregulated the expression of glycolytic genes, whereas ATRA upregulated the expression of genes involved in the TCA cycle.
Fig 3.
Gene expression analysis of enzymes involved in the glycolytic pathway by quantitative RT-PCR. HepG2 hepatocellular carcinoma cells were treated with 0.1% DMSO (D), 0.1 μM sorafenib (S), and 10 μM all-trans retinoic acid (ATRA) alone (A), or in combination (AS), for 24 h. The mRNA expression of glucose transporter 1 (GLUT-1), hexokinase 2 (HK2), glucose-6-phosphate isomerase (GPI), phosphofructokinase, liver (PFKL), aldolase A (ALDOA), triosephosphate isomerase 1 (TPI1), phosphoglycerate kinase 1 (PGK1), phosphoglycerate mutase 1 (PGAM1), enolase 1 (ENO1), pyruvate kinase, muscle (PKM2), and lactose dehydrogenase A (LDHA) was determined by quantitative RT-PCR using gene-specific primers. The levels of mRNA expression were expressed as relative expression to GAPDH mRNA. a, P < 0.05 versus DMSO; b, P < 0.05 versus sorafenib alone. Experiments were run in triplicate and carried out once.
Fig 4.
Gene expression analysis of enzymes involved in the tricarboxylic acid cycle by quantitative RT-PCR. HepG2 hepatocellular carcinoma cells were treated with 0.1% DMSO (D), 0.1 μM sorafenib (S), or 10 μM all-trans retinoic acid (ATRA) alone (A), or in combination (AS), for 24 h. The mRNA expression of pyruvate dehydrogenase kinase (PDK)1, PDK2, PDK3, pyruvate dehydrogenase subunit α (PDHA), citrate synthase (CS), aconitase 2 (ACO2), isocitrate dehydrogenase (IDH)1, IDH2, IDH3A, oxoglutarate dehydrogenase (OGDH), succinate-CoA ligase, ADP-forming, β subunit (SUCLA2), succinate dehydrogenase complex, subunit A (SDHA), fumarate hydratase (FH), and malate dehydrogenase 2 (MDH2) was determined by quantitative RT-PCR using gene-specific primers. The levels of mRNA expression were expressed as relative expression to GAPDH mRNA. a, P < 0.05 versus DMSO; b, P < 0.05 versus sorafenib alone. Experiments were run in triplicate and carried out once.
Combined treatment using ATRA and sorafenib induced apoptosis by enhancing intrinsic mitochondrial apoptotic pathway in HCC cells
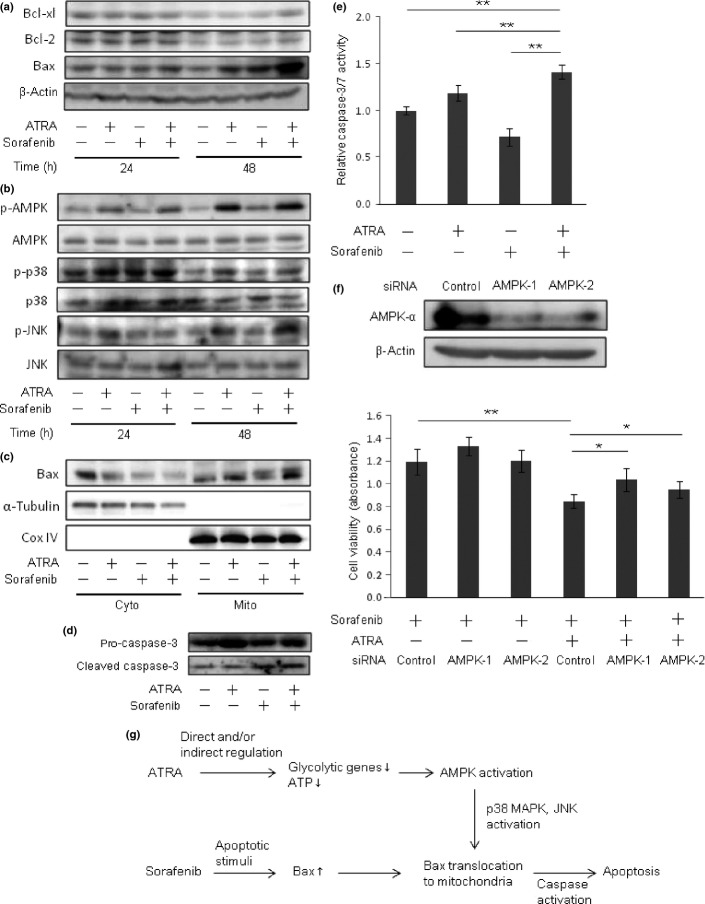
To investigate the enhancing effect of ATRA on the cytotoxicity of sorafenib in more detail, the number of apoptotic cells was counted. Hoechst staining revealed that apoptosis was increased in cells treated with the combination of ATRA and sorafenib at 24 and 48 h after treatment (Fig.5a). No induction of apoptosis was observed in cells treated with ATRA or sorafenib alone (Fig.5b). Treatment with ATRA alone had no inhibitory effect on target kinases of sorafenib including vascular endothelial growth factor receptor-2, c-RAF, MEK, and ERK activation (Fig. S5). Induction of p53 and phospho-p53, a stabilized form of p53, were observed in adriamycin-treated cells (Fig. S6). We next examined the expression of antiapoptotic and proapoptotic proteins by western blot analysis. As shown in Figure6 (a), upregulation of proapoptotic protein Bax was evident 48 h after combined treatment with ATRA and sorafenib, whereas antiapoptotic proteins Bcl-xL and Bcl-2 were not changed. Activation of AMPK has been reported to promote Bax translocation from cytosol to mitochondria through activation of p38 MAPK and JNK.22 The presence of phospho-p38 and phospho-JNK in Western blot analysis indicated that p38 MAPK and JNK were activated in cells treated with ATRA alone and in combination with sorafenib for 48 h (Fig.6b). As shown in Figure6(c), Bax translocation from the cytosol to mitochondria was enhanced in cells treated with combined ATRA and sorafenib (Fig.6c). Caspase-3 activation, indicated by the cleaved p17 isoform of caspase-3, and enzymatic activity of caspase-3/7 were both upregulated in cells treated with combined ATRA and sorafenib compared to those of sorafenib alone (Fig.6d,e). We further investigated the effect of AMPK knockdown on the viability of cells treated with sorafenib and ATRA. Suppression of AMPK activation by gene-specific siRNAs cancelled the enhancing effect of drug sensitivity by ATRA (Fig.6f). Together, these results indicated that combined treatment with ATRA and sorafenib induced apoptosis of HCC cells by enhancing the expression and translocation of Bax to mitochondria through activation of the AMPK–p38 MAPK pathway (Fig.6g).
Fig 5.
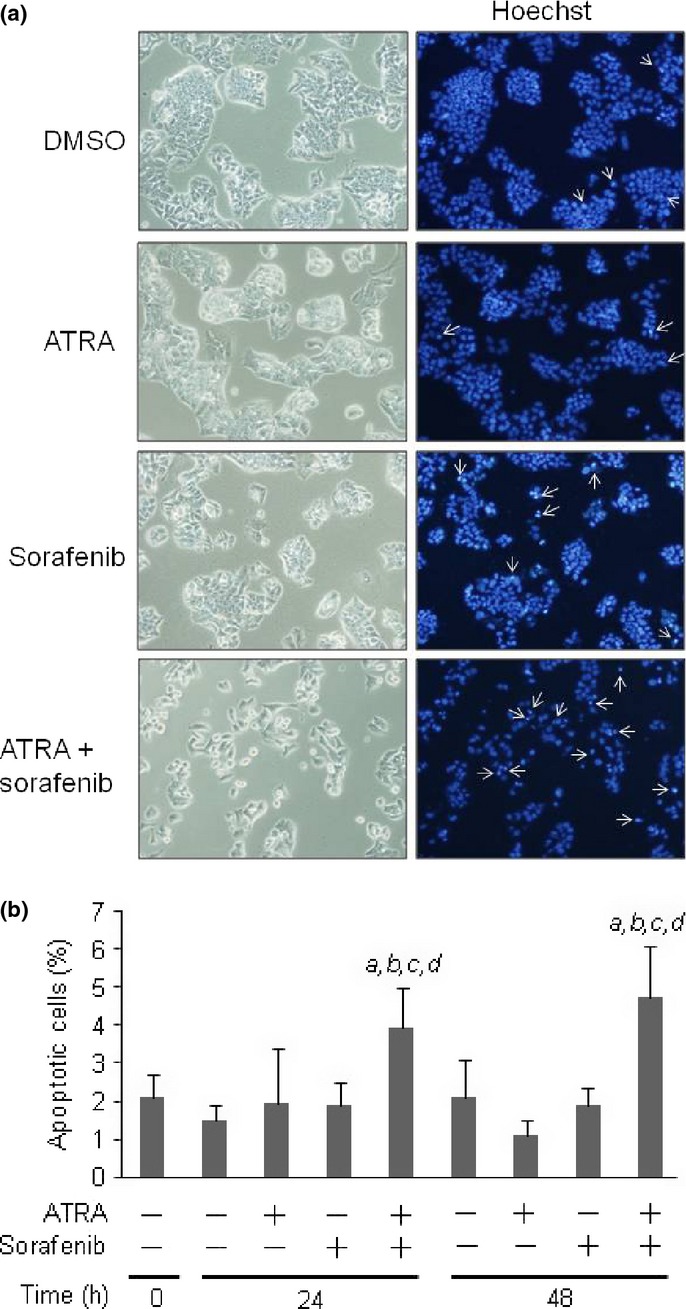
Combined treatment using sorafenib and all-trans retinoic acid (ATRA) increased the rate of apoptotic cell death. HepG2 hepatocellular carcinoma cells were treated with 0.1 μM sorafenib and 10 μM ATRA alone, or in combination, for 24 or 48 h. (a) Phase contrast images (left) and Hoechst staining images (right) of cells treated with DMSO, ATRA, sorafenib, and combined ATRA and sorafenib. Apoptotic cells are indicated by white arrows. (b) The number of apoptotic cells was quantified and presented as a percentage of the total cell number. Ten images were photographed from each group. A, P < 0.05 versus 0 h; b, P < 0.05 versus DMSO; c, P < 0.05 versus ATRA alone; d, P < 0.05 versus sorafenib alone.
Fig 6.
Combination treatment of all-trans retinoic acid (ATRA) and sorafenib induced apoptosis by enhancing the intrinsic mitochondrial apoptotic pathway. (a) Western blot analysis of Bcl-xL, Bcl-2, and Bax of cells treated with 0.1 μM sorafenib or 10 μM ATRA alone, or in combination, for 24 or 48 h. β-Actin served as a control of protein loading. (b) Western blot analysis of AMP-activated protein kinase (AMPK) phospho- (p-)AMPK, p-p38, p38, p-JNK, and JNK. (c) Identification of subcellular localization of Bax. Cytosolic (Cyto) and mitochondrial (Mito) fractions of the cells were analyzed by Western blot using anti-Bax, anti-α-tubulin (cytosolic marker), and anti-Cox IV (mitochondrial marker) antibodies. (d) Detection of pro-caspase-3 and cleaved caspase-3 in cells at 48 h after treatment. (e) Caspase-3/7 activity of the cells at 48 h after treatment. (f) Effect of AMPK knockdown on the viability of cells treated with sorafenib and ATRA. Upper, two siRNAs were validated for the suppression of AMPKα protein expression. Lower, cells were incubated with control- and AMPK-siRNA for 24 h, and then were subjected to the treatment indicated. WST assay was carried out 72 h after treatment. Experiments were run in triplicate and carried out twice on separate occasions. *P < 0.05, **P < 0.01 (g) Illustrative presentation of the mechanism of additional cytotoxicity induced by ATRA on hepatocellular carcinoma cells treated with sorafenib.
Discussion
In this study, we investigated the enhancing effect of retinoids on the cytotoxicity of sorafenib in HCC cells. Cell viability assays showed that the potency of the enhancing effect proved to be different, depending on the type of retinoids. As retinoids exert their effect through their binding to RARs or RXRs, their biological effects largely depend on the selectivity of receptors.16 All-trans retinoic acid is a natural ligand of all RAR isoforms (α, β, and γ) and is metabolized to 9-cis RA, which activates both RAR and RXR in the cells.23 NIK-333 activates RXRα with its agonistic activity and, additionally, is shown to restore the function of RXRα by inhibiting Ras–Erk signaling-mediated phosphorylation, which inactivates RXRα.24 Am80, a RARα/β-selective retinoid that does not bind and activate RARγ or RXR,25, showed no enhancing effect in this study. In pancreatic cancer cells, only pan-RAR and RARγ-selective agonists were shown to reduce cell viability.26 In combination with anticancer drugs, the enhanced cytotoxic effect on pancreatic cancer cells was observed in ATRA, 9-cis RA, and NIK-333.27,28 These reports and our data suggest that activation of the retinoid signal by RARγ and RXR plays an important role in this effect.
In the combination treatment, 5 and 10 μM ATRA showed similar levels of additional cytotoxicity. Similarly, the cytotoxicity of ATRA alone did not differ between 5 and 10 μM (Fig. S1). The level of AMPK activation was comparable between 5 and 10 μM ATRA (data not shown). Therefore, it is reasonable that the additional cytotoxic effect of ATRA did not differ among these concentrations.
To clarify the mechanism of the enhancing effect by ATRA, we focused on the energy metabolism of HCC cells. It is known that AMPK can function as an intracellular energy sensor, being activated when the cells meet the condition of energetic stress, such as ATP depletion.7 In this study, we found that ATRA, but not NIK-333, reduced the level of intracellular ATP and thereby activated AMPK. These observations suggest that ATRA reduces ATP production by inhibiting the energy-producing pathway in HCC cells. In the gene expression analyses, we found that ATRA downregulates the expression of GLUT-1 and LDHA, two important genes for glycolysis. The rate of glucose metabolism is regulated by glucose transport by Glut-1 and NAD+ recycling catalyzed by LDHA. Therefore, the crucial role of these genes for ATP production and cancer cell growth were reported in various types of cancer, including HCC. 29–33 Together, the downregulation of GLUT-1 and LDHA by ATRA may be responsible for the reduction of ATP and enhancement of the antitumor effect of sorafenib in HCC cells.
Downregulation of LDHA promotes the entry of pyruvate into mitochondria to form acetyl-coA, a substrate for the TCA cycle and oxidative phosphorylation.34 As cancer cells have been reported to have functional mitochondria, acetyl-coA is catabolized to yield ATP efficiently by oxidative phosphorylation in the presence of oxygen.35 Conversion of pyruvate to acetyl-coA is catalyzed by PDH, whose activity is negatively regulated through phosphorylation by PDKs. As ATRA upregulated PDK1, PDK2, and PDK3, which inactivates PDHA, carbon influx into the TCA cycle may be suppressed. This action leads to reduction in compensational ATP production from mitochondria when glycolytic ATP production is lowered.
The mechanism of downregulation of GLUT-1 and LDHA expression by ATRA remains to be further investigated. We found that putative RARE motifs are present in the upstream region of GLUT-1 and LDHA genes (data not shown). Therefore, direct regulation by ATRA in a RARE-dependent manner may exist. Alternatively, indirect regulation mediated by hypoxia-inducible factor-1α, a major inducer of glycolytic genes, may be involved in this phenomenon. All-trans retinoic acid upregulated IDHs, which catalyze the conversion of isocitrate to α-ketoglutarate in the TCA cycle. Therefore, activation of the α-ketoglutarate-dependent prolyl hydroxylase (PHD) may promote hypoxia-inducible factor-1 degradation.36 These mechanisms need to be further investigated to understand the glycolytic inhibition by ATRA.
Although AMPK is mainly considered to be a pro-survival kinase that promotes the catabolic pathway, its involvement in the induction of cell death has also been established, mostly in conditions of its sustained activation.37 It has been reported that p38 MAPK is a downstream substrate of the AMPK–MAPK kinase (MKK) axis, involving Bax translocation and induction of mitochondrial apoptosis.38,39 Moreover, activated p38 and JNK are reported to phosphorylate Bax and promote its conformational change, which facilitates translocation from the cytosol to mitochondria.22 Upregulation and activation of Bax were observed in the cells undergoing apoptosis induced by treatment with sorafenib or retinoids.40–42 This mechanism is consistent with the hypothesis that enduring bio-energetic crisis is a crucial factor that couples energy stress with apoptosis induction.37
All-trans retinoic acid had an additional cytotoxic effect on five anticancer drugs, namely sorafenib, adriamycin, cisplatin, mitomycin C, and 5-FU, but the level of cytotoxicity was different among these agents. In sorafenib treatment, Bax upregulation and translocation to mitochondria were the key events for additional cytotoxicity of ATRA. As ATRA sensitized cells to the mitochondria-mediated intrinsic apoptosis pathway, we examined the expression of p53, an important regulator of mitochondria-dependent cell death, in cells treated with these agents. Induction of p53 and phospho-p53, a stabilized form of p53, were observed in adriamycin-treated cells (Fig. S6). In mitochondria, p53 binds anti-apoptotic Bcl-2 and Bcl-xL, releasing the pro-apoptotic Bax–Bak complex and triggering apoptosis.43 Therefore, the cytotoxicity of adriamycin could be potentiated by ATRA treatment. Activation of caspase-8 and caspase-3 was reported to play a role in the apoptosis of mitomycin C-treated hepatoma cells.44 As caspase activation promotes Bax conformational change and its mitochondrial translocation, the cytotoxicity of mitomycin C may also be enhanced by ATRA. In cisplatin and 5-FU treatment, high concentrations such as 10 μM, where substantial apoptotic signals were exerted, were effective in showing the additional cytotoxicity of ATRA.
In conclusion, we showed the enhanced cytotoxic effects of sorafenib in cells treated with retinoids. Downregulation of glycolytic genes and reduced ATP production by ATRA induced AMPK activation and promoted the mitochondrial apoptotic pathway. These mechanisms provide an opportunity to improve the efficacy of chemotherapy by regulating the metabolic pathway crucial for the survival of cancer cells.
Acknowledgments
This work was supported by a Grant-in-Aid for Scientific Research from the Ministry of Education, Culture, Sports, Science and Technology, Japan.
Glossary
Abbreviations
- AMPK
AMP-activated protein kinase
- ATRA
all-trans retinoic acid
- 5-FU
5-fluorouracil
- HCC
hepatocellular carcinoma
- IDH
isocitrate dehydrogenase
- LDHA
lactate dehydrogenase A
- PDH
pyruvate dehydrogenase
- PDK
pyruvate dehydrogenase kinase
- RA
retinoic acid
- RAR
retinoic acid receptor
- RARE
retinoic acid response element
- RXR
retinoid X receptor
- TCA
tricarboxylic acid
Disclosure Statement
The authors have no conflict of interest.
Supporting Information
Additional supporting information may be found in the online version of this article:
Doc. S1. Supporting methods.
Fig. S1. Cell proliferation assay of HepG2 cells treated with retinoids and sorafenib.
Fig. S2. Cell viability assays of HepG2 cells treated with a combination of anticancer drugs and all-trans retinoic acid (ATRA).
Fig. S3. Cell viability assays of HepG2 cells treated with a combination of anticancer drugs and NIK-333.
Fig. S4. Cell viability assays of HepG2 cells treated with a combination of anticancer drugs and Am80.
Fig. S5. Western blots of phospho-vascular endothelial growth factor receptor 2 (VEGFR2), phospho-c-Raf, phospho-MEK1/2, and phospho-ERK in HepG2 cells treated with a combination of sorafenib and all-trans retinoic acid (ATRA).
Fig. S6. Western blot analyses of phospho-p53 and total p53 in HepG2 cells treated with a combination of anticancer drugs and all-trans retinoic acid (ATRA).
Table S1. Primers for quantitative RT-PCR analysis.
Table S2. Putative retinoic acid response elements (RAREs) found in the promoter region (−10 kb) of glycolytic and tricarboxylic acid cycle genes.
References
- Forner A, Llovet JM, Bruix J. Hepatocellular carcinoma. Lancet. 2012;379:1245–55. doi: 10.1016/S0140-6736(11)61347-0. [DOI] [PubMed] [Google Scholar]
- Bruix J, Sherman M. Management of hepatocellular carcinoma: an update. Hepatology. 2011;53:1020–2. doi: 10.1002/hep.24199. [DOI] [PMC free article] [PubMed] [Google Scholar]
- Llovet JM, Ricci S, Mazzaferro V, et al. Sorafenib in advanced hepatocellular carcinoma. N Engl J Med. 2008;359:378–90. doi: 10.1056/NEJMoa0708857. [DOI] [PubMed] [Google Scholar]
- Vander Heiden MG, Cantley LC, Thompson CB. Understanding the Warburg effect: the metabolic requirements of cell proliferation. Science. 2009;324:1029–33. doi: 10.1126/science.1160809. [DOI] [PMC free article] [PubMed] [Google Scholar]
- Hanahan D, Weinberg RA. Hallmarks of cancer: the next generation. Cell. 2011;144:646–74. doi: 10.1016/j.cell.2011.02.013. [DOI] [PubMed] [Google Scholar]
- Pelicano H, Martin DS, Xu RH, Huang P. Glycolysis inhibition for anticancer treatment. Oncogene. 2006;25:4633–46. doi: 10.1038/sj.onc.1209597. [DOI] [PubMed] [Google Scholar]
- Kuhajda FP. AMP-activated protein kinase and human cancer: cancer metabolism revisited. Int J Obes (Lond) 2008;32:S36–41. doi: 10.1038/ijo.2008.47. [DOI] [PMC free article] [PubMed] [Google Scholar]
- Cairns RA, Harris IS, Mak TW. Regulation of cancer cell metabolism. Nat Rev Cancer. 2011;11:85–95. doi: 10.1038/nrc2981. [DOI] [PubMed] [Google Scholar]
- Wald N, Boreham J, Bailey A. Serum retinol and subsequent risk of cancer. Br J Cancer. 1986;54:957–61. doi: 10.1038/bjc.1986.267. [DOI] [PMC free article] [PubMed] [Google Scholar]
- Larsson SC, Bergkvist L, Näslund I, Rutegård J, Wolk A. Vitamin A, retinol, and carotenoids and the risk of gastric cancer: a prospective cohort study. Am J Clin Nutr. 2007;85:497–503. doi: 10.1093/ajcn/85.2.497. [DOI] [PubMed] [Google Scholar]
- Toniolo P, Van Kappel AL, Akhmedkhanov A, Ferrari P, Kato I, Shore RE. Serum carotenoids and breast cancer. Am J Epidemiol. 2001;153:1142–7. doi: 10.1093/aje/153.12.1142. [DOI] [PubMed] [Google Scholar]
- Michaud DS, Feskanich D, Rimm EB, Colditz GA, Speizer FE, Willett WC. Intake of specific carotenoids and risk of lung cancer in 2 prospective US cohorts. Am J Clin Nutr. 2000;72:990–7. doi: 10.1093/ajcn/72.4.990. [DOI] [PubMed] [Google Scholar]
- Schenk JM, Riboli E, Chatterjee N, et al. Serum retinol and prostate cancer risk: a nested case–control study in the prostate, lung, colorectal, and ovarian cancer screening trial. Cancer Epidemiol Biomarkers Prev. 2009;18:1227–31. doi: 10.1158/1055-9965.EPI-08-0984. [DOI] [PMC free article] [PubMed] [Google Scholar]
- Yuan JM, Gao YT, Ong CN, Ross RK, Yu MC. Prediagnostic level of serum retinol in relation to reduced risk of hepatocellular carcinoma. J Natl Cancer Inst. 2006;98:482–90. doi: 10.1093/jnci/djj104. [DOI] [PubMed] [Google Scholar]
- Altucci L, Gronemeyer H. The promise of retinoids to fight against cancer. Nat Rev Cancer. 2001;1:181–93. doi: 10.1038/35106036. [DOI] [PubMed] [Google Scholar]
- Bastien J, Rochette-Egly C. Nuclear retinoid receptors and the transcription of retinoid-target genes. Gene. 2004;328:1–16. doi: 10.1016/j.gene.2003.12.005. [DOI] [PubMed] [Google Scholar]
- Yanagitani A, Yamada S, Yasui S, et al. Retinoic acid receptor alpha dominant negative form causes steatohepatitis and liver tumors in transgenic mice. Hepatology. 2004;40:366–75. doi: 10.1002/hep.20335. [DOI] [PubMed] [Google Scholar]
- Tsuchiya H, Akechi Y, Ikeda R, et al. Suppressive effects of retinoids on iron-induced oxidative stress in the liver. Gastroenterology. 2009;136:341–50. doi: 10.1053/j.gastro.2008.09.027. [DOI] [PubMed] [Google Scholar]
- Tsuchiya H, Ikeda Y, Ebata Y, et al. Retinoids ameliorate insulin resistance in a leptin-dependent manner in mice. Hepatology. 2012;56:1319–30. doi: 10.1002/hep.25798. [DOI] [PubMed] [Google Scholar]
- Muto Y, Moriwaki H, Saito A. Prevention of second primary tumors by an acyclic retinoid in patients with hepatocellular carcinoma. N Engl J Med. 1999;340:1046–7. doi: 10.1056/NEJM199904013401315. [DOI] [PubMed] [Google Scholar]
- Shimizu M, Sakai H, Shirakami Y, et al. Acyclic retinoid inhibits diethylnitrosamine-induced liver tumorigenesis in obese and diabetic C57BLKS/J- +(db)/+Lepr(db) mice. Cancer Prev Res (Phila) 2011;4:128–36. doi: 10.1158/1940-6207.CAPR-10-0163. [DOI] [PubMed] [Google Scholar]
- Kim BJ, Ryu SW, Song BJ. JNK- and p38 kinase-mediated phosphorylation of Bax leads to its activation and mitochondrial translocation and to apoptosis of human hepatoma HepG2 cells. J Biol Chem. 2006;281:21256–65. doi: 10.1074/jbc.M510644200. [DOI] [PubMed] [Google Scholar]
- Blomhoff R, Blomhoff HK. Overview of retinoid metabolism and function. J Neurobiol. 2006;66:606–30. doi: 10.1002/neu.20242. [DOI] [PubMed] [Google Scholar]
- Shimizu M, Takai K, Moriwaki H. Strategy and mechanism for the prevention of hepatocellular carcinoma: phosphorylated retinoid X receptor alpha is a critical target for hepatocellular carcinoma chemoprevention. Cancer Sci. 2009;100:369–74. doi: 10.1111/j.1349-7006.2008.01045.x. [DOI] [PMC free article] [PubMed] [Google Scholar]
- Takagi K, Suganuma M, Kagechika H, et al. Inhibition of ornithine decarboxylase induction by retinobenzoic acids in relation to their binding affinities to cellular retinoid-binding proteins. J Cancer Res Clin Oncol. 1988;114:221–4. doi: 10.1007/BF00405825. [DOI] [PubMed] [Google Scholar]
- Pettersson F, Dalgleish AG, Bissonnette RP, Colston KW. Retinoids cause apoptosis in pancreatic cancer cells via activation of RAR-gamma and altered expression of Bcl-2/Bax. Br J Cancer. 2002;87:555–61. doi: 10.1038/sj.bjc.6600496. [DOI] [PMC free article] [PubMed] [Google Scholar]
- Pettersson F, Colston KW, Dalgleish AG. Retinoic acid enhances the cytotoxic effects of gemcitabine and cisplatin in pancreatic adenocarcinoma cells. Pancreas. 2001;23:273–9. doi: 10.1097/00006676-200110000-00008. [DOI] [PubMed] [Google Scholar]
- Nakagawa T, Shimizu M, Shirakami Y, et al. Synergistic effects of acyclic retinoid and gemcitabine on growth inhibition in pancreatic cancer cells. Cancer Lett. 2009;273:250–6. doi: 10.1016/j.canlet.2008.08.004. [DOI] [PubMed] [Google Scholar]
- Amann T, Maegdefrau U, Hartmann A, et al. GLUT1 expression is increased in hepatocellular carcinoma and promotes tumorigenesis. Am J Pathol. 2009;174:1544–52. doi: 10.2353/ajpath.2009.080596. [DOI] [PMC free article] [PubMed] [Google Scholar]
- Liu Y, Cao Y, Zhang W, et al. A small-molecule inhibitor of glucose transporter 1 downregulates glycolysis, induces cell-cycle arrest, and inhibits cancer cell growth in vitro and in vivo. Mol Cancer Ther. 2012;11:1672–82. doi: 10.1158/1535-7163.MCT-12-0131. [DOI] [PubMed] [Google Scholar]
- Kitamura K, Hatano E, Higashi T, et al. Proliferative activity in hepatocellular carcinoma is closely correlated with glucose metabolism but not angiogenesis. J Hepatol. 2011;55:846–57. doi: 10.1016/j.jhep.2011.01.038. [DOI] [PubMed] [Google Scholar]
- Miao P, Sheng S, Sun X, Liu J, Huang G. Lactate dehydrogenase A in cancer: a promising target for diagnosis and therapy. IUBMB Life. 2013;65:904–10. doi: 10.1002/iub.1216. [DOI] [PubMed] [Google Scholar]
- Sheng SL, Liu JJ, Dai YH, Sun XG, Xiong XP, Huang G. Knockdown of lactate dehydrogenase A suppresses tumor growth and metastasis of human hepatocellular carcinoma. FEBS J. 2012;279:3898–910. doi: 10.1111/j.1742-4658.2012.08748.x. [DOI] [PubMed] [Google Scholar]
- Le A, Cooper CR, Gouw AM, et al. Inhibition of lactate dehydrogenase A induces oxidative stress and inhibits tumor progression. Proc Natl Acad Sci USA. 2010;107:2037–42. doi: 10.1073/pnas.0914433107. [DOI] [PMC free article] [PubMed] [Google Scholar]
- Weinberg F, Chandel NS. Mitochondrial metabolism and cancer. Ann N Y Acad Sci. 2009;1177:66–73. doi: 10.1111/j.1749-6632.2009.05039.x. [DOI] [PubMed] [Google Scholar]
- Majmundar AJ, Wong WJ, Simon MC. Hypoxia-inducible factors and the response to hypoxic stress. Mol Cell. 2010;40:294–309. doi: 10.1016/j.molcel.2010.09.022. [DOI] [PMC free article] [PubMed] [Google Scholar]
- Cardaci S, Filomeni G, Ciriolo MR. Redox implications of AMPK-mediated signal transduction beyond energetic clues. J Cell Sci. 2012;125:2115–25. doi: 10.1242/jcs.095216. [DOI] [PubMed] [Google Scholar]
- Capano M, Crompton M. Bax translocates to mitochondria of heart cells during simulated ischaemia: involvement of AMP-activated and p38 mitogen-activated protein kinases. Biochem J. 2006;395:57–64. doi: 10.1042/BJ20051654. [DOI] [PMC free article] [PubMed] [Google Scholar]
- Xi X, Han J, Zhang JZ. Stimulation of glucose transport by AMP-activated protein kinase via activation of p38 mitogen-activated protein kinase. J Biol Chem. 2001;276:41029–34. doi: 10.1074/jbc.M102824200. [DOI] [PubMed] [Google Scholar]
- Gonda K, Tsuchiya H, Sakabe T, et al. Synthetic retinoid CD437 induces mitochondria-mediated apoptosis in hepatocellular carcinoma cells. Biochem Biophys Res Commun. 2008;370:629–33. doi: 10.1016/j.bbrc.2008.04.008. [DOI] [PubMed] [Google Scholar]
- Zhang W, Konopleva M, Ruvolo VR, et al. Sorafenib induces apoptosis of AML cells via Bim-mediated activation of the intrinsic apoptotic pathway. Leukemia. 2008;22:808–18. doi: 10.1038/sj.leu.2405098. [DOI] [PubMed] [Google Scholar]
- Kurosu T, Ohki M, Wu N, Kagechika H, Miura O. Sorafenib induces apoptosis specifically in cells expressing BCR/ABL by inhibiting its kinase activity to activate the intrinsic mitochondrial pathway. Cancer Res. 2009;69:3927–36. doi: 10.1158/0008-5472.CAN-08-2978. [DOI] [PubMed] [Google Scholar]
- Chi SW. Structural insights into the transcription-independent apoptotic pathway of p53. BMB Rep. 2014;47:167–72. doi: 10.5483/BMBRep.2014.47.3.261. [DOI] [PMC free article] [PubMed] [Google Scholar]
- Liedtke C, Lambertz D, Schnepel N, Trautwein C. Molecular mechanism of Mitomycin C-dependent caspase-8 regulation: implications for apoptosis and synergism with interferon-alpha signalling. Apoptosis. 2007;12:2259–70. doi: 10.1007/s10495-007-0145-x. [DOI] [PubMed] [Google Scholar]
Associated Data
This section collects any data citations, data availability statements, or supplementary materials included in this article.
Supplementary Materials
Doc. S1. Supporting methods.
Fig. S1. Cell proliferation assay of HepG2 cells treated with retinoids and sorafenib.
Fig. S2. Cell viability assays of HepG2 cells treated with a combination of anticancer drugs and all-trans retinoic acid (ATRA).
Fig. S3. Cell viability assays of HepG2 cells treated with a combination of anticancer drugs and NIK-333.
Fig. S4. Cell viability assays of HepG2 cells treated with a combination of anticancer drugs and Am80.
Fig. S5. Western blots of phospho-vascular endothelial growth factor receptor 2 (VEGFR2), phospho-c-Raf, phospho-MEK1/2, and phospho-ERK in HepG2 cells treated with a combination of sorafenib and all-trans retinoic acid (ATRA).
Fig. S6. Western blot analyses of phospho-p53 and total p53 in HepG2 cells treated with a combination of anticancer drugs and all-trans retinoic acid (ATRA).
Table S1. Primers for quantitative RT-PCR analysis.
Table S2. Putative retinoic acid response elements (RAREs) found in the promoter region (−10 kb) of glycolytic and tricarboxylic acid cycle genes.


