

Abstract
We previously reported that the cell adhesion molecule 1 (CADM1) versus CD7 plot in flow cytometry reflects disease progression in human T-cell leukemia virus type 1 (HTLV-1) infection. In CD4+ cells from peripheral blood, CADM1−CD7+ (P), CADM1+CD7dim (D) and CADM1+CD7− (N) subpopulations are observed. The D and N subpopulations increase as asymptomatic HTLV-1 carriers (AC) progress to indolent adult T-cell leukemia-lymphoma (ATL) and the N subpopulation then expands in aggressive ATL. In the present study we examined whether the analysis can estimate the risk of developing ATL in advanced AC. Peripheral blood samples from AC (N = 41) and indolent ATL patients (N = 19) were analyzed by flow cytometry using the CADM1 versus CD7 plot for CD4+ cells and inverse long PCR (clonality analysis) of FACS-sorted subpopulations. Almost all AC with a high HTLV-1 proviral load (>4 copies/100 cells) had a CADM1+ (D + N) frequency of >10%. AC with 25% < CADM1+ ≤ 50% contained expanded clones similar to smoldering-type ATL. In many patients in the 25% < CADM1+ ≤ 50% group, the proportion of abnormal lymphocytes was distributed around the 5% line, which divides AC and smoldering-type ATL in Shimoyama's classification. In conclusion, the CADM1 versus CD7 plot is useful for selection of putative high-risk AC. The characteristics of some AC and smoldering ATL are said to be similar; however, long-term follow up is required and the clinical outcome (e.g. rate of transformation) of these cases should be used to determine whether to include them in the same clinical category.
Keywords: Adult T-cell leukemia-lymphoma, CADM1 protein, CD7 antigen, flow cytometry, HTLV-1
Human T-cell leukemia virus type 1 (HTLV-1) is a human retrovirus that causes HTLV-1–associated diseases such as adult T-cell leukemia-lymphoma (ATL, a neoplastic disease of CD4+ T cells), HTLV-1-associated myelopathy/tropical spastic paraparesis (HAM, a chronic inflammatory disease of the central nervous system) and HTLV-1 uveitis (HU, a sub-acute inflammatory disease of the uvea).1–3 A recent report estimated that 5–10 million people are HTLV-1-infected worldwide.4 In Japan, the estimated lifetime risk of developing ATL in HTLV-1 asymptomatic carriers (AC) is 6–7% for males and 2–3% for females.5–7
We recently developed a flow cytometry-based method that enables HTLV-1-infected and clonally expanding cells to be purified.8–10 In the cell adhesion molecule 1 (CADM1) versus CD7 plot for CD4+ cells in peripheral blood mononuclear cells (PBMC) from HTLV-1-infected patients, three subpopulations (P, CADM1−CD7+; D, CADM1+CD7dim; and N, CADM1+CD7−) are consistently observed.10 HTLV-1-infected cell clones are enriched in the CADM1+ subpopulations (D and N). In the early stage of ATL development (from AC to indolent ATL), the D and N subpopulations increase concomitantly with clonal growth of these subpopulations. In the late stage (from indolent ATL to aggressive ATL), the N subpopulation expands, indicating loss of CD7 in the CADM1+ subpopulations. Therefore, the CADM1 versus CD7 profile enables objective evaluation of HTLV-1 disease progression regardless of the disease stage in HTLV-1 infection.
Factors associated with development of ATL have been reported to include HTLV-1 infection through breastfeeding, advanced age and family history of ATL.7,11 A recent epidemiological study in Japan revealed that AC with a high proviral load (PVL, more than four copies per 100 PBMC) are at high risk of developing ATL.12 Other definitive risk factors for the development of ATL have not been determined.
In this study we propose that our flow cytometry (CADM1 versus CD7 plot) will help to identify high-risk AC. The flow cytometric profiles of AC varied widely, with some AC having increased CADM1+ subpopulations to the same degree as indolent ATL. These AC were indistinct from early-stage indolent ATL based on the CADM1 versus CD7 profile, clonality analysis and clinical data (PVL and percentage of abnormal lymphocytes). Our flow cytometric analysis revealed that some AC and smoldering ATL have similar characteristics, indicating the need for careful clinical follow up of these cases and that flow cytometry can be used to identify putative high-risk AC.
Materials and Methods
Cell lines and patient samples
TL-Om1, an HTLV-1-infected cell line, was provided by Dr Sugamura (Tohoku University, Sendai, Japan). Peripheral blood samples were collected from inpatients and outpatients at our hospital from June 2011 to September 2014, as described in our previous reports.8–10 As shown in Table1 cases were analyzed (41 AC; 9 cases of smoldering-type ATL; 10 cases of chronic-type ATL). All patients with ATL were categorized into clinical subtypes according to Shimoyama's criteria.13,14 Patients with various complications, such as autoimmune disorders and systemic infections, were excluded. The present study was approved by the Institutional Review Board of our institute (University of Tokyo). Written informed consent was obtained from all patients.
Table 1.
Clinical profile of HTLV-1 infected patients in the present study
| Clinical subtype | Number of cases | Male | Female | Age (range) | WBC (per μL) (range) | Lymphocytes (%) (range) | Abnormal lymphocytes (%) (range) |
|---|---|---|---|---|---|---|---|
| HTLV-1 AC | 41 | 14 | 27 | 52.8 (31–69) | 5694 (3110–10360) | 33.0 (17.5–44.5) | 1.9 (0.0–4.7) |
| Smoldering | 9 | 3 | 6 | 56.0 (43–72) | 5561 (2620–7270) | 29.9 (11.0–39.5) | 9.3 (5.0–24.5) |
| Chronic | 10 | 5 | 5 | 54.3 (43–67) | 12345 (7780–25570) | 31.6 (5.5–64.0) | 32.1 (6.0–60.5) |
Average of age, WBC, lymphocytes (%) and abnormal lymphocytes (%) are shown. Proportion of abnormal lymphocytes in the peripheral blood WBC were evaluated by morphological examination. AC, asymptomatic carrier; HTLV-1, human T-cell leukemia virus type 1; WBC, white blood cells (normal range, 3500–9100/μL).
Flow cytometry and cell sorting
Peripheral blood mononuclear cells were isolated from whole blood by density gradient centrifugation, as described previously.8 An unlabeled CADM1 antibody (clone 3E1) and an isotype control chicken IgY antibody were purchased from MBL (Nagoya, Japan). These were biotinylated (by primary amine biotinylation) using biotin N-hydroxysuccinimide ester (Sigma Aldrich, St. Louis, MO, USA). A Pacific Orange-conjugated anti-CD14 antibody was purchased from Life Technologies (Carlsbad, CA, USA). All other antibodies were obtained from BioLegend (San Diego, CA, USA). Cells were stained using a combination of biotin-CADM1, allophycocyanin (APC)-CD7, APC-Cy7-CD3, Pacific Blue-CD4 and Pacific Orange-CD14. After washing, phycoerythrin (PE)-conjugated streptavidin was applied. Propidium iodide (PI [Sigma Aldrich]) was added to the samples to stain dead cells immediately before flow cytometry. A FACSAria instrument (BD Immunocytometry Systems, San Jose, CA, USA) was used for all multicolor flow cytometry and fluorescence-activated cell sorting (FACS). Data were analyzed using the FlowJo software (TreeStar, San Carlos, CA, USA). The gating procedure was as described previously.10 Briefly, PI+ cells and then CD14+ cells were gated out. Next, a CADM1 versus CD7 plot for CD4+ cells was constructed (Fig.1a).
Fig 1.

The cell adhesion molecule 1 (CADM1) versus CD7 profile in asymptomatic HTLV-1 carriers (AC) correlates with proviral load (PVL). (a) A representative CADM1 versus CD7 profile for CD4+ cells. P (CADM1−CD7+), D (CADM1+CD7dim) and N (CADM1+CD7−) subpopulations were gated according to our previous report.10 (b) Almost all AC with PVL >4 copies/100 peripheral blood mononuclear cells (PBMC) had CADM1+ (D + N) values of more than 10% in the CADM1 versus CD7 plot, and almost all AC with PVL <4 copies/100 PBMC had CADM1+ values of <10%.
Quantification of human T-cell leukemia virus type 1 proviral load by real-time quantitative PCR
Proviral load in FACS-sorted PBMC was quantified by real-time quantitative PCR (TaqMan method) using the ABI Prism 7000 sequence detection system (Applied Biosystems, Foster City, CA, USA), as described previously.8,12
Inverse long PCR to assess the clonality of human T-cell leukemia virus type 1-infected cells
For clonality analysis, inverse long PCR was performed as described previously.8 First, 1 μg of genomic DNA extracted from FACS-sorted cells was digested with PstI at 37°C overnight. RNase A (Qiagen, Hilden, Germany) was added to remove residual RNA completely. DNA fragments were purified using a QIAEX2 gel extraction kit (Qiagen). The purified DNA was self-ligated with T4 DNA ligase (Takara Bio, Otsu, Japan) at 16°C overnight. Inverse long PCR was performed using Tks Gflex DNA Polymerase (Takara Bio). The forward primer was 5′-CAGCCCATTCTATAGCACTCTCCAGGAGAG-3′ and the reverse primer was 5′-CAGTCTCCAAACACGTAGACTGGGTATCCG-3′. Processed genomic DNA (50 ng) was used as the template. The reaction mixture was subjected to 35 cycles of denaturation (94°C, 30 s) and annealing plus extension (68°C, 8 min). The PCR products were subjected to electrophoresis on 0.8% agarose gels. For samples from which a sufficient amount of DNA was extracted, PCR was generally performed in duplicate.
Statistical analyses
Statistical comparisons were performed by Kruskal–Wallis non-parametric anova and Dunn's procedure for pairwise comparisons using GraphPad Prism version 5.0a (GraphPad Software, San Diego, CA, USA). P < 0.05 was taken to indicate statistical significance.
Results
Asymptomatic carriers with high proviral load have increased CADM1+ subpopulations
Because high PVL (more than four copies per 100 PBMC) is one of the major risk factors for AC to develop ATL,12 we first analyzed the relationship between the CADM1 versus CD7 profile and PVL. A representative CADM1 versus CD7 profile is shown in Figure1(a). As shown in Figure1(b), almost all AC with high PVL had CADM1+ (D + N) subpopulations of >10% (24 of 25 cases). Conversely, AC with a CADM1+ population of ≤10% predominate in those with a PVL of fewer than four copies per 100 PBMC (15 of 16 cases). In this study, CADM1+ (%) indicates the proportion of CD4+ cells that were CADM1+ unless otherwise stated. PVL indicates the number of HTLV-1 copies/100 PBMC (HTLV-1-infected T cells generally contain a single integrated provirus).15 To compare both factors directly, the CADM1+ (%) for PBMC was calculated by taking the percentage of CD4+ cells and all lymphocytes into account. As shown in Figure S1, the CADM1+ (%) for PBMC was nearly equal to the PVL in AC.
Clonality analysis of CADM1+ subpopulations in asymptomatic carriers and indolent ATL
The three subpopulations (P, D and N) in the CADM1 versus CD7 plot were FACS-sorted and subjected to clonality analysis (by inverse long PCR). Representative cases are shown in Figure2(a). The observed band patterns were classified into “polyclonal,” “oligoclonal” and “major clone” states according to the number and density of clonal bands. The polyclonal state was defined as barely visible bands. The oligoclonal state was defined as a ladder-like band pattern without dominant bands, and the major clone state was defined as one or more dominant intense bands. Progression from a polyclonal state to a major clone state seemed to correlate with increases in the CADM1+ (D and N) subpopulations. Figure2(b) shows all cases analyzed by both flow cytometry and inverse long PCR and shows provisional diagonal lines indicating CADM1+ (D + N) = 10%, 25% and 50%. A large majority of cases distributed in the CADM1+ ≤ 10% area were AC with a polyclonal pattern and there were no smoldering-type ATL cases. All cases distributed in the 10% < CADM1+ ≤ 25% area were also AC but those with an oligoclonal pattern dominated. In the 25% < CADM1+ ≤ 50% area, AC and smoldering-type ATL cases were intermingled and all cases showed an oligoclonal or major clone pattern (Fig.2b, left). Some smoldering-type ATL cases were distributed in the 50% < CADM1+ area and all cases showed a major clone pattern. All but one of the chronic ATL cases were distributed in the 50% < CADM1+ area and showed a major clone pattern (Fig.2b, right).
Fig 2.

Clonality analysis of the FACS-sorted subpopulations in the cell adhesion molecule 1 (CADM1) versus CD7 plot. (a) Three representative cases are shown. The three subpopulations (P, D and N) in the CADM1 versus CD7 plot were FACS-sorted and subjected to inverse long PCR. The observed band patterns were classified into “polyclonal” (left), “oligoclonal” (left middle) and “major clone” (right middle and right) states according to the number and density of the clonal bands. (b) Summary of all analyzed asymptomatic HTLV-1 carriers (AC) (left), cases of smoldering-type ATL (left) and chronic-type ATL (right). The two-dimensional plot shows the D and N subpopulation proportions for each case. The diagonal lines indicate CADM1+ (D + N) = 10%, 25% and 50%.
Correlation of CADM1 versus CD7 profile with percentage of abnormal lymphocytes
Figure3 shows the percentage of abnormal lymphocytes in peripheral blood from the cases in each group, classified according to CADM1+ (D + N) proportion. The dotted line indicates 5%, which is the borderline between AC and smoldering-type ATL according to Shimoyama's classification.13,14 All cases in the CADM1+ ≤ 10% and 10% < CADM1+ ≤ 25% areas are AC, as described above. No case in these groups reached the 5% line. The 25% < CADM1+ ≤ 50% group includes smoldering-type ATL and AC with high PVL and clonal expansion (Figs1b,2). Intriguingly, the proportions of abnormal lymphocytes in the cases in this group were distributed around the 5% line. The 50% < CADM1+ group was dominated by chronic-type ATL. Most cases in this group showed a proportion of abnormal lymphocytes far above 5%.
Fig 3.
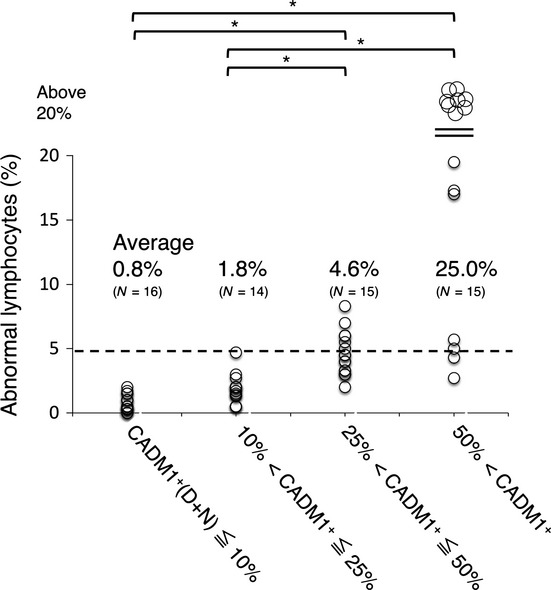
Percentages of abnormal lymphocytes in groups classified by CADM1+ (%) in the CADM1 versus CD7 plot. All cases were classified into four groups according to CADM1+ (%): CADM1+ ≤ 10%, 10% < CADM1+ ≤ 25%, 25% < CADM1+ ≤ 50% and 50% < CADM1+ (see also Fig.2b). The dotted line (5% abnormal lymphocytes) indicates the borderline between asymptomatic HTLV-1 carriers (AC) and smoldering-type ATL according to Shimoyama's classification. The 25% < CADM1+ ≤ 50% group includes smoldering-type ATL and AC with high PVL and major clones (see also Figs1 and 2). *P < 0.05. CADM1, cell adhesion molecule 1.
Figure4 shows serial changes in the percentage of abnormal lymphocytes during 39 months of observation. In all cases except for one in the CADM1+ ≤ 10% and 10% < CADM1+ ≤ 25% groups, the proportion of abnormal lymphocytes did not exceed 5%. Intriguingly, in the majority of cases in the 25% < CADM1+ ≤ 50% group (11 of 15 cases), the proportion of abnormal lymphocytes fluctuated on the 5% line during the observation period. In most of the cases in the 50% < CADM1+ group, the proportion of abnormal lymphocytes greatly exceeded 5% during the observation period.
Fig 4.
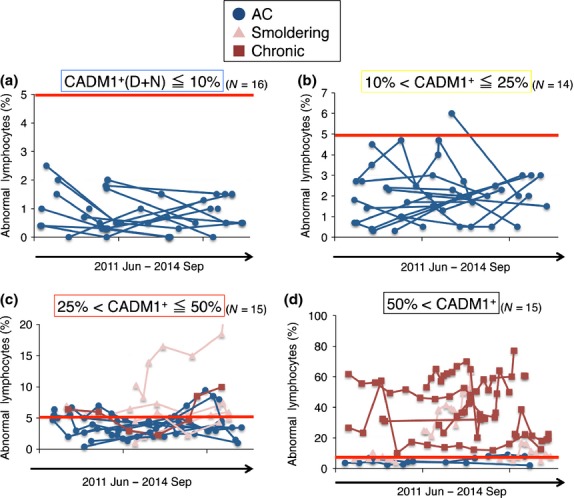
Serial changes in abnormal lymphocytes (%) in groups classified by CADM1+ (%) in the CADM1 versus CD7 plot. (a) Data for the CADM1+ ≤ 10% group. The red line (5% abnormal lymphocytes) indicates the borderline between asymptomatic HTLV-1 carriers (AC) and smoldering-type ATL according to Shimoyama's classification. (b) Data for the 10% < CADM1+ ≤ 25% group. (c) Data for the 25% < CADM1+ ≤ 50% group. In many cases, the proportion of abnormal lymphocytes fluctuated around the 5% line (the AC/smoldering ATL borderline) during the observation period. (d) Data for the 50% < CADM1+ group. CADM1, cell adhesion molecule 1.
In summary, AC and indolent ATL can be classified according to the proportion of the CADM1+ subpopulations ([D + N] %) in the CADM1 versus CD7 plot). The CADM1+ ≤ 10% group includes mainly polyclonal AC with low PVL (<4 copies per 100 PBMC). The 10% < CADM1+ ≤ 25% group includes oligoclonal AC with high PVL (>4 copies per 100 PBMC). The 25% < CADM1+ ≤ 50% group includes smoldering-type ATL and AC with major clones. Importantly, in many cases in this group the proportion of abnormal lymphocytes fluctuated around 5% (the AC/smoldering ATL borderline). The 50% < CADM1+ group includes chronic-type and advanced smoldering-type ATL.
Discussion
Clonally expanded HTLV-1-infected cells can be purified using cell-surface markers such as CCR4 and CD25, which have been utilized for molecular-targeted therapy.14,16 However, the expression levels of these markers vary among patients. A major advantage of our flow cytometry method incorporating CD3, CD7 and CADM1 is the separation of these cells with high purity from PBMC from AC as well as ATL patients, which was previously impossible.10,17,18 HTLV-1-infected and clonally expanding cells are enriched in the CADM1+ subpopulations (D and N), and progression of initial oncogenesis in these cells is reflected in the increases in D and N. In the late oncogenic process, tumor cells are generally represented by a loss of CD7 on CADM1+ cells in the CD4+ population (i.e. N is dominant in most aggressive ATL). The CADM1 versus CD7 plot consequently reflects disease progression in HTLV-1 infection.10
In this study, we used CADM1+ ([D + N] %) as an indicator of the initial oncogenic process in AC and indolent ATL. Intriguingly, the degree of dominance in D or N (i.e. N/D ratios) varied among the cases (Fig.2b). We believe that the D and N populations are similar, but that they have unique features. For example, we previously showed that the expression of miR-31 (a microRNA with a suppressive effect on NF-κB signaling) was different between D and N cells; miR-31 was suppressed more profoundly in N than in D cells.10,19 It is necessary to determine how the N/D ratio contributes to the estimation of the oncogenic status of HTLV-1-infected cells.
Previous studies reported AC with various clonal statuses using methods including Southern blot analysis and PCR amplification of the HTLV-1 provirus integration sites.20–22 Although Southern blot analysis of the clonal integration of an HTLV-1 provirus is the current standard for detection of HTLV-1-infected clonal cells,23 this method is not sensitive for detection of minor clones. Moreover, in most previous reports, total PBMC were used as experimental materials. Our flow cytometry method has major advantages. First, by enrichment of HTLV-1-infected cells in the CADM1+ subpopulations and subsequent inverse long PCR, detection of expanding clones can be more sensitive and evaluation of clonal status more accurate. Second, the CADM1 versus CD7 plot can be used to estimate the clonal status in AC as well as ATL, even without further molecular analysis (Fig.2b). Although next-generation sequencing of HTLV-1 integration sites has been developed for accurate analysis of clonality,24–26 our flow cytometry method (CADM1 versus CD7 plot) is simple, fast and quantitative, and will directly help in clinical management of HTLV-1-infected patients.
Using this method, we showed that AC have a variety of clonality types (Fig.2b). Increases in the CADM1+ (D + N) subpopulations correlated well with clonal expansion indicated by the “polyclonal,” “oligoclonal” and “major clone” states, which were roughly divided by the CADM1+ = 10% and 25% lines. These data imply that oncogenic progression of each AC can be estimated by our flow cytometric analysis, and an increase in CADM1+ (%) in AC will mean that they are at relatively high risk of developing ATL. Although AC with high PVL exist in both the 10% < CADM1+ ≤ 25% and 25% < CADM1+ ≤ 50% groups, those in the former group are chiefly AC with oligoclonal expansion, and the latter are oligoclonal AC and AC with major clones. To reveal the relative risks of both groups will require prospective long-term observation of ATL development. Over approximately 3 years of follow up, only one AC that had a very high CADM1+ (%) (D + N = 65.7%, UPN 50) progressed to chronic-type ATL.
A prospective nationwide cohort study of AC by Iwanaga et al.12 revealed that PVL of AC have a wide range and that AC with high PVL (>4 copies/100 PBMC) are at high risk of developing ATL. As shown in Figure1(b), CADM1+ ([D + N] %) in the CADM1 versus CD7 plot correlated with PVL. Almost all of the cases with PVL < 4 copies/100 PBMC were included in the CADM1+ ≤ 10% group, which is consistent with the finding that AC in the CADM1+ ≤ 10% group were polyclonal (Fig.2b). As shown in Figure S1, when the proportions of lymphocytes and CD4+ cells were taken into account, the CADM1+ (%) for PBMC (not CD4+ cells) was found to approximately match the PVL. Considering that HTLV-1-infected cells are highly enriched in the CADM1+ population,10 this is a reasonable result. Therefore, our flow cytometric technique could be utilized as a surrogate marker for PVL. Furthermore, FACS and additional molecular analyses of purified HTLV-1 clones is possible.10 We found that clonal status was relevant to the CADM1+ (%) in this study (Fig.2), which was not possible using PVL analysis. Finally, our flow cytometric technique is simpler and easier to use for clinical testing compared to current methods for determining PVL.
The 25% < CADM1+ ≤ 50% group included both advanced AC and smoldering-type ATL (Fig.2b). Their HTLV-1-infected cells in peripheral blood were oligoclonal or contained major expanding clones. The CADM1 versus CD7 profile and clonality analysis could not distinguish between AC and smoldering-type ATL patients in this group. Intriguingly, abnormal lymphocytes in the 25% < CADM1+ ≤ 50% group were centered on 5% (Fig.3). We consider that many cases included in this group are the AC/smoldering ATL borderline cases classified by Shimoyama's classification. In these cases, current clinical classification depends on microscopic counting of these cells,13,14 although nuclear indentation in the abnormal lymphocytes is often ambiguous.27 Observation of abnormal lymphocytes in these cases for more than 3 years (Fig.4) revealed that many cases in the 25% < CADM1+ ≤ 50% group (11 of 15 cases) showed fluctuation of the abnormal lymphocyte proportion at 5% (the AC/smoldering ATL borderline). It is thus highly probable that diagnosis of such cases might differ depending on when or by which examiners they were diagnosed (e.g. a smoldering-type ATL patient with 5.5% abnormal lymphocytes might be diagnosed as an AC if the abnormal lymphocyte count at the next visit is 4.5%). To prevent confusion, the objective CADM1 versus CD7 plot will help classification of these cases. The AC and smoldering-type ATL cases included in the 25% < CADM1+ ≤ 50% group are believed to have similar characteristics because all of our analyses, including flow cytometry, clonality analysis and abnormal lymphocyte analysis, failed to distinguish between these two cases. However, long-term follow up is required and the clinical outcome (e.g. rate of transformation) of these cases should be used to determine whether to include them in the same clinical category.
Finally, AC and indolent ATL will be divided into four groups based on the CADM1 versus CD7 plot. This method revealed the diversity of disease stages in AC as well as ATL, and will help us to identify advanced AC with a similar disease status to indolent ATL patients at an early stage. Some cases of smoldering ATL and AC could not be distinguished; therefore, a new clinical category that includes these cases is warranted.
Acknowledgments
We thank Mr Yuji Zaike (Clinical Laboratory, Research Hospital, Institute of Medical Science, University of Tokyo) for his excellent technical advice. We thank Mr Keisuke Takahashi, Ms Sanae Suzuki and members of our laboratory for assistance. We are grateful to the hospital staff, who have made a commitment to providing high-quality care to all of our patients. This work was supported by Grants for Scientific Research (22591028 [K.U.], 23390250 [T.W.]) from the Ministry of Education, Culture, Sports, Science and Technology of Japan, and by Health and Labour Sciences Research Grants (H26-sinkoujitsuyuoka-ippan-013 [K.U., T.W.]) from the Ministry of Health, Labor and Welfare of Japan.
Disclosure Statement
The authors have no conflict of interest to declare.
Supporting Information
Additional supporting information may be found in the online version of this article:
Fig. S1. Correlation of proviral load (PVL) and CADM1+ (%) in the CADM1 versus CD7 plot.
References
- Mochizuki M, Watanabe T, Yamaguchi K, et al. HTLV-I uveitis: a distinct clinical entity caused by HTLV-I. Jpn J Cancer Res. 1992;83:236–9. doi: 10.1111/j.1349-7006.1992.tb00092.x. [DOI] [PMC free article] [PubMed] [Google Scholar]
- Yoshida M, Miyoshi I, Hinuma Y. Isolation and characterization of retrovirus from cell lines of human adult T-cell leukemia and its implication in the disease. Proc Natl Acad Sci U S A. 1982;79:2031–5. doi: 10.1073/pnas.79.6.2031. [DOI] [PMC free article] [PubMed] [Google Scholar]
- Osame M, Usuku K, Izumo S, et al. HTLV-I associated myelopathy, a new clinical entity. Lancet. 1986;1:1031–2. doi: 10.1016/s0140-6736(86)91298-5. [DOI] [PubMed] [Google Scholar]
- Gessain A, Cassar O. Epidemiological aspects and world distribution of HTLV-1 infection. Front Microbiol. 2012;3:388. doi: 10.3389/fmicb.2012.00388. [DOI] [PMC free article] [PubMed] [Google Scholar]
- Yamaguchi K, Watanabe T. Human T lymphotropic virus type-I and adult T-cell leukemia in Japan. Int J Hematol. 2002;76(Suppl 2):240–5. doi: 10.1007/BF03165123. [DOI] [PubMed] [Google Scholar]
- Murphy EL, Hanchard B, Figueroa JP, et al. Modelling the risk of adult T-cell leukemia/lymphoma in persons infected with human T-lymphotropic virus type I. Int J Cancer. 1989;43:250–3. doi: 10.1002/ijc.2910430214. [DOI] [PubMed] [Google Scholar]
- Iwanaga M, Watanabe T, Yamaguchi K. Adult T-cell leukemia: a review of epidemiological evidence. Front Microbiol. 2012;3:322. doi: 10.3389/fmicb.2012.00322. [DOI] [PMC free article] [PubMed] [Google Scholar]
- Tian Y, Kobayashi S, Ohno N, et al. Leukemic T cells are specifically enriched in a unique CD3(dim) CD7(low) subpopulation of CD4(+) T cells in acute-type adult T-cell leukemia. Cancer Sci. 2011;102:569–77. doi: 10.1111/j.1349-7006.2010.01833.x. [DOI] [PubMed] [Google Scholar]
- Kobayashi S, Tian Y, Ohno N, et al. The CD3 versus CD7 Plot in multicolor flow cytometry reflects progression of disease stage in patients infected with HTLV-I. PLoS ONE. 2013;8:e53728. doi: 10.1371/journal.pone.0053728. [DOI] [PMC free article] [PubMed] [Google Scholar]
- Kobayashi S, Nakano K, Watanabe E, et al. CADM1 expression and stepwise downregulation of CD7 are closely associated with clonal expansion of HTLV-I-infected cells in adult t-cell leukemia/lymphoma. Clin Cancer Res. 2014;20:2851–61. doi: 10.1158/1078-0432.CCR-13-3169. [DOI] [PubMed] [Google Scholar]
- Hisada M, Okayama A, Shioiri S, Spiegelman DL, Stuver SO, Mueller NE. Risk factors for adult T-cell leukemia among carriers of human T-lymphotropic virus type I. Blood. 1998;92:3557–61. [PubMed] [Google Scholar]
- Iwanaga M, Watanabe T, Utsunomiya A, et al. Human T-cell leukemia virus type I (HTLV-1) proviral load and disease progression in asymptomatic HTLV-1 carriers: a nationwide prospective study in Japan. Blood. 2010;116:1211–9. doi: 10.1182/blood-2009-12-257410. [DOI] [PubMed] [Google Scholar]
- Shimoyama M. Diagnostic criteria and classification of clinical subtypes of adult T-cell leukaemia-lymphoma. A report from the Lymphoma Study Group (1984–87) Br J Haematol. 1991;79:428–37. doi: 10.1111/j.1365-2141.1991.tb08051.x. [DOI] [PubMed] [Google Scholar]
- Tsukasaki K, Hermine O, Bazarbachi A, et al. Definition, prognostic factors, treatment, and response criteria of adult T-cell leukemia-lymphoma: a proposal from an international consensus meeting. J Clin Oncol. 2009;27:453–9. doi: 10.1200/JCO.2008.18.2428. [DOI] [PMC free article] [PubMed] [Google Scholar]
- Cook LB, Rowan AG, Melamed A, Taylor GP, Bangham CR. HTLV-1-infected T cells contain a single integrated provirus in natural infection. Blood. 2012;120:3488–90. doi: 10.1182/blood-2012-07-445593. [DOI] [PMC free article] [PubMed] [Google Scholar]
- Ishida T, Joh T, Uike N, et al. Defucosylated anti-CCR4 monoclonal antibody (KW-0761) for relapsed adult T-cell leukemia-lymphoma: a multicenter phase II study. J Clin Oncol. 2012;30:837–42. doi: 10.1200/JCO.2011.37.3472. [DOI] [PubMed] [Google Scholar]
- Nakahata S, Saito Y, Marutsuka K, et al. Clinical significance of CADM1/TSLC1/IgSF4 expression in adult T-cell leukemia/lymphoma. Leukemia. 2012;26:1238–46. doi: 10.1038/leu.2011.379. [DOI] [PubMed] [Google Scholar]
- Sasaki H, Nishikata I, Shiraga T, et al. Overexpression of a cell adhesion molecule, TSLC1, as a possible molecular marker for acute-type adult T-cell leukemia. Blood. 2005;105:1204–13. doi: 10.1182/blood-2004-03-1222. [DOI] [PubMed] [Google Scholar]
- Yamagishi M, Nakano K, Miyake A, et al. Polycomb-mediated loss of miR-31 activates NIK-dependent NF-kappaB pathway in adult T cell leukemia and other cancers. Cancer Cell. 2012;21:121–35. doi: 10.1016/j.ccr.2011.12.015. [DOI] [PubMed] [Google Scholar]
- Kamihira S, Iwanaga M, Doi Y, et al. Heterogeneity in clonal nature in the smoldering subtype of adult T-cell leukemia: continuity from carrier status to smoldering ATL. Int J Hematol. 2012;95:399–408. doi: 10.1007/s12185-012-1020-2. [DOI] [PubMed] [Google Scholar]
- Sasaki D, Doi Y, Hasegawa H, et al. High human T cell leukemia virus type-1(HTLV-1) provirus load in patients with HTLV-1 carriers complicated with HTLV-1-unrelated disorders. Virol J. 2010;7:81. doi: 10.1186/1743-422X-7-81. [DOI] [PMC free article] [PubMed] [Google Scholar]
- Wattel E, Vartanian JP, Pannetier C, Wain-Hobson S. Clonal expansion of human T-cell leukemia virus type I-infected cells in asymptomatic and symptomatic carriers without malignancy. J Virol. 1995;69:2863–8. doi: 10.1128/jvi.69.5.2863-2868.1995. [DOI] [PMC free article] [PubMed] [Google Scholar]
- Yoshida M, Seiki M, Yamaguchi K, Takatsuki K. Monoclonal integration of human T-cell leukemia provirus in all primary tumors of adult T-cell leukemia suggests causative role of human T-cell leukemia virus in the disease. Proc Natl Acad Sci U S A. 1984;81:2534–7. doi: 10.1073/pnas.81.8.2534. [DOI] [PMC free article] [PubMed] [Google Scholar]
- Gillet NA, Malani N, Melamed A, et al. The host genomic environment of the provirus determines the abundance of HTLV-1-infected T-cell clones. Blood. 2011;117:3113–22. doi: 10.1182/blood-2010-10-312926. [DOI] [PMC free article] [PubMed] [Google Scholar]
- Cook LB, Melamed A, Niederer H, et al. The role of HTLV-1 clonality, proviral structure, and genomic integration site in adult T-cell leukemia/lymphoma. Blood. 2014;123:3925–31. doi: 10.1182/blood-2014-02-553602. [DOI] [PMC free article] [PubMed] [Google Scholar]
- Firouzi S, Lopez Y, Suzuki Y, et al. Development and validation of a new high-throughput method to investigate the clonality of HTLV-1-infected cells based on provirus integration sites. Genome Med. 2014;6:46. doi: 10.1186/gm568. [DOI] [PMC free article] [PubMed] [Google Scholar]
- Tsukasaki K, Imaizumi Y, Tawara M, et al. Diversity of leukaemic cell morphology in ATL correlates with prognostic factors, aberrant immunophenotype and defective HTLV-1 genotype. Br J Haematol. 1999;105:369–75. doi: 10.1111/j.1365-2141.1999.01323.x. [DOI] [PubMed] [Google Scholar]
Associated Data
This section collects any data citations, data availability statements, or supplementary materials included in this article.
Supplementary Materials
Fig. S1. Correlation of proviral load (PVL) and CADM1+ (%) in the CADM1 versus CD7 plot.