Abstract
Ammonium is a metabolic waste product mainly detoxified by the liver. Hepatic dysfunction can lead to cytotoxic accumulation of circulating ammonium and to subsequent encephalopathy. Transmembrane ammonium transport is a widely spread process ensured by the highly conserved proteins of the Mep-Amt-Rh superfamily, including the mammalian Rhesus (Rh) factors. The regulatory mechanisms involved in the control of RH genes expression remain poorly studied. Here we addressed the expression regulation of one of these factors, RHBG. We identify HepG2 hepatocellular carcinoma cells and SW480 colon adenocarcinoma cells as expressing RHBG and show that its expression relies on β-catenin signaling. siRNA-mediated β-catenin knockdown resulted in significant reduction of RHBG mRNA in both cell lines. Pharmaceutical inhibition of the TCF4/β-catenin interaction or knockdown of the transcription factor TCF4 also downregulated RHBG expression. We identify a minimal RHBG regulatory sequence displaying a promoter activity and show that β-catenin and TCF4 bind to this fragment in vivo. We finally characterize the role of potential TCF4 binding sites in RHBG regulation. Taken together, our results indicate RHBG expression as a direct target of β-catenin regulation, a pathway frequently deregulated in many cancers and associated with tumorigenesis.
Introduction
Ammonium, hereafter referring to the sum of the NH3 and NH4 + molecular species, serves as principal nitrogen source for micro-organisms and plants [1]. It is however mostly described for the cytotoxic consequences of its accumulation in animals [2]. Hepatic metabolism of ammonium towards urea and glutamine synthesis is critical to maintain a low plasmatic level of the ammonium emerging from the catabolism of proteins and the activity of the intestinal flora. The impairment of ammonium detoxification occurring in case of liver dysfunction can lead to the development of hepatic encephalopathy and, in acute cases, to lethal cerebral paralysis. In parallel to these toxic effects, renal ammonium production from glutaminolysis and its subsequent urinary excretion is a crucial process to ensure blood pH homeostasis [3]. The view that the transmembrane fluxes of ammonium are the sole consequence of NH3 free diffusion was held for decades, till the first genes encoding specific ammonium permeases were identified [4–6]. Sequence analysis enabled to define a new and widely conserved family of proteins termed Mep-Amt-Rh, represented in vertebrates by the well known human Rhesus blood group factors [7]. Non-erythroid Rh factors, RhBG and RhCG, were subsequently discovered and notably found to be expressed in specific epithelial cells of several organs including mouse and human liver and kidney [8–14]. Mice knockout studies revealed the role of Rhbg and Rhcg in renal urinary ammonium excretion while their potential involvement in the liver physiology remains unsolved [15–17]. Of note, RHBG appears overexpressed in human hepatocellular carcinoma bearing activating mutations in β-catenin [18], suggesting a correlation between Wnt/β-catenin signaling and human RHBG regulation. This correlation appears to hold true in a normal mouse liver context as transgenic models enabling targeted inactivation or activation of β-catenin signaling show downregulation or upregulation of RHbg expression, respectively [19,20]. The Wnt/β-catenin pathway is highly conserved across metazoans and regulates cell proliferation, differentiation, and survival [21–23]. The secreted proteins of the WNT family are able to bind specific Frizzeld/Lrp receptors and activate signal transduction via different mechanisms. In the canonical Wnt/β-catenin mechanism, absence of Wnt signaling is accompanied by a low cytosolic β-catenin level. The β-catenin stability is regulated by a destruction complex, formed by axin, adenomatous polyposis complex (APC), casein kinase 1 and glycogen synthase kinase-3β (GSK-3 β) that phosphorylates β-catenin at its N-terminus and leads to its ubiquitylation and subsequent proteasomal degradation [21,22]. Wnt signaling triggers the dissociation of the β-catenin/destruction complex [23–25]. The resulting inhibition of phosphorylation leads to cytosolic β-catenin accumulation and translocation into the nucleus. Beta-catenin can then activate the transcription of various target genes as a cofactor bound to members of the T-cell factor (TCF)/lymphoid enhancer factor (LEF) transcription factor family and drive Wnt-specific transcriptional programs [23]. Abnormal activation of Wnt/β-catenin signaling, due to loss-of-function mutations in APC or activating mutations in β-catenin has been linked to tumorigenesis in many settings including melanoma, breast, colon and hepatocellular carcinomas [21,23].
The regulatory mechanisms involved in the control of human RH genes expression and the signaling pathways potentially implicated are so far poorly documented. Here, we sought to identify human cancer cell lines expressing the RHBG gene to study its expression regulation and address the potential direct influence of the Wnt/β-catenin signaling. We show that RHBG is highly expressed in HepG2 hepatoma cells and relies on β-catenin signaling. Similarly, the RHBG expression revealed in SW480 colon cancer cells is dependent on β-catenin, further supporting the role of β-catenin signaling in RHBG regulation. Promoter analysis and chromatin immunoprecipitation assays are consistent with a direct involvement of TCF4/β-catenin in RHBG up-regulation in HepG2 cells.
Materials and Methods
Cell culture and reagents
The human hepatocellular carcinoma (HepG2 and Hep3B) and human embryonic kidney (HEK293T) cell lines were kindly provided by Professor Claude Szpirer, Université Libre de Bruxelles, Belgium. The human colon adenocarcinoma (SW480) cell line was purchased from CLS (Germany). HepG2, Hep3B, SW480 and HEK293T cells were cultured in advanced DMEM medium (Invitrogen) supplemented with 10% fetal bovine serum (Biowest), 2 mM L-glutamine, 50 units/ml penicillin, and 50 μg/ml streptomycin. Cells were maintained in an incubator with humidified air (5% CO2) at 37°C. PFK118-310 (#K4394) was purchased from Sigma and used at a 0,2 or 0,4μM concentration from a DMSO solution.
Plasmids construction
DNA fragment (2492 bp) corresponding to the potential RHBG promoter was amplified using polymerase chain reaction with the F-Pr- BG- and R-Pr-BG (Table 1) primers and the human genomic DNA of HEK293T cells as a template. The PCR product was digested with SacI and BglII restriction enzymes and cloned into pGL3-Basic (Promega) that has been linearized with the same restriction enzymes. Deletion mutants were then constructed using the pGL3-RHBG plasmid as a template and the indicated primers (Table 1). The PCR products were digested with SacI and BglII restriction enzymes and cloned into pGL3-Basic. All constructs were verified by sequencing.
Table 1. Primer sequences used for cloning.
| RHBG | Forward | CCCGAGCTCCAGTCCCTGATTGGACAGCC |
| Reverse | CCCAGATCTGCGGACAAAGACAGCAAAGA | |
| Mut-A | Forward | CCCGAGCTCACCTGAGTTCCTGAACACAC |
| Mut-B | Forward | CCCGAGCTCACCAGACAGTGGTTCCTGGA |
| Mut-C | Forward | CCCGAGCTCTGGAGAGCACTATTTATCTC |
| Mut-D | Forward | CCCGAGCTCAACATCATGTATGAGGGTG |
| Mut-E | Forward | CCCGAGCTCTATCAGGGCAGAACACATGG |
| Mut-F | Forward | CCCGAGCTCTTTCCAGGGTCGCGTCCAA |
| Mut-G | Forward | CCCGAGCTCCGCCCCGCTCCTG |
| Mut-H | Forward | CCCGAGCTCAGCAGGGCCTCTGTGG |
| Mut-I | Forward | CCCGAGCTCTGCCGCCGGGAATTGTC |
| Mut-J | Forward | CCCGAGCTCCTGCGAGCGCCAGCCGAGA |
| ΔTCF3 | Reverse | CCCAGATCTACAGCAAAGAGGACGGCAGTG |
| ΔTCF2, 3 | Reverse | CCCAGATCTCGGCAGTGGCGCCCTGGAG |
RNA extraction and qRT-PCR
Total cellular RNA was extracted using TRIzol reagent (Invitrogen) according to manufacturer instructions. DNase treatment was done using a DNA Removal Kit (Invitrogen, #AM1906). One μg of total RNA was reverse-transcribed to cDNA using the SuperScriptIII First-Strand Synthesis SuperMix (Invitrogen) according to manufacturer instructions. Realtime RT-PCR were performed on a StepOnePlus Real-Time PCR System (Applied Biosystems) using GoTaq qPCR Master Mix (Promega) using the indicated primers (Table 2) and normalized to β-actin mRNA level measured in parallel.
Table 2. Primer sequences used for qRT-PCR.
| RHBG | Forward | CCTCAAGTGAAATGATGCTG |
| Reverse | ATTTTGATTCAAGGATGGGC | |
| RHCG | Forward | AGTCTATGGAAAAGAAGGGC |
| Reverse | CACCAAGAGACCATAAATCTG | |
| ACTIN B | Forward | CTGGAACGGTGAAGGTGACA |
| Reverse | AAGGGACTTCCTGTAACAATGCA | |
| β- CATENIN | Forward | CAACTAAACAGGAAGGGATG |
| Reverse | CACAGGTGACCACATTTATATC | |
| TCF4 | Forward | AAGAGCAAGCGAAATACTAC |
| Reverse | CTTCTTTCCATAGTTATCCCG | |
| GLUL | Forward | GTGAAGACTTTGGAGTGATAG |
| Reverse | GATGTACTTCAGACCATTCTC | |
| CYLCIN D1 | Forward | GCCTCTAAGATGAAGGAGAC |
| Reverse | CCATTTGCAGCAGCTC | |
| AXIN2 | Forward | AAAGAGAGGAGGTTCAGATG |
| Reverse | CTGAGTCTGGGAATTTTTCTTC | |
| RHBG-CHIP | Forward | ATTGTCTGCCAAAGCCTGCG |
| Reverse | AGACAGCAAAGAGGACGGC | |
| AXIN2-CHIP | Forward | TGCTTGCCACTGTTTGAAGTCAG |
| Reverse | GCCATGAACCCTTTTTGATCTTGC |
Immunofluorescence staining
Cells were cultured in Millicell EZ 8 chamber slide (Millipore). Cells were fixed with 4% paraformaldehyde (PFA) for 15 min and subsequently permeabilized with 0,1% TritonX-100 for 3 minutes and were next blocked with goat serum (5%) for 30 minutes. Cells were incubated with β-catenin antibody (Cell signaling #8480, 1:100 in 5% goat serum) overnight at 4°C. Slides were washed and incubated with anti-rabbit IgG (H+L), F(ab')2 Fragment (Alexa Fluor 594 Conjugate, Cell signaling, 1:250 in 5% goat serum) for 1 hour at room temperature. After washing with PBS, the slides were mounted with ProLong Gold antifade reagent with DAPI (Invitrogen).
Western Blot analysis
Total proteins were extracted using RIPA (25mM Tris-HCl pH 7.6, 150mM NaCl, 1% NP-40, 1% sodium deoxycholate, 0.1% SDS) lysis buffer supplemented with cocktail of phosphatase and protease inhibitors (Roche). After centrifugation, proteins were quantified using Pierce Microplate BCA Protein Assay Kit—Reducing Agent Compatible assay (Thermo Scientific). Equal amounts (~20μg) of proteins were then separated by Mini-PROTEAN TGX gels (Bio-Rad). Proteins were transferred to nitrocellulose membrane (Protran, VWR). Membranes were blocked with 5% milk and incubated with anti-β-catenin (Cell signaling, #8480, 1:1000), anti-TCF4 (#2569, 1:1000), anti-Glutamine synthetase (Abcam, #ab73593, 1:1000) or anti-β-Actin (Sigma, #A2228, 1:2000). Primary antibodies were detected with horseradish-peroxidase-conjugated anti-rabbit or anti-mouse-IgG secondary antibodies (GE Healthcare) followed by measurement of chemoluminescence (Lumi-LightPLUS, Roche).
RNA interference
Cells were reverse transfected with pre-designed silencer select non-targeting control (Invitrogen, #4390843) or siRNAs targeting β-catenin (Invitrogen, #s438) or TCF4 (Invitrogen, #s13880) with Lipofectamine siRNAMAX (Invitrogen). Cells were incubated at 37°C for 72 or 96 hours and the indicated mRNA and proteins level were examined by qRT-PCR and western blotting, respectively.
Transfection and luciferase assay
Cells were transiently co-transfected with the pTK-Renilla luciferase reporter vector (Promega) and empty plasmid (pGL3-Basic, Promega) or the plasmid containing the indicated RHBG promoter constructs for 48h using the Viafect transfection reagent (Promega). Luciferase activity in total cell lysates was measured using the Dual-Glo luciferase reporter assay (Promega) according to manufacturer instructions. Luminescence was measured using GloMax-96 Microplate Luminometer (Promega).
Chromatin immunoprecipitation (CHIP) assay
CHIP assay was done using SimpleChIP Enzymatic Chromatin IP Kit (Magnetic Beads, Cell signaling) according to manufacturer instructions. Briefly, cells were fixed with 1% formaldehyde solution to cross-link histone and non-histone proteins to DNA. Nuclear chromatin was digested with Micrococcal Nuclease for 20 min at 37°C and then incubated overnight at 4°C with either anti-β-catenin (Cell signaling, #8480, 1:50), anti-TCF4 (#2569, 1:50) Normal Rabbit IgG (Cell signaling, #2729). Following washing with low and high salt ChIP buffers, the protein-DNA complexes were eluted and cross-links were then reversed. After proteinase K digestion, DNA is purified and quantified by Real time-PCR as described earlier using primers listed in Table 2 and designed to amplify the indicated promoter regions of the target genes.
Statistical analysis
Data are expressed as means ± S.E.M. Statistical comparisons were assessed by Student’s t-tests using Graph Pad Prism version 5.00 software (Graph Pad Software). Differences were considered significant when the p value is below 0.05 (* p < 0.05, ** p < 0.01, *** p < 0.001), n = 3, except for Chip experiments where n = 2.
Results
RHBG is highly expressed in HepG2 hepatoma cells
The human RHBG gene was found to be overexpressed in a subset of hepatocellular carcinoma [18], however, the regulatory mechanisms involved remain unknown. In order to identify a cancer cell line that could be used to address the regulation of RHBG, we evaluated its expression levels in the HepG2 and Hep3B hepatoma cells. HepG2 cells bear a heterozygous deletion in the exon3 of the β-catenin CTNNB-1 gene, producing a truncated β-catenin protein lacking key residues for its phosphorylation by the destruction complex and thus resulting in its cellular accumulation [26–28]. Hep3B cells are derived from a hepatitis B- infected liver tumor, and do not contain mutations in the β-catenin gene [29,30].
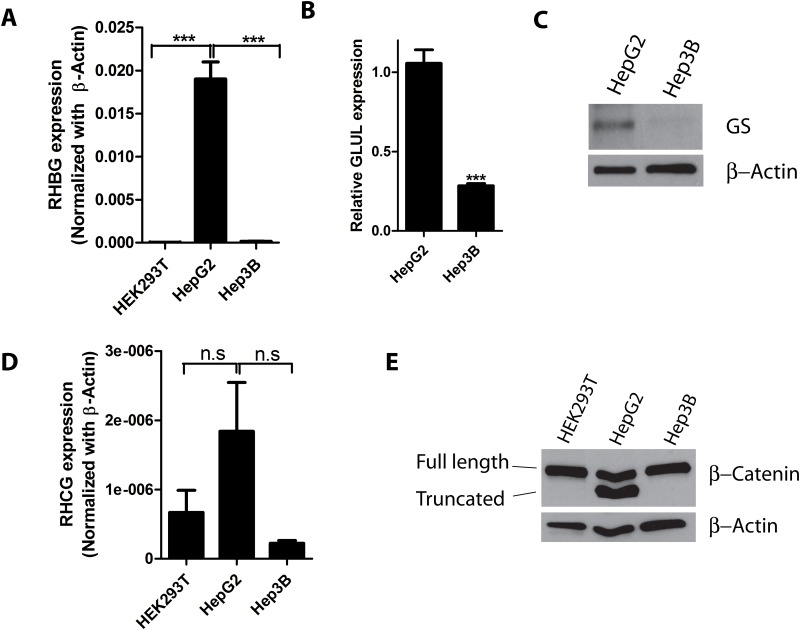
The RHBG gene appeared highly expressed in HepG2 compared to Hep3B cells, the latter showing slightly higher expression level compared to that of HEK293T cells taken as a normal cell model (Fig 1A). Expression level of GLUL, the gene of glutamine synthetase (GS) was also upregulated in HepG2 cells compared to Hep3B (Fig 1B). As the GS gene is a reported target of β-catenin [31,32], this could be consistent with a more effective β-catenin signaling in HepG2 cells compared to Hep3B. The GLUL expression levels were corroborated by the resulting GS protein levels which appeared higher in HepG2 compared to Hep3B cells (Fig 1C). Upon checking the expression of the second non-erythroid RH gene, RHCG, very low levels were found in HepG2, Hep3B and HEK293T cells (Fig 1D). These data thus point to HepG2 cells as suitable for the study of RHBG expression.
Fig 1. RHBG and GLUL are highly expressed in HepG2 hepatoma cells.
A) The level of mRNA expression of RHBG in HEK293T, HepG2 and Hep3B cells was determined by qRT-PCR and normalized to β-actin. B) The mRNA expression of GLUL in HepG2 and Hep3B was determined by qRT-PCR. C) Western Blot analysis of GS protein from total cell lysates of HepG2 and Hep3B cells. D) The level of mRNA expression of RHCG in HEK293T, HepG2 and Hep3B cells was determined by qRT-PCR and normalized to β-actin. E) Western Blot analysis of β-catenin protein from total cell lysates of HEK293T, HepG2 and Hep3B cells.
We next checked the β-catenin protein levels in HepG2, Hep3B and HEK293T cells. Consistent with previous reports [33,34], HepG2 cells harbored two β-catenin species likely corresponding to the wild-type and the truncated forms (Fig 1E). A β-catenin protein with the size of the wild-type form was detected in both HEK293T and Hep3B, with no obvious accumulation in the latter cell line. It was previously shown that β-catenin is present in the nucleus of HepG2 cells in contrast to Hep3B cells [34]. These data suggest a correlation between RHBG expression in HepG2 cells and nuclear localization of β-catenin.
Silencing of β-catenin correlates with RHBG down-regulation in HepG2 cells
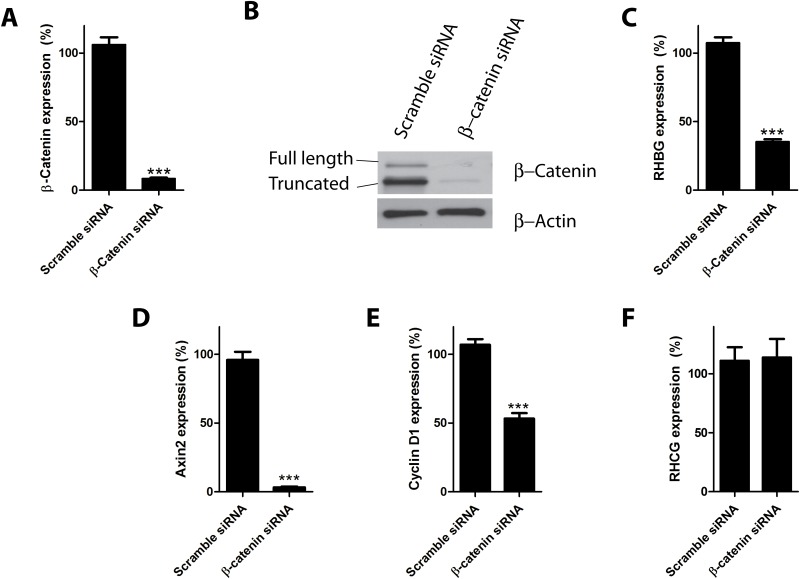
We next used β-catenin siRNA to test whether the RHBG gene expression observed in HepG2 cells is related to β-catenin function. Transfection of HepG2 cells with β-catenin siRNA for 72 hours led to a decrease in β-catenin mRNA level compared to cells transfected with non-targeting siRNA (Fig 2A). The reduction of β-catenin mRNA resulted in a reduction of β-catenin protein levels (Fig 2B). Of note, the RHBG gene expression was largely reduced upon β-catenin silencing (Fig 2C). Similarly, expression levels of Axin2 and Cyclin D1, two targets of β-catenin regulation [35–38], were also decreased with β-catenin silencing (Fig 2D and 2E). In contrast, the low expression level of RHCG observed in HepG2 cells was not affected by β-catenin silencing (Fig 2F). Hence, inhibition of β-catenin is accompanied by the down-regulation of RHBG gene expression in HepG2 cells.
Fig 2. β-catenin knockdown decreases RHBG expression in HepG2 hepatoma cells.
A-F) HepG2 cells were reverse transfected with β-catenin or control (scramble) siRNAs. 72 hours after transfection, expression levels of β-catenin mRNA (A), β-catenin protein (B), RHBG mRNA (C), Axin2 mRNA (D), Cyclin D1 mRNA (E) and RHCG mRNA (F) were determined.
Beta-catenin drives RHBG expression in SW480 colon cancer cells
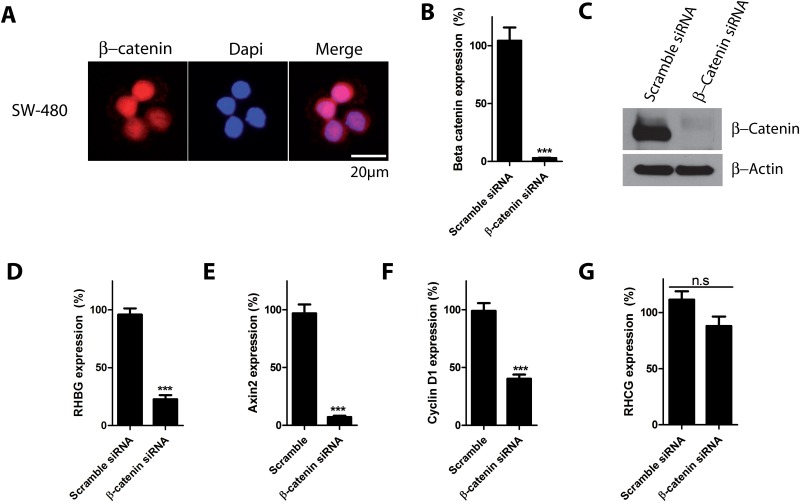
Mutations inducing β-catenin activation have been identified in various types of tumors, including melanoma, prostate, breast, and colon cancers [21,33,39,40]. We next tested whether the β-catenin signaling could be correlated with RHBG expression in another cancer cell line harboring β-catenin signaling activating mutations. The SW480 colon cancer cells bear a truncating mutation in the APC gene, resulting in stabilization and nuclear accumulation of β-catenin and leading to constitutive activation of β-catenin signaling [41–44]. Consistently, immunofluorescence experiments revealed a strong nuclear localization of β-catenin in these cells (Fig 3A). Transfection of SW480 cells with β-catenin siRNA for 72 hours led to a decrease in both mRNA and protein levels of β-catenin (Fig 3B and 3C). Similarly to HepG2 cells, β-catenin silencing was accompanied by a large decrease in RHBG expression in SW480 cells (Fig 3D). The expression levels of Axin2, and CylcinD1 (Fig 3E and 3F) were also decreased upon β-catenin silencing, consistent with β-catenin signaling inhibition. RHCG expression was not significantly affected upon β-catenin silencing (Fig 3G).
Fig 3. β-catenin knockdown decreases RHBG expression in SW480 colon cancer cells.
A) Representative results of immunofluorescence of β-catenin localization in SW480 cells using β-catenin antibody. Nuclei were stained with DAPI. B-G) SW480 cells were reverse transfected with β-catenin or control (scramble) siRNAs. 72 hours after transfection, expression levels of β-catenin mRNA (B), β-catenin protein (C), RHBG mRNA (D), Axin2 mRNA (E), Cyclin D1 mRNA (F) and RHCG mRNA (G) were determined.
These results indicate that the correlation between β-catenin signaling and RHBG expression can be extended to SW480 colon cancer cells.
Activation of β-catenin correlates with RHBG gene induction in HEK293T cells
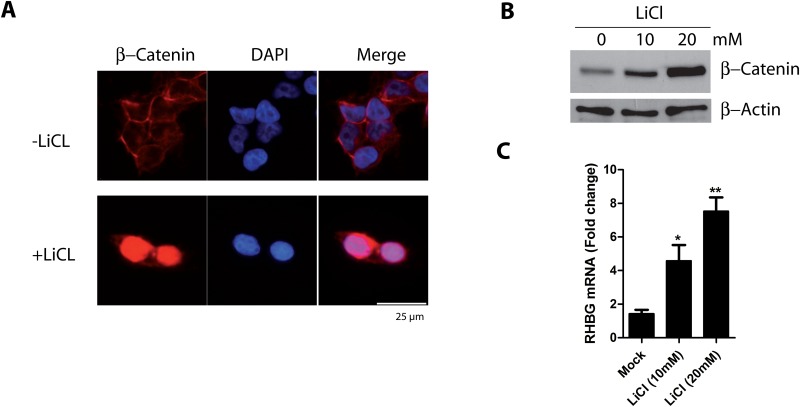
We next addressed whether activation of β-catenin in a cell line with no major nuclear activity of β-catenin could be sufficient to induce RHBG expression. LiCl is reported to inhibit GSK3 kinase [45,46], leading to β-catenin stabilization and nuclear accumulation [47,48]. We therefore treated HEK293T cells with LiCl (10 and 20 mM) to activate the Wnt/β-catenin pathway. In keeping with previous observations, immunofluorescence and western blot experiments revealed that treatment of HEK293T cells with LiCl for 24 hours induced a nuclear accumulation and stabilization of β-catenin (Fig 4A and 4B). Of note, LiCl treatment concomitantly induced an increase in the mRNA level of RHBG in a dose-dependent manner (Fig 4C). This result indicates that RHBG expression can be upregulated by artificial activation of β-catenin signaling and suggests that activation of this pathway can be sufficient to induce RHBG expression in the HEK293T cells.
Fig 4. Activation of β-catenin signaling increases RHBG expression.
A) HEK293T cells were treated with LiCL (20mM) for 24 hours. β-catenin localization was determined by immunofluorescence using β-catenin antibody. Nuclei were stained with DAPI. B) HEK293T cells were treated with LiCL (10 or 20mM) for 24 hours. β-catenin protein level was determined in total cell lysates by immunoblotting using β-catenin antibody. C) Same culture conditions as in B. The RHBG mRNA level was determined by qRT-PCR.
RHBG expression in HepG2 cells is dependent on TCF4
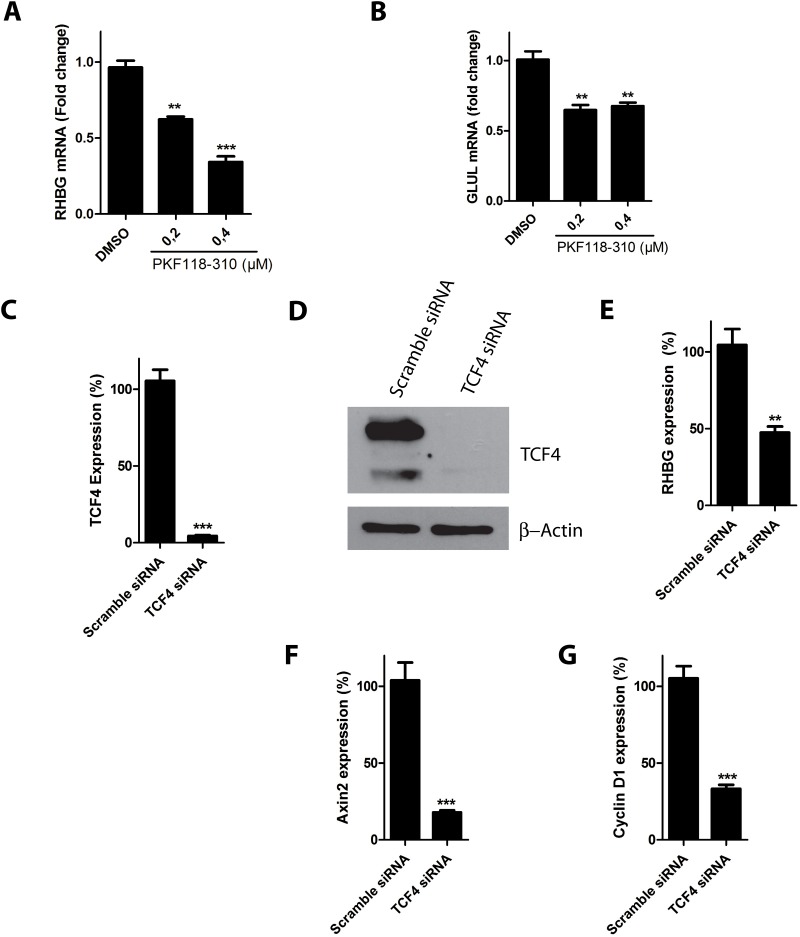
The Wnt/β-catenin pathway drives Wnt-specific transcriptional programs via the interaction with DNA-binding factors of the TCF/LEF family [21,22]. However, it is reported that β-catenin can also activate gene expression in a TCF4-independent manner [49–51]. To address a role of the TCF4/β-catenin complex in RHBG expression, we evaluated the effect of inhibiting the β-catenin activity in HepG2 cells by using an antagonist of the TCF4/β-catenin complex, PKF118-310. This compound disrupts the TCF4/ β-catenin complex and inhibits expression of TCF4-dependent genes [52]. Treatment of HepG2 cells with PKF118-310 was accompanied by a decrease in RHBG expression (Fig 5A). The GLUL expression level was also decreased by the treatment, consistent with a likely reduction of TCF4/β-catenin mediated transcription in these conditions (Fig 5B).
Fig 5. RHBG expression is dependent on TCF4.
A-B) HepG2 cells were treated with PKF118-310 (0,2 or 0,4 μM) for 24 hours. The RHBG (A) and GLUL (B) mRNA levels were determined by qRT-PCR. C-G) HepG2 cells were reverse transfected with TCF4 or control (scramble) siRNAs. 72 hours after transfection, levels of TCF4 mRNA (C), TCF4 protein (D), RHBG mRNA (E), Axin2 mRNA (F), and Cylcin D1 mRNA (G), were determined.
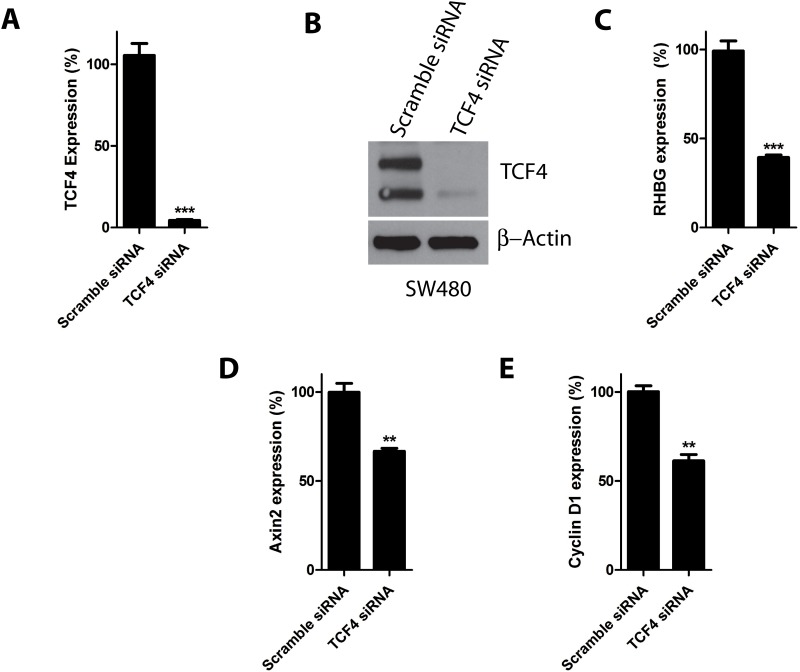
To further assert a role of TCF4 in RHBG expression, we tested the impact of TCF4 knockdown in HepG2 cells. Transfection of the latter cells with TCF4 siRNA for 72 hours decreased both the mRNA and protein levels of TCF4 compared to cells transfected with non-targeting siRNA (Fig 5C and 5D). Importantly, the RHBG mRNA level was reduced upon TCF4 silencing (Fig 5E) Similarly, the Axin2 and Cyclin D1 mRNA levels were also decreased (Fig 5F and 5G), in keeping with previous observations describing the corresponding genes as targets of TCF4 [38,40]. Moreover, similar TCF4 silencing experiments performed in SW480 colon adenocarcinoma cells also decreased RHBG, Axin2 and Cyclin D1 mRNA levels (Fig 6A–6E).
Fig 6. TCF4 knockdown decreases RHBG expression in SW480 cells.
A-E) SW480 cells were reverse transfected with TCF4 or control (scramble) siRNAs. 72 hours after transfection, levels of TCF4 mRNA (A), TCF4 protein (B) RHBG mRNA (C), Axin2 mRNA (D), and Cyclin D1 mRNA (E), were determined.
These results together indicate that β-catenin-mediated expression of RHBG is at least partially TCF4-dependent in both HepG2 and SW480 cells.
The RHBG promoter is activated by β-catenin/TCF4
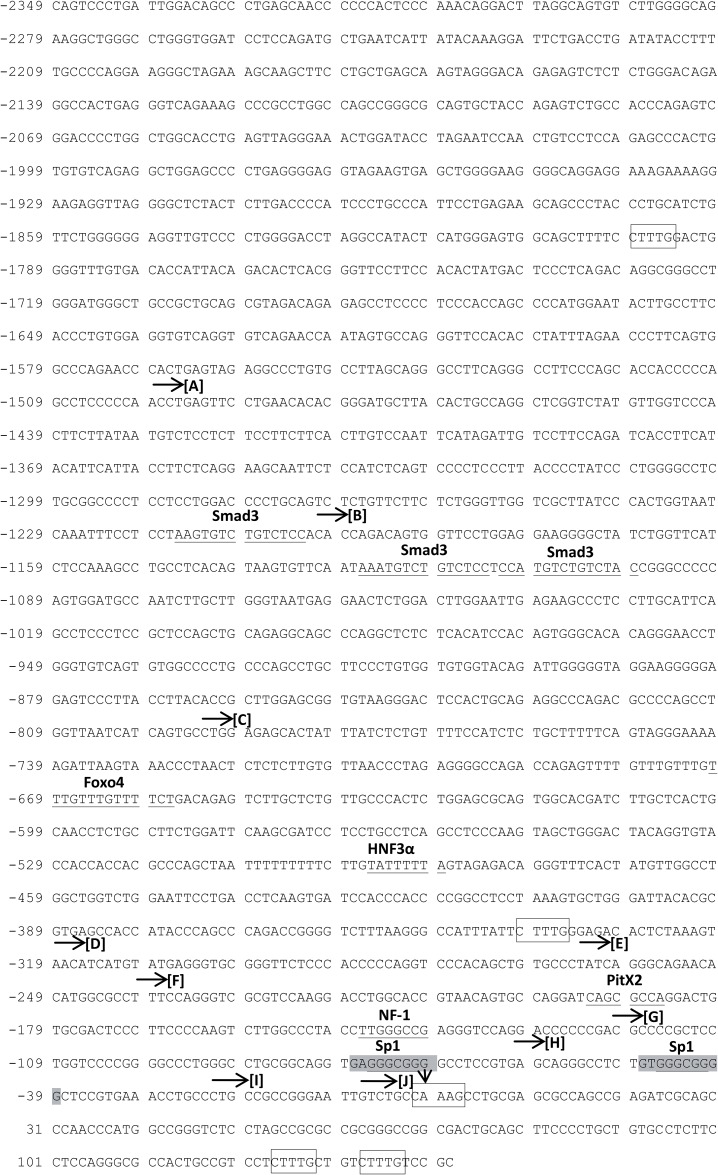
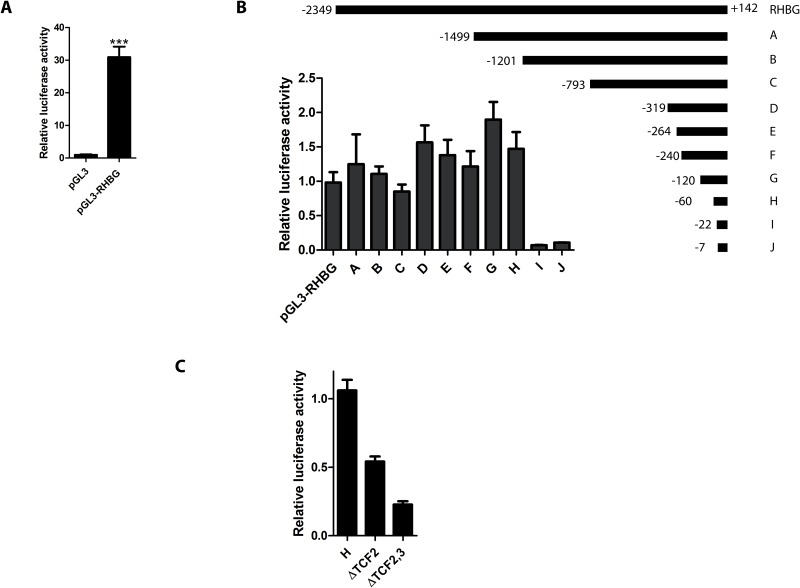
To further study RHBG expression and identify potential regulators, a genomic fragment (Fig 7) containing 2349 bp upstream and 142 bp downstream of the RHBG predicted transcriptional start site (TSS) was directionally subcloned into the pGL3-basic firefly luciferase reporter vector. To test whether this fragment possesses a promoter activity, the RHBG promoter construct (pGL3-RHBG) and the native pGL3-basic vector were used for transient co-transfection of HepG2 cells together with the pTK-Renilla luciferase reporter vector as transfection control. 48 hours after transfection, the luciferase activity in pGL3-RHBG transfected cells was about 30 fold higher than with the pGL3-basic plasmid indicating that the cloned RHBG sequence contains an active promoter (Fig 8A).
Fig 7. Promoter region of RHBG gene.
The potential human RHBG promoter sequence was obtained from eukaryotic promoter database (http://epd.vital-it.ch/). Black arrow (↓) indicates the predicted transcription start site (TSS) which is designated nucleotide 0. The GC boxes are shadowed. A selection of potential binding sites (with 0 or less than 5% dissimilarity) of transcription factors identified using PROMO [54,55] is underlined. Potential TCF4 binding sites are indicated with empty boxes. Horizontal arrows (→) indicate the starting residue position of each promoter construct analyzed in Fig 8.
Fig 8. Deletion analysis of RHBG promoter sequence.
HepG2 cells were transfected with the empty plasmid (pGL3) or RHBG promoter (pGL3-RHBG) together with Renilla plasmid. 48 hours after transfection, RHBG promoter activity in total cell lysates was determined by luciferase assay. B) HepG2 cells were transfected with RHBG promoter (pGL3-RHBG) or the indicated construct together with Renilla plasmid. 48 hours after transfection, RHBG promoter activity was determined by measuring luciferase activity in total cell lysates. Data are expressed as mean of triplicate determinations ± S.E.M of the pGL3-RHBG construct relative to pGL3-Basic. C) HepG2 cells were transfected with the indicated construct together with Renilla plasmid. 48 hours after transfection, RHBG promoter activity was determined by measuring luciferase activity in total cell lysates.
Sequence analysis of the RHBG regulatory sequence did not reveal a potential TATA box, while the region proximal to the predicted TSS was enriched in G/C content, indicating that the RHBG promoter likely corresponds to a TATA-less GC-rich promoter. Two potential GC boxes were depicted, embedded in potential Sp-1 binding sites (Fig 7). To further dissect the regions important for the activity of the cloned RHBG promoter, a series of constructs were generated bearing progressive deletions in this DNA fragment (Figs 7 and 8).
Though fluctuations were noted according to the considered fragment, all the constructs containing the -60/+142 region produced a luciferase activity very close or higher than the full-length pGL3-RHBG construct (Fig 8B). Of note the -60/+142 region of fragment H, comprising only one of both GC boxes, retained high luciferase activity. The constructs bearing further 5’ truncation into this region led to a major decrease of the RHBG promoter function, the -22/+142 region showing a very low luciferase activity (Fig 8B). This underlines the importance of the DNA segment between fragment H and I, and indicates that the expression impairment is most likely due to the loss of the second GC box. Additionally, analysis of the -60/+142 functional segment revealed the presence of three CTTTG/CAAAG motifs which could serve as TCF4 binding sites (Fig 7). These motifs are either juxtaposed to or downstream of the putative TSS. To evaluate a potential contribution of these motifs to the regulation of RHBG gene expression, promoter constructs bearing the -60/+142 region of fragment H with deletion of potential TCF4 binding motif 2, or motifs 2 and 3, were generated. Both constructs showed a promoter activity (Fig 8C). However, deletion of motif 2 reduced the promoter activity to the half of fragment H, and simultaneous deletion of motifs 2 and 3 further decreased the promoter activity, suggesting a contribution of these motifs to the functionality of the RHBG promoter.
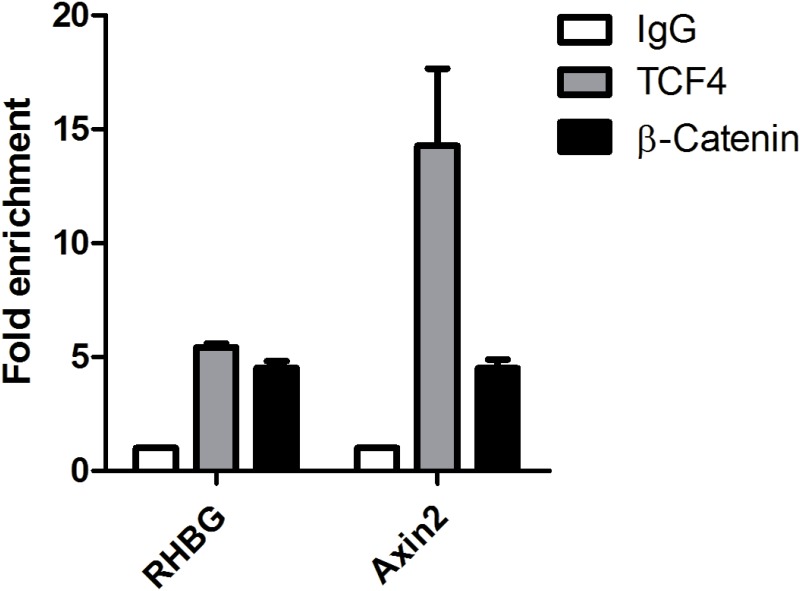
We finally performed chromatin immunoprecipitation (ChIP) assays to determine whether TCF4 and β-catenin are capable of binding the -60/+142 segment of RHBG promoter in vivo. Nuclear extracts obtained from the HepG2 cells were subjected to protein/DNA complex crosslinking and immunoprecipitation was performed using antibodies targeting either β-catenin, TCF4 or IgG, as a control. qPCR using primers within the H region reveal that TCF4 and β-catenin bind to this fragment of the RHBG promoter (Fig 9). Consistently, TCF4 and β-catenin did also bind to the Axin2 promoter, taken as control, as previously reported [37,53].
Fig 9. TCF4/β-catenin binds to the RHBG promoter.
HepG2 cells were cross-linked with formaldehyde followed by chromatin digestion. Chromatin immunoprecipitations were performed using antibodies targeting either β-catenin, TCF4 or IgG, as a control. Purified DNA was analyzed by qPCR using the indicated primers. The amount of immunoprecipitated DNA with each antibody is represented as signal relative to IgG (equivalent to 1) (n = 2).
These results indicate that TCF4/β-catenin specifically binds to the -60/+142 region of the RHBG promoter, and likely enhances RHBG expression in HepG2 cells.
Discussion
This study identifies the hepatoma HepG2 cells as expressing the RHBG gene encoding an ammonium transport protein. We show that in these cells RHBG expression is largely dependent on β-catenin function. We perform a functional analysis of the RHBG upstream regulatory sequence, revealing a minimal region bearing a promoter activity. Our data indicate that the RHBG regulatory sequence is a TATA-less GC-rich promoter. We show that β-catenin and TCF4 are both able to bind the minimal promoter region in vivo and characterize potential TCF4 binding motifs important for the promoter activity. Our data support a direct role of β-catenin/TCF4 in the regulation of RHBG expression in this cell line, and further indicate that RHBG could serve as a direct reporter of the Wnt/β-catenin pathway in specific cancer cell contexts.
Hepatocellular carcinoma is the most common adult liver malignancy and many lines of evidence associate hyperactivation of the Wnt/β-catenin pathway to its initiation and development [56]. Abnormal activation of Wnt/β-catenin signaling, due to loss-of-function mutations in APC or activating mutations in β-catenin has been linked to various human malignancies including melanoma, breast, and colon carcinomas [22]. For instance, more than 80% of colon cancers bear truncations in APC, resulting in active β-catenin accumulation in the nucleus, the initial stage of transformation [56–58]. We show that RHBG is expressed in the colon cancer SW480 cells bearing an APC mutation and that its expression is also dependent on TCF4/ β-catenin. In contrast, the expression of the gene encoding the second non erythroid ammonium transport protein, RhCG, is independent of β-catenin signaling in either HepG2 or SW480 cells.
Our data are consistent with the RHBG overexpression observed in hepatocarcinoma obtained from surgical resections and bearing activating mutations in the β-catenin gene CTNNB-1 [18]. RHBG was up-regulated in 9 over 10 HCC of the latter resections compared to normal liver, while it was slightly overexpressed in only one over 15 HCC showing wild-type CTNNB-1. RHBG overexpression was strongly correlated with upregulation of GLUL, but also of SLC13-A3 encoding a sodium-dicarboxylate (including α-ketoglutarate and succinate) transporter and GPR49, also known as LGR5, a coreceptor of Wnt signaling. A correlation between HCC with activated β-catenin pathway and upregulation of GS, of ornithin amino transferase (involved in glutamate synthesis), and of the Glt1 glutamate transporter, were also reported [31]. The upregulation of GS suggests that HepG2 cells, and possibly specific HCC, could be able to adapt their metabolism to favor glutamine synthesis from glutamate and ammonium, a function restricted to perivenous hepatocytes in normal liver. For instance, in mouse, the Wnt/β-catenin pathway has been shown to play a key role in liver zonation [19,20]. This process ensures a functional specialization of hepatocytes along the porto-central axis of the liver lobule and determines the fate of periportal hepatocytes, active in urea synthesis, or perivenous hepatocytes, active in glutamine synthesis for instance. Mouse Rhbg is specifically present at the cell surface of the latter hepatocytes and co-localizes with GS [59]. HepG2 cells were shown to have a reduced activity of the urea cycle [60]. However, it should be kept in mind that these cells show important plasticity of the metabolic networks according to the availability of key metabolite in the surrounding medium as glucose and insulin [61]. Of note, it was recently shown that HepG2 cells have a glutamine-addiction phenotype [34]. Addiction to glutamine is a metabolic particularity of many cancer cells showing concomitant high rates of glutamine transport and metabolism [62]. Proliferation of HepG2 was importantly reduced upon withdrawal of exogenous glutamine, and simultaneous drug-mediated inhibition of GS activity further hampered proliferation [34]. In conditions where glutamine synthesis would be favourable, it is tempting to hypothesize that correlated upregulation of RhBG could help to scavenge ammonium, providing one of the substrates of GS. Whether RhBG actively participates to cancer cell metabolism will require further investigation. Rh factors were shown to act as bidirectional ammonium transport proteins [8,63]. Rhcg is expressed at the apical membrane of specific epithelial kidney cells, together with the H+ V-ATPase which is supposed to drive NH3 efflux by favouring urinary trapping of NH4 + [12,13,17]. The GS activity could serve as a trapping system, driving ammonium influx via co-expressed Rh factors such as RhBG by consuming ammonium for glutamine generation. Interestingly, a corresponding mechanism exists in E. coli where the GS activity is strictly required to drive substrate uptake via the Rh orthologue AmtB [64]. However, to date, a role of Rhbg in the process of ammonium detoxification via glutamine synthesis has not been highlighted in vivo, as plasma levels of glutamine and urea appear normal in mice lacking Rhbg [15]. GS is the sole enzyme catalyzing glutamine synthesis. In addition to its presence in perivenous hepatocytes, a detailed analysis in mouse revealed that it is also highly expressed and active in the epididymis epithelial cells and in Leydig cells, the testosterone-producing cells in the testis [65]. Although the physiological role of GS in these cells is unknown, it should be noted that Rh factors are also co-expressed [17,66].
Ammonium was recently proposed to play a particular role in a tumoral context [67]. Up-regulated glutaminolysis in glutamine-addicted cancer cells results in NH3 production. The latter molecule was shown to act as an autocrine and paracrine diffusible signal that triggers a specific autophagic program, in turn enabling survival and proliferation of cancer cells deep in a tumour mass [67,68]. Whether Rh factors could play a role in these processes by participating to trans-cellular ammonium movements remains to be evaluated.
Acknowledgments
We thank Fadi Abdel-Sater, Mélanie Boeckstaens, Jérôme Kucharczak, Claude Szpirer and all members of the lab for fruitful discussions and support.
Data Availability
All relevant data are within the paper.
Funding Statement
This work was supported by grants from the Belgian Fonds de la Recherche Scientifique F.R.S.-FNRS (F.R.S.M. 3.4633.09, M.I.S. F.4.521.10.F), the Fédération Wallonie-Bruxelles (Action de Recherche Concertée), the International Brachet Stiftung, the Jean Brachet and the Alice et David Van Buuren foundations. A.M. is a scientific research worker supported by a Télévie grant, C.D. was a scientific research worker of the F.R.S.-FNRS, JVA was supported by a da Vinci program, and A.M.M. is a senior research associate of the F.R.S.-FNRS. The funders had no role in study design, data collection and analysis, decision to publish, or preparation of the manuscript.
References
- 1. Von Wirén N, Merrick M. Regulation and function of ammonium carriers in bacteria, fungi, and plants. 2004; 1–26. 10.1007/b95775 [DOI] [Google Scholar]
- 2. Auron A, Brophy PD. Hyperammonemia in review: pathophysiology, diagnosis, and treatment. Pediatr Nephrol. 2012;27: 207–22. 10.1007/s00467-011-1838-5 [DOI] [PubMed] [Google Scholar]
- 3. Weiner ID, Verlander JW. Renal ammonia metabolism and transport. Compr Physiol. 2013;3: 201–20. 10.1002/cphy.c120010 [DOI] [PMC free article] [PubMed] [Google Scholar]
- 4. Ninnemann O, Jauniaux JC, Frommer WB. Identification of a high affinity NH4+ transporter from plants. EMBO J. 1994;13: 3464–3471. [DOI] [PMC free article] [PubMed] [Google Scholar]
- 5. Marini AM, Vissers S, Urrestarazu A, Andre B. Cloning and expression of the MEP1 gene encoding an ammonium transporter in Saccharomyces cerevisiae EMBO J. AD—Laboratoire de Physiologie Cellulaire et de Genetique des Levures, Universite Libre de Bruxelles, Belgium; 1994;13: 3456–3463. [DOI] [PMC free article] [PubMed] [Google Scholar]
- 6. Marini AM, Soussi-Boudekou S, Vissers S, Andre B. A family of ammonium transporters in Saccharomyces cerevisiae. Mol Cell Biol. 1997;17: 4282–93. [DOI] [PMC free article] [PubMed] [Google Scholar]
- 7. Marini AM, Urrestarazu A, Beauwens R, André B. The Rh (rhesus) blood group polypeptides are related to NH4+ transporters. Trends Biochem Sci. 1997;22: 460–1. [DOI] [PubMed] [Google Scholar]
- 8. Marini AM, Matassi G, Raynal V, Andre B, Cartron JP, Cherif-Zahar B. The human Rhesus-associated RhAG protein and a kidney homologue promote ammonium transport in yeast NatGenet. AD—Laboratoire de Physiologie Cellulaire, Universite Libre de Bruxelles, Institut de Biologie et de Medecine Moleculaires, Gosselies, Belgium; 2000;26: 341–344. [DOI] [PubMed] [Google Scholar]
- 9. Liu Z, Chen Y, Mo R, Hui C, Cheng JF, Mohandas N, et al. Characterization of human RhCG and mouse Rhcg as novel nonerythroid Rh glycoprotein homologues predominantly expressed in kidney and testis. J Biol Chem. 2000;275: 25641–25651. 10.1074/jbc.M003353200 [DOI] [PubMed] [Google Scholar]
- 10. Liu Z, Peng J, Mo R, Hui C, Huang CH. Rh type B glycoprotein is a new member of the Rh superfamily and a putative ammonia transporter in mammals. J Biol Chem. 2001;276: 1424–33. 10.1074/jbc.M007528200 [DOI] [PubMed] [Google Scholar]
- 11. Nakhoul NL, Lee Hamm L. Characteristics of mammalian Rh glycoproteins (SLC42 transporters) and their role in acid-base transport. Molecular Aspects of Medicine. 2013. pp. 629–637. 10.1016/j.mam.2012.05.013 [DOI] [PMC free article] [PubMed] [Google Scholar]
- 12. Quentin F, Eladari D, Cheval L, Lopez C, Goossens D, Colin Y, et al. RhBG and RhCG, the putative ammonia transporters, are expressed in the same cells in the distal nephron. J Am Soc Nephrol. 2003;14: 545–554. 10.1097/01.ASN.0000050413.43662.55 [DOI] [PubMed] [Google Scholar]
- 13. Verlander JW, Miller RT, Frank AE, Royaux IE, Kim Y-H, Weiner ID. Localization of the ammonium transporter proteins RhBG and RhCG in mouse kidney. Am J Physiol Renal Physiol. 2003;284: F323–F337. 10.1152/ajprenal.00050.2002 [DOI] [PubMed] [Google Scholar]
- 14. Weiner ID, Miller RT, Verlander JW. Localization of the ammonium transporters, Rh B glycoprotein and Rh C glycoprotein, in the mouse liver. Gastroenterology. 2003;124: 1432–40. [DOI] [PubMed] [Google Scholar]
- 15. Chambrey R, Goossens D, Bourgeois S, Picard N, Bloch-Faure M, Leviel F, et al. Genetic ablation of Rhbg in the mouse does not impair renal ammonium excretion. Am J Physiol Renal Physiol. 2005;289: F1281–F1290. 10.1152/ajprenal.00172.2005 [DOI] [PubMed] [Google Scholar]
- 16. Bishop JM, Verlander JW, Lee H-W, Nelson RD, Weiner AJ, Handlogten ME, et al. Role of the Rhesus glycoprotein, Rh B glycoprotein, in renal ammonia excretion. Am J Physiol Renal Physiol. 2010;299: F1065–F1077. 10.1152/ajprenal.00277.2010 [DOI] [PMC free article] [PubMed] [Google Scholar]
- 17. Biver S, Belge H, Bourgeois S, Van Vooren P, Nowik M, Scohy S, et al. A role for Rhesus factor Rhcg in renal ammonium excretion and male fertility. Nature. 2008;456: 339–343. 10.1038/nature07518 [DOI] [PubMed] [Google Scholar]
- 18. Stahl S, Ittrich C, Marx-Stoelting P, Köhle C, Altug-Teber O, Riess O, et al. Genotype-phenotype relationships in hepatocellular tumors from mice and man. Hepatology. 2005;42: 353–61. 10.1002/hep.20768 [DOI] [PubMed] [Google Scholar]
- 19. Benhamouche S, Decaens T, Godard C, Chambrey R, Rickman DS, Moinard C, et al. Apc Tumor Suppressor Gene Is the “Zonation-Keeper” of Mouse Liver. Dev Cell. 2006;10: 759–770. 10.1016/j.devcel.2006.03.015 [DOI] [PubMed] [Google Scholar]
- 20. Sekine S, Lan BY-A, Bedolli M, Feng S, Hebrok M. Liver-specific loss of beta-catenin blocks glutamine synthesis pathway activity and cytochrome p450 expression in mice. Hepatology. 2006;43: 817–25. 10.1002/hep.21131 [DOI] [PubMed] [Google Scholar]
- 21. Anastas JN, Moon RT. WNT signalling pathways as therapeutic targets in cancer. Nat Rev Cancer. 2013;13: 11–26. 10.1038/nrc3419 [DOI] [PubMed] [Google Scholar]
- 22. Clevers H, Nusse R. Wnt/β-catenin signaling and disease. Cell. 2012;149: 1192–205. 10.1016/j.cell.2012.05.012 [DOI] [PubMed] [Google Scholar]
- 23. MacDonald BT, Tamai K, He X. Wnt/β-Catenin Signaling: Components, Mechanisms, and Diseases. Developmental Cell. 2009. pp. 9–26. 10.1016/j.devcel.2009.06.016 [DOI] [PMC free article] [PubMed] [Google Scholar]
- 24. Cong F, Schweizer L, Varmus H. Wnt signals across the plasma membrane to activate the beta-catenin pathway by forming oligomers containing its receptors, Frizzled and LRP. Development. 2004;131: 5103–15. 10.1242/dev.01318 [DOI] [PubMed] [Google Scholar]
- 25. Kim S-E, Huang H, Zhao M, Zhang X, Zhang A, Semonov MV, et al. Wnt stabilization of β-catenin reveals principles for morphogen receptor-scaffold assemblies. Science. 2013;340: 867–70. 10.1126/science.1232389 [DOI] [PMC free article] [PubMed] [Google Scholar]
- 26. Amit S, Hatzubai A, Birman Y, Andersen JS, Ben-Shushan E, Mann M, et al. Axin-mediated CKI phosphorylation of beta-catenin at Ser 45: a molecular switch for the Wnt pathway. Genes Dev. 2002;16: 1066–76. 10.1101/gad.230302 [DOI] [PMC free article] [PubMed] [Google Scholar]
- 27. Wu G, Huang H, Garcia Abreu J, He X. Inhibition of GSK3 phosphorylation of beta-catenin via phosphorylated PPPSPXS motifs of Wnt coreceptor LRP6 Jin D-Y, editor. PLoS One. Public Library of Science; 2009;4: e4926 10.1371/journal.pone.0004926 [DOI] [PMC free article] [PubMed] [Google Scholar]
- 28. Liu X, Rubin JS, Kimmel AR. Rapid, Wnt-induced changes in GSK3beta associations that regulate beta-catenin stabilization are mediated by Galpha proteins. Curr Biol. 2005;15: 1989–97. 10.1016/j.cub.2005.10.050 [DOI] [PubMed] [Google Scholar]
- 29. Cha M-Y, Kim C-M, Park Y-M, Ryu W-S. Hepatitis B virus X protein is essential for the activation of Wnt/beta-catenin signaling in hepatoma cells. Hepatology. 2004;39: 1683–93. 10.1002/hep.20245 [DOI] [PubMed] [Google Scholar]
- 30. Desbois-Mouthon C, Blivet-Van Eggelpoël M-J, Beurel E, Boissan M, Delélo R, Cadoret A, et al. Dysregulation of glycogen synthase kinase-3beta signaling in hepatocellular carcinoma cells. Hepatology. 2002;36: 1528–36. 10.1053/jhep.2002.37192 [DOI] [PubMed] [Google Scholar]
- 31. Cadoret A, Ovejero C, Terris B, Souil E, Lévy L, Lamers WH, et al. New targets of beta-catenin signaling in the liver are involved in the glutamine metabolism. Oncogene. 2002;21: 8293–301. 10.1038/sj.onc.1206118 [DOI] [PubMed] [Google Scholar]
- 32. Zeng G, Apte U, Cieply B, Singh S, Monga SPS. siRNA-Mediated B-Catenin Knockdown in Human Hepatoma Cells Results in Decreased Growth and Survival 1. 2007;9: 951–959. 10.1593/neo.07469 [DOI] [PMC free article] [PubMed] [Google Scholar]
- 33. Coste A de La, Romagnolo B, Billuart P, Renard C-A, Buendia M-A, Soubrane O, et al. Somatic mutations of the β-catenin gene are frequent in mouse and human hepatocellular carcinomas. Proc Natl Acad Sci U S A. 1998;95: 8847–8851. 10.1073/pnas.95.15.8847 [DOI] [PMC free article] [PubMed] [Google Scholar]
- 34. Tardito S, Chiu M, Uggeri J, Zerbini A, Da Ros F, Dall’Asta V, et al. L-Asparaginase and inhibitors of glutamine synthetase disclose glutamine addiction of β-catenin-mutated human hepatocellular carcinoma cells. Curr Cancer Drug Targets. 2011;11: 929–43. [DOI] [PubMed] [Google Scholar]
- 35. Tetsu O, McCormick F. Beta-catenin regulates expression of cyclin D1 in colon carcinoma cells. Nature. 1999;398: 422–6. 10.1038/18884 [DOI] [PubMed] [Google Scholar]
- 36. Shtutman M, Zhurinsky J, Simcha I, Albanese C, D’Amico M, Pestell R, et al. The cyclin D1 gene is a target of the beta-catenin/LEF-1 pathway. Proc Natl Acad Sci U S A. 1999;96: 5522–7. [DOI] [PMC free article] [PubMed] [Google Scholar]
- 37. Jho E, Zhang T, Domon C, Joo C-K, Freund J-N, Costantini F. Wnt/beta-catenin/Tcf signaling induces the transcription of Axin2, a negative regulator of the signaling pathway. Mol Cell Biol. 2002;22: 1172–83. [DOI] [PMC free article] [PubMed] [Google Scholar]
- 38. Leung JY, Kolligs FT, Wu R, Zhai Y, Kuick R, Hanash S, et al. Activation of AXIN2 expression by beta-catenin-T cell factor. A feedback repressor pathway regulating Wnt signaling. J Biol Chem. 2002;277: 21657–65. 10.1074/jbc.M200139200 [DOI] [PubMed] [Google Scholar]
- 39. Rubinfeld B, Robbins P, El-Gamil M, Albert I, Porfiri E, Polakis P. Stabilization of beta-catenin by genetic defects in melanoma cell lines. Science. 1997;275: 1790–2. [DOI] [PubMed] [Google Scholar]
- 40. Lin SY, Xia W, Wang JC, Kwong KY, Spohn B, Wen Y, et al. Beta-catenin, a novel prognostic marker for breast cancer: its roles in cyclin D1 expression and cancer progression. Proc Natl Acad Sci U S A. 2000;97: 4262–6. 10.1073/pnas.060025397 [DOI] [PMC free article] [PubMed] [Google Scholar]
- 41. Morin PJ, Sparks AB, Korinek V, Barker N, Clevers H, Vogelstein B, et al. Activation of beta-catenin-Tcf signaling in colon cancer by mutations in beta-catenin or APC. Science. 1997;275: 1787–1790. 10.1126/science.275.5307.1787 [DOI] [PubMed] [Google Scholar]
- 42. Munemitsu S, Albert I, Souza B, Rubinfeld B, Polakis P. Regulation of intracellular beta-catenin levels by the adenomatous polyposis coli (APC) tumor-suppressor protein. Proc Natl Acad Sci U S A. 1995;92: 3046–50. [DOI] [PMC free article] [PubMed] [Google Scholar]
- 43. Rubinfeld B, Albert I, Porfiri E, Munemitsu S, Polakis P. Loss of beta-catenin regulation by the APC tumor suppressor protein correlates with loss of structure due to common somatic mutations of the gene. Cancer Res. 1997;57: 4624–4630. [PubMed] [Google Scholar]
- 44. Rubinfeld B, Souza B, Albert I, Munemitsu S, Polakis P. The APC protein and E-cadherin form similar but independent complexes with alpha-catenin, beta-catenin, and plakoglobin. J Biol Chem. 1995;270: 5549–55. [DOI] [PubMed] [Google Scholar]
- 45. Klein PS, Melton DA. A molecular mechanism for the effect of lithium on development. Proc Natl Acad Sci U S A. 1996;93: 8455–9. [DOI] [PMC free article] [PubMed] [Google Scholar]
- 46. Stambolic V, Ruel L, Woodgett JR. Lithium inhibits glycogen synthase kinase-3 activity and mimics wingless signalling in intact cells. Curr Biol. 1996;6: 1664–8. [DOI] [PubMed] [Google Scholar]
- 47. Najafov A, Seker T, Even I, Hoxhaj G, Selvi O, Ozel DE, et al. MENA is a transcriptional target of the Wnt/beta-catenin pathway. PLoS One. 2012;7: e37013 10.1371/journal.pone.0037013 [DOI] [PMC free article] [PubMed] [Google Scholar]
- 48. Yamashita T, Budhu A, Forgues M, Wang XW. Activation of hepatic stem cell marker EpCAM by Wnt-beta-catenin signaling in hepatocellular carcinoma. Cancer Res. 2007;67: 10831–9. 10.1158/0008-5472.CAN-07-0908 [DOI] [PubMed] [Google Scholar]
- 49. Solanas G, Porta-de-la-Riva M, Agustí C, Casagolda D, Sánchez-Aguilera F, Larriba MJ, et al. E-cadherin controls beta-catenin and NF-kappaB transcriptional activity in mesenchymal gene expression. J Cell Sci. 2008;121: 2224–34. 10.1242/jcs.021667 [DOI] [PubMed] [Google Scholar]
- 50. Saegusa M, Hashimura M, Kuwata T, Hamano M, Okayasu I. Induction of p16INK4A mediated by beta-catenin in a TCF4-independent manner: implications for alterations in p16INK4A and pRb expression during trans-differentiation of endometrial carcinoma cells. Int J Cancer. 2006;119: 2294–303. 10.1002/ijc.22112 [DOI] [PubMed] [Google Scholar]
- 51. Xu L, Corcoran RB, Welsh JW, Pennica D, Levine AJ. WISP-1 is a Wnt-1- and beta-catenin-responsive oncogene. Genes Dev. 2000;14: 585–95. [PMC free article] [PubMed] [Google Scholar]
- 52. Lepourcelet M, Chen Y-NP, France DS, Wang H, Crews P, Petersen F, et al. Small-molecule antagonists of the oncogenic Tcf/beta-catenin protein complex. Cancer Cell. 2004;5: 91–102. [DOI] [PubMed] [Google Scholar]
- 53. Bottomly D, Kyler SL, McWeeney SK, Yochum GS. Identification of {beta}-catenin binding regions in colon cancer cells using ChIP-Seq. Nucleic Acids Res. 2010;38: 5735–45. 10.1093/nar/gkq363 [DOI] [PMC free article] [PubMed] [Google Scholar]
- 54. Farré D, Roset R, Huerta M, Adsuara JE, Roselló L, Albà MM, et al. Identification of patterns in biological sequences at the ALGGEN server: PROMO and MALGEN. Nucleic Acids Res. 2003;31: 3651–3. [DOI] [PMC free article] [PubMed] [Google Scholar]
- 55. Messeguer X, Escudero R, Farré D, Núñez O, Martínez J, Albà MM. PROMO: detection of known transcription regulatory elements using species-tailored searches. Bioinformatics. 2002;18: 333–4. [DOI] [PubMed] [Google Scholar]
- 56. Ma L, Wei W, Chua M-S, So S. WNT / β -catenin pathway activation in hepatocellular carcinoma: a clinical perspective Gastrointest Cancer Targets Ther. 2014; 49–63. [Google Scholar]
- 57. Rowan AJ, Lamlum H, Ilyas M, Wheeler J, Straub J, Papadopoulou A, et al. APC mutations in sporadic colorectal tumors: A mutational “hotspot” and interdependence of the “two hits”. Proc Natl Acad Sci U S A. 2000;97: 3352–7. [DOI] [PMC free article] [PubMed] [Google Scholar]
- 58. Jones S, Chen W-D, Parmigiani G, Diehl F, Beerenwinkel N, Antal T, et al. Comparative lesion sequencing provides insights into tumor evolution. Proc Natl Acad Sci U S A. 2008;105: 4283–8. 10.1073/pnas.0712345105 [DOI] [PMC free article] [PubMed] [Google Scholar]
- 59. Weiner ID, Verlander JW. Renal and hepatic expression of the ammonium transporter proteins, Rh B Glycoprotein and Rh C Glycoprotein. Acta Physiologica Scandinavica. 2003. pp. 331–338. 10.1046/j.0001-6772.2003.01210.x [DOI] [PubMed] [Google Scholar]
- 60. Mavri-Damelin D, Eaton S, Damelin LH, Rees M, Hodgson HJF, Selden C. Ornithine transcarbamylase and arginase I deficiency are responsible for diminished urea cycle function in the human hepatoblastoma cell line HepG2. Int J Biochem Cell Biol. 2007;39: 555–64. 10.1016/j.biocel.2006.10.007 [DOI] [PubMed] [Google Scholar]
- 61. Iyer V V, Yang H, Ierapetritou MG, Roth CM. Effects of glucose and insulin on HepG2-C3A cell metabolism. Biotechnol Bioeng. 2010;107: 347–56. 10.1002/bit.22799 [DOI] [PubMed] [Google Scholar]
- 62. Wise DR, Thompson CB. Glutamine addiction: a new therapeutic target in cancer. Trends Biochem Sci. 2010;35: 427–33. 10.1016/j.tibs.2010.05.003 [DOI] [PMC free article] [PubMed] [Google Scholar]
- 63. Zidi-Yahiaoui N, Mouro-Chanteloup I, D’Ambrosio A-M, Lopez C, Gane P, Le van Kim C, et al. Human Rhesus B and Rhesus C glycoproteins: properties of facilitated ammonium transport in recombinant kidney cells. Biochem J. 2005;391: 33–40. 10.1042/BJ20050657 [DOI] [PMC free article] [PubMed] [Google Scholar]
- 64. Javelle A, Thomas G, Marini A-M, Krämer R, Merrick M. In vivo functional characterization of the Escherichia coli ammonium channel AmtB: evidence for metabolic coupling of AmtB to glutamine synthetase. Biochem J. 2005;390: 215–22. 10.1042/BJ20042094 [DOI] [PMC free article] [PubMed] [Google Scholar]
- 65. Van Straaten HWM, He Y, van Duist MM, Labruyère WT, Vermeulen JLM, van Dijk PJ, et al. Cellular concentrations of glutamine synthetase in murine organs. Biochem Cell Biol. 2006;84: 215–31. 10.1139/o05-170 [DOI] [PubMed] [Google Scholar]
- 66. Lee H-W, Verlander JW, Handlogten ME, Han K-H, Cooke PS, Weiner ID. Expression of the rhesus glycoproteins, ammonia transporter family members, RHCG and RHBG in male reproductive organs. Reproduction. 2013;146: 283–96. 10.1530/REP-13-0154 [DOI] [PMC free article] [PubMed] [Google Scholar]
- 67. Eng CH, Yu K, Lucas J, White E, Abraham RT. Ammonia derived from glutaminolysis is a diffusible regulator of autophagy. Sci Signal. 2010;3: ra31 10.1126/scisignal.2000911 [DOI] [PubMed] [Google Scholar]
- 68. Harder LM, Bunkenborg J, Andersen JS. A comparative phosphoproteomic study of the cellular response to ammonia and rapamycin Inducing autophagy. 2014; 1–17. 10.4161/auto.26863 [DOI] [PMC free article] [PubMed] [Google Scholar]
Associated Data
This section collects any data citations, data availability statements, or supplementary materials included in this article.
Data Availability Statement
All relevant data are within the paper.


