

Abstract
We report a low cost, disposable polymer microfluidic sample preparation device to perform rapid concentration of bacteria from liquid samples using enhanced evaporation targeted at downstream detection using surface enhanced Raman spectroscopy (SERS). The device is composed of a poly(dimethylsiloxane) (PDMS) liquid sample flow layer, a reusable metal airflow layer, and a porous PTFE (Teflon ™) membrane sandwiched in between the liquid and air layers. The concentration capacity of the device was successfully demonstrated with fluorescently tagged Escherichia coli (E. coli). The recovery concentration was above 85% for all initial concentrations lower than 1 × 10⁴ CFU mL−1. In the lowest initial concentration cases, 100 μL initial volumes of bacteria solution at 100 CFU mL−1 were concentrated into 500 nL droplets with greater than 90% efficiency in 15 min. Subsequent tests with SERS on clinically relevant Methicillin-Sensitive Staphylococcus aureus (MSSA) after concentration in this device proved more than 100-fold enhancement in SERS signal intensity compared to the signal obtained from the unconcentrated sample. The concentration device is straightforward to design and use, and as such could be used in conjunction with a number of detection technologies.
1. Introduction
Conventional sample preparation for the diagnosis of many infectious diseases involves prolonged culture of the potential pathogen from a patient sample, such as stool, blood, or nose/throat swabs.1,2 The culture and growth of infectious bacteria or virus is a risky practice for personnel in contact with the samples, and thus has to be carried out in a strictly controlled environment by experienced technicians. Furthermore, it often takes hours or days to complete. There is an urgent need for a point-of-care (POC) infectious disease diagnostic platform that satisfies the criteria listed by the World Health Organization: simple-to-use, rapid, low-cost, sensitive, accurate, specific, and robust.3 The major components of such a system should include a sample preparation module to improve or replace current methods, and substantially reduce the time to answer. Such a platform will also include a fast and accurate detection method. Several groups have used surface enhanced Raman spectroscopy (SERS) as a powerful tool to generate species-specific spectra for detection of biologically relevant levels of bacteria or viruses.4-6 Currently, empirical SERS spectra are collected and compared with a library using clustering analysis to achieve microbial species identification.6,7 The focus of this paper is a POC microfluidic bacterial sample preparation module aimed at concentrating bacteria samples into small interrogation volumes for SERS detection. The efficiency of the system is verified by conventional plate counts combined with fluorescent image processing and SERS.
Sample preparation can entail purification, concentration and/or enrichment of the sample depending on the requirements of the downstream analysis. Here, we are starting with a purified sample (bacteria in buffer only) and focusing only on concentration. For biologically relevant levels of pathogen to be detectable in a small volume as is required for SERS detection, the microfluidic has to concentrate the number of pathogens into a small sample for interrogation. Concentration is easily accomplished in a laboratory setting with equipment such as the centrifuge. However, as the size of the pathogen becomes smaller, the centrifuge required becomes less portable, prone to contamination, and too labor intensive for the POC. Microfluidics can be a powerful solution for portable POC sample preparation by decreasing the amount of time needed for concentration, reducing the possibility for sample contamination, and by generally saving expensive reagents.
Two main approaches have been taken to concentrate samples using microfluidics: one is to capture or collect pathogens from the fluid flow using either specific or non-specific targeting, and the other is to reduce overall fluid volume while conserving the number of target pathogens.
Electrodynamic methods are often used. These include capillary electrophoresis (CE), dielectrophoresis (DEP), electroosmotic flow (EOF), and isoelectric focusing (IEF). All of the methods involve manipulating sample flow using an electric field.8-12 Bacterial surfaces are negatively charged, so they are conveniently manipulated to move towards the positive ionic region in electrophoresis. However, electrodynamic methods often suffer from the drawbacks of complicated setup of external electrodes, power supplies, and other electric circuitry. The dependence on the surface charge of the pathogen of interest makes it difficult to adapt to different types of samples or mixed samples. In the case of SERS detection, the addition of a conductive buffer to the sample to generate EOF may also disturb the intrinsic surface properties of the bacteria required to obtain a spectral signature.
Incorporating microfilters inside a microfluidic channel has been used to trap microbes.13,14 The microfilter can be based on thermoplastic polymer and have the 3D configuration of a porous monolith, through which samples larger than the pore size cannot pass. The monolith pore size can be adjusted by the relative amount of the monomer and the porogens. When the pore sizes are properly tuned, a monolithic microfilter can potentially be a cell trapping or concentrating device. The limitations of such an approach are clogging of the pores by the sample, and difficulty retrieving or dispensing the trapped samples for subsequent analysis.
Many microfluidic devices have been demonstrated that utilize evaporation to pump, pattern, crystallize, or concentrate microspheres, proteins, viruses, toxins, or electrolytes.15-20 The device built by Walker and Beebe19 is a simple channel with a “reservoir port” and a “collection port”. The reservoir port and the channel are pre-filled with the liquid sample. As evaporation happens at the collection port, water flows from the reservoir port to the collection port to compensate for the liquid loss into the air. The analyte particles are dragged by the bulk fluid flow towards the collection port as liquid evaporates. This device is especially simple to fabricate and to use. However, passive evaporation in this case is very slow, so it is not practical to concentrate fluid volume in the magnitude of hundreds of microlitres in a reasonable time. Sharma et al.17 introduced a sample concentration device using convective gas flow for rapid isothermal evaporation of water. In their prototype, analyte concentration enhancement is achieved via fluid volume reduction. While the input volumes can be quite large, the final concentrated volume is limited by the total channel volume of the device. This device was not tested using any biological analyte. In the current study, concentration of the sample volume is achieved through both volume reduction of the fluid and the meniscus dragging effect, leading to a small volume of concentrated sample at the end of the channel path.
Compared to current microfluidic sample concentration methods, including electrodynamics and filtration, both of which separate the sample from the fluid flow, evaporation microfluidics are simpler to fabricate and more flexible to assemble without excessive accessories. Specifically, our approach does not introduce conductive buffer which can disturb the intrinsic surface properties of the pathogen, which are required for SERS detection. The large surface area to volume ratio in themicrofluidic features leads to fast volume reduction and analyte concentration due to the evaporation induced meniscus dragging effect.
2. Theory
The device harnesses the combined power of convective gas flow, a partial pressure gradient, mass transfer, and capillary surface tension to evaporate fluid from the sample and deliver a tiny volume of concentrated analyte to a specific area.
2.1. Mass transfer of the fluid
Fig. 1 illustrates the working principle of the device. The microevaporation device includes a liquid sample layer and a gas flow layer, between which a hydrophobic porous membrane layer is sandwiched. The convective gas flow reduces the pressure in the gas flow layer, a behavior dictated by Bernoulli’s principle. As a result, there is a vapor pressure gradient across the liquid/gas interface at the porous membrane that drives evaporation of the liquid from the liquid stream to the gas stream. The vapor pressure is directly proportional to its mole fraction in the gaseous mixture. The governing equation for this phenomenon is:
| (1) |
where ṁ is the rate of evaporation, A is the area of the exchange surface, kx is the convective mass transfer coefficient, XA0 is the mole fraction of liquid vapor at the liquid/gas interface, and XA∞ is the mole fraction of liquid vapor in the gas stream.20 By treating the liquid/gas interface as a horizontal plate, the mass transfer coefficient kx can be calculated by Eqn (2):19
| (2) |
where cf is the molar concentration of gas, D is the diffusion coefficient of liquid through gas, L is the characteristic length of the liquid/gas interface, ρf is the density of gas, g is the gravitational constant, ζf is the concentration coefficient of volumetric expansion for gas, ΔxA is the difference in mole concentration of liquid vapor at the liquid/gas interface and in the gas stream, μf is the viscosity of air, and υ is the kinematic viscosity of air.
Fig. 1.

Sample, liquid, and air mass exchange transfer during evaporation.
As a result of the depleted liquid over the sample during mass transfer through evaporation, the liquid forms a meniscus which moves in the top liquid channel towards the sealed outlet.
2.2. Mass transfer of the analyte in the liquid
The biological analyte, here bacterial cells, can be assumed to be micrometre or sub-micrometre particles suspended in the liquid. Their movement is dominated by the bulk liquid flow and capillary immersion force,21 as diffusion along the concentration gradient against the direction of fluid flow is too small to be significant.19 The hydrodynamic force due to liquid flow to compensate for the evaporation drags the analyte along with the liquid meniscus. Meanwhile, as seen in Fig. 1, the attractive capillary immersion force F between the analyte particles cause them to pack closely.21 As a result, analyte is collected and concentrated at the liquid meniscus, and moved along as evaporation continues.
3. Materials and methods
3.1. Device design and fabrication
The device presented here includes a poly(dimethylsiloxane) (PDMS) liquid sample layer and a metal airflow layer, with a hydrophobic porous Teflon™ membrane (PTFE unlaminated membrane filter 1 μm, Sterlitech, Kent, WA) layer sandwiched in between (Fig. 2). Fabrication of the silicon-photoresist mold followed standard photolithography techniques.22 Specifically, 4″ Si wafers (University Wafer, MA, USA) were cleaned by sonication in acetone, methanol, and water for 2 minutes each, and blown dry with nitrogen. SU8 2050 photoresist (Micro-Chem, MA, USA) was spin-coated on the cleaned wafer at 1665 rpm for 30 seconds, followed by a soft bake at 65 °C for 5 minutes and then at 95 °C for 20 minutes. The wafer was then exposed to 365 nm UV light at 350 mJ cm−2 for 140 seconds. Post-exposure bake was 1 minute at 65 °C and 10 minutes at 95 °C. The photoresist feature was developed in SU8 developer (MicroChem, MA, USA) for 8 minutes. Final channel features were 100 μm thick and 700 μm wide.
Fig. 2.

Two layered design of the evaporation microfluidics. Left: top 3D view and picture of each component, including the stainless steel airflow channel layer, the PDMS sample flow channel layer, separated by the Teflon™ (PTFE) porous membrane. Right: cross-sectional view of each layer after the completed assembly. From top to bottom: the PDMS liquid channel, Teflon™ porous membrane, the stainless steel gas channel, silicone gasket and an aluminium enclosure. The expanded view of the device layers shows the dimension of the design. The sample flow channel was 100 μm deep and 700 μm wide. The airflow channel was 1.27 cm deep and 500 μm wide.
Conventional soft lithography techniques were used to fabricate the liquid channel layer.23 Poly(dimethylsiloxane) (PDMS, Sylgard 184) was purchased from Dow Corning. The base and hardener were mixed at 10 : 1 w/w and degassed for 30 minutes. The degassed mixture was poured directly over the siliconphotoresist mold and left to cure at room temperature for 24 hours.
The airflow layer was composed of a 1.27 cm thick stainless steel (SS) piece with cut through channel pattern, and an aluminium closure, sealed with silicone gasket (all from McMaster Carr, NJ, USA). The channel pattern on the stainless steel was cut with wire EDM. The final air channel was 1.27 cm deep and 500 μm wide. An airflow passage was created by drilling a hole on the side of the stainless steel part, which fits a connector to the vacuum pump.
The Teflon™ (PTFE) laminated membrane, 1 μm pore size self-adhered to the PDMS liquid layer to form a channel. The liquid channel was then aligned and lightly pressed against the SS air channel; later applied vacuum pressure holds the entire layers. The complete system is shown in Fig. 2.
3.2. Bacteria preparation and handling
To prepare the bacteria samples, approximately 100 μL of frozen culture were incubated in 15–20 mL of LB media in a 25 mL flask, shaken at 250 rpm at 37 °C for 16 hours. A fresh inoculation was done by transferring 5 μL of the first incubation to 15–20 mL of LB media in a 25 mL flask, shaken at 250 rpm at 37 °C for 6 hours. Before evaporation experiments, 2 mL of the liquid culture from the second inoculation were centrifuged at 10 000 rpm for 1 minute. The pellet was resuspended in 200 μL of ultrapure sterilized water (Simplicity UV System, Millipore, MA, USA). This exchange of media from LB media to ultrapure sterilized water by centrifugation ensured that SERS was probing the intrinsic property of the pathogen surfaces, unaffected by chemical components in the culture media. A serial dilution of the culture in water was prepared.
Standard bacteria counting technique was used to find the concentration of the original samples of Escherichia coli K-12 (12-4500, ATCC, Manassas, VA) and Methicillin-Sensitive Staphylococcus aureus (MSSA) (25904, ATCC, Mananssas, VA). For E. coli, 3.7% w/w of the LB agarose (EMD, NJ, USA) was mixed with DI water, boil to dissolve, then autoclaved to sterilize. The liquid agarose was poured to make LB gel plates and cooled in room temperature. For MSSA, Mannitol Salt Agar plates (Fisher Scientific #B21173X, USA) were purchased. For both bacteria, after serial dilution, 100 μL of each concentration were spread over the corresponding gel plate in triplicate, left to dry in room temperature, and incubated inverted at 37 °C overnight. The CFU counts in the next day allowed back calculation of the original concentration of the bacteria.
3.3. E. coli concentration and recovery efficiency
The evaporation microfluidic was tested with E. coli samples for recovery efficiency, defined as the ratio of bacteria concentrated into a volume of 500 nL divided by the initial number of bacteria in 100 μL of starting sample.
To visualize the bacteria concentration, E. coli was stained with fluorescent Live/Dead® BacLight™ Bacterial Viability Kit (Molecular Probes, OR, USA). Specifically, for each 1 mL of E. coli resuspended in DI water, 3 μL of the dye were added. The stained bacteria were incubated for 15 minutes in the dark at room temperature. After incubation, the stained bacteria were centrifuged at 10 000 rpm for 1 minute to remove excessive dye. The pellet was resuspended in 1 mL of ultrapure sterilized water.
To operate the microfluidic concentrator, a vacuum pump was connected to an air outlet, such that air was pumped in from the ambient through desiccators to the airflow channel at a pressure of 30 in Hg (see ESI† for demonstration of device operation). After serial dilution, starting from the lowest concentration, a 100 μL drop of fluorescent E. coli sample was pipetted to the inlet and allowed to completely fill the sample flow channel, driven by the negative pressure built inside the channel through the porous membrane. After the sample had filled the entire channel, fluid from the sample was continuously evaporated, causing the fluid meniscus to travel along the channel. The evaporation was stopped by turning off the vacuum pump when the sample volume reached 500 nL at the end of sample flow channel. Fluorescence images of the outlet and along the channel were taken. Three images of the terminal 1 cm of the channel for initial E. coli concentrations 4.5 × 10⁵, 4.5 × 10⁶, and 4.5 × 10⁷ CFU mL−1 are shown in Fig. 3. All other regions of the channel did not fluoresce. After each run, the channels were washed in running DI water and ethanol, such that no residual fluorescence was confirmed using microscope before the next run with higher concentration of E. coli. The fluorescent images were processed with ImageJ (http://rsb.info.nih.gov/ij/) to calculate the ratio of fluorescence intensity in the terminal 7.14 mm (500 nL/100 μm/700 μm) of the channel versus in the entire channel. The fluorescence intensity was subtracted by the area-averaged background, and normalized to the exposure time and the gain. The fluorescence intensity was calibrated to represent bacterial concentration, thus used to calculate the recovery efficiency.
Fig. 3.
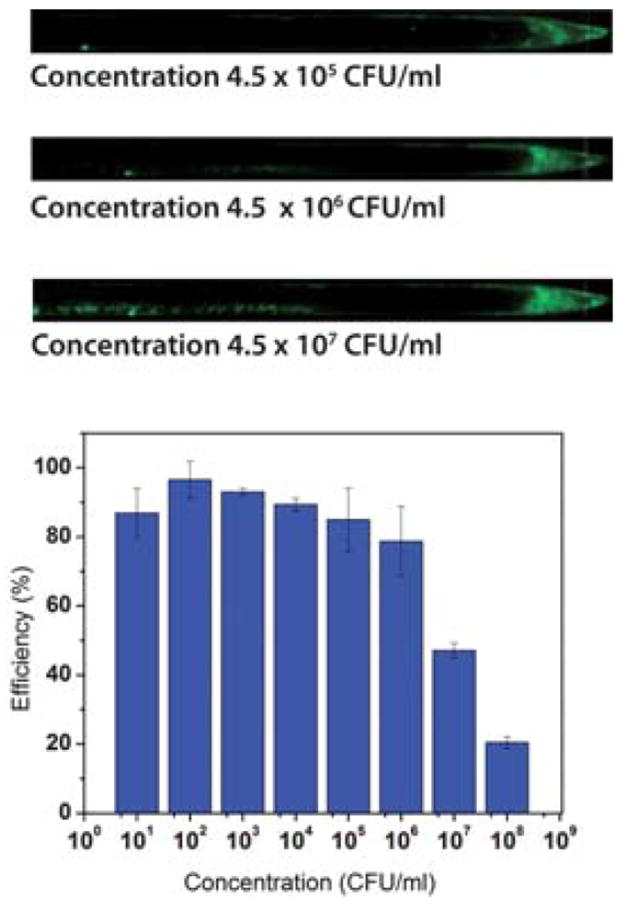
Results of the concentration microfluidics; top: fluorescence image of concentrated E. coli at the end of the channel; the images show the last 1 cm of the channel. Bottom: concentration–efficiency from different initial bacteria concentrations.
3.4. SERS measurement on MSSA
MSSA was selected as an example of clinically relevant bacteria, to test the effect of the evaporation microfluidics on the SERS detection sensitivity. Starting from the lowest concentration, 100 μL MSSA were evaporated in the device, as described in the E. coli concentration section, until 300 nL remained. After evaporation had stopped, the PDMS–Teflon™ liquid layer was detached from the stainless steel air layer. The Teflon™ membrane was separated carefully from the PDMS with tweezers. The concentrated sample near the end of sample flow channel was collected with a pipette and dispensed onto the SERS substrate. In parallel, a 300 nL drop from the original sample, without any evaporation, was also dispensed onto a second SERS substrate. The SERS substrate used was fabricated using an in situ reduced sol–gel method as previously detailed.6 The active substrate consists of clusters of gold nanoparticles sized around 50–100 nm on the surface of a silicon dioxide matrix. The substrates are 2 mm in diameter. The drops were left to dry in air at room temperature for 5 min.
To perform SERS on the bacteria, a 785 nm diode laser irradiated an area of 2 μm by 20 μm at a power of 2.5 mW. All SERS spectra and images were obtained with 10 seconds of integration time and 50× objective in a Renishaw Raman microscope (model RM-2000). Fig. 4a shows the SERS spectra of the 2 × 10⁶ and 2 × 10⁴ CFU mL−1 MSSA dilutions before concentration. Fig. 4b shows the same SERS spectrum of 2 × 10⁶ CFU mL−1 before evaporation, and the spectra for the 2 × 10⁴, 2 × 10³, 2 × 10² CFU mL−1 starting dilutions of MSSA after concentration by evaporation.
Fig. 4.
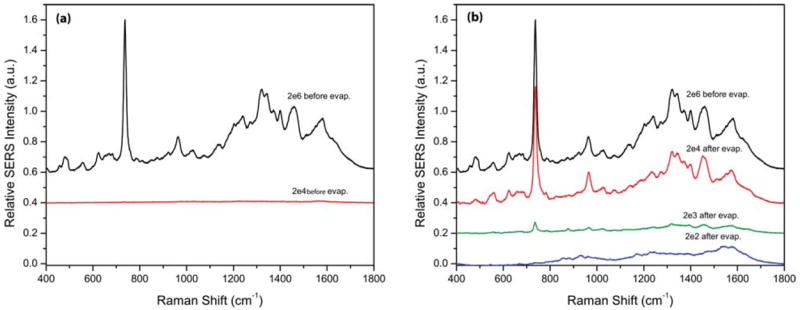
SERS spectra from before and after evaporation. (a) SERS spectra of 2 × 10⁶ and 2 × 10⁴ CFU mL−1 MSSA before concentration by evaporation. (b) SERS spectrum of 2 × 10⁶ CFU mL−1 before evaporation, and those of 2 × 10⁴, 2 × 10³, 2 × 10² CFU mL−1 initial dilution MSSA after concentration by evaporation.
4. Results and discussion
The goal of evaporation concentration for SERS is to preserve as many living bacteria cells as possible, while reducing the fluid volume. In Fig. 3, the total fluorescence in the channels increased as initial concentration of bacteria increased. For high initial concentrations, bacteria adhered to the channel wall and left a long tail of fluorescence behind near the outlet. This effect is likely due to the higher probability of a pathogen touching the wall in a more concentrated sample. Bacteria left behind on the channel wall were considered loss in the process. Two approaches were implemented in the design to minimize this loss.
First, the shape of the liquid meniscus is strongly affected by the hydrophobicity of the material that makes up the fluid channel. It can be parabolic in the case of a hydrophilic material, or flat in the case of a hydrophobic material. The capillary force between the analyte and the liquid pushes the analyte from the thick to the thinner fluid layer, moving it closer to the region in contact with the channel wall. A parabolic meniscus profile is unfavorable as more analyte is likely to be left behind on the channel wall in the long thin part of the meniscus as liquid is evaporated instead of being carried along with it, due to the increased interactions of the analyte with the wall in these constrained conditions. To prevent analyte loss due to adhesion to the microchannel wall, the channel material should be hydrophobic. In this case, the (untreated) PDMS and Teflon™ that form the channel are both hydrophobic materials.
Second, in this design, the air channel is 500 μm wide, while the liquid channel is 700 μm wide, 200 μm wider than the gas channel. It was important to note that when convective gas flows, the Teflon™ membrane deflects toward the gas channel, increasing the liquid channel height, and causing a capillary effect again drawing fluid and bacteria towards the narrower region close to the channel wall. When the liquid channel was narrower, even though some deflection of the membrane still occurred, the fluid and bacteria were confined to the central 500 μm of the channel, away from the walls, preventing some of the loss.
Furthermore, it is widely known that high initial concentration samples are not clinically relevant. Patients with high concentrations of infectious bacteria in the body would usually be given a high dose of broad spectrum antibiotics in the emergency room. Diagnoses are likely made based on clinical symptoms, instead of pathological results. Therefore, patient samples containing low bacterial concentrations are the major concerns for early stage diagnostics. Significant loss of bacteria was not observed for low initial concentration tests. Fig. 3 shows the percentage recovery efficiency versus initial bacteria concentration. The recovery efficiency was above 85% for all initial concentrations lower than 1 × 10⁴ CFU mL−1. In the lowest initial concentration cases, 100 μL initial volumes of bacteria solution at 100 CFU mL−1 were concentrated into 500 nL droplets with greater than 90% efficiency in 15 min at room temperature, showing the functionality of the device.
As seen in Fig. 4a, there was no characteristic SERS signal detectable for the 2 × 10⁴ CFU mL−1 MSSA dilution or lower before concentration by evaporation. The chance that any laser irradiated area of 2 μm by 20 μm would line up with both a bacterium and a SERS “hot spot” is too low at these conditions. Because there will be a total of approximately 6 CFU in 300 nL at this dilution.
After evaporation, as seen in Fig. 4b, both 2 × 10⁴ and 2 × 10³ CFU mL−1 initial dilutions of MSSA produced the expected characteristic SERS spectra. The shapes of the spectra are virtually identical with those of the 2 × 10⁶ CFU mL−1 MSSA samples before evaporation. The signal intensity of the 2 × 10⁴ CFU mL−1 spectrum was over 100-fold enhanced after evaporation compared to before evaporation. In addition, the intensity of the concentrated 2 × 10⁴ CFU mL−1 sample was nearly as strong the 2 × 10⁶ CFU mL−1 MSSA before evaporation spectrum. The peak at 730 cm−1 was approximately 0.76 (a.u.) after evaporation, compared to less than 0.89 × 10⁻² (a.u.) before evaporation. This supports the hypothesis that the evaporation microfluidics preserved the bacteria in the original 100 μL of 2 × 10⁴ CFU mL−1 sample (containing an absolute CFU count of approximately 2 × 10³), and concentrated it into 300 nL of volume, reaching a concentration close to 106 CFU mL−1.
Conclusion
The device described in this paper used enhanced evaporation to concentrate volumes of hundreds of microlitres of a biological fluid into nanoliters as a matter of minutes. Compared to electrophoresis which requires the addition of high salt buffers, the method preserves the surface charges on the bacteria, which is important to obtaining a consistent and characteristic SERS signal from our substrates.6 We have demonstrated rapid concentration of live bacteria in a low cost and disposable microfluidic device. It was very simple to fabricate and assemble, and is efficient. Using this device, the concentrated bacteria samples produced significantly higher SERS signals when compared to samples that were not concentrated.
The current design allows for the evaporation to run until the desired final volume is reached at the sample outlet. Therefore, the extent of concentration is flexible and can be modified, depending on the point when the pump is turned off. Viral samples, in addition to bacterial samples, could be concentrated in this device to avoid the use of a costly large-scale ultracentrifuge. Furthermore, integrated microfluidics including this concentration device as a sample preparation module could be developed.
Supplementary Material
Acknowledgments
This work was supported by the Department of Defense under ARL Cooperative Agreement No. W91NF-06-2-0040 and the Center for Integration of Medicine and Innovative Technology (CIMIT) graduate fellowship.
Footnotes
Electronic supplementary information (ESI) available: a time lapse video of food dye being evaporated and concentrated in the microfluidic device described in the paper. See DOI: 10.1039/c0lc00051e
References
- 1.Bouza E, Sousa D, Rodriguez-Creixems M, Lechuz JG, Munoz P. J Clin Microbiol. 2007;45:2765–2769. doi: 10.1128/JCM.00140-07. [DOI] [PMC free article] [PubMed] [Google Scholar]
- 2.Sikes HD, Jenison R, Bowman CN. Lab Chip. 2009;9:653–656. doi: 10.1039/b816198d. [DOI] [PubMed] [Google Scholar]
- 3.Mabey D, Peeling RW, Ustianowski A, Perkins MD. Nat Rev Microbiol. 2004;2:231–240. doi: 10.1038/nrmicro841. [DOI] [PubMed] [Google Scholar]
- 4.Zhang X, Young MA, Lyandres O, Van Duyne R. J Am Chem Soc. 2005;127:4484–4489. doi: 10.1021/ja043623b. [DOI] [PubMed] [Google Scholar]
- 5.Chu HY, Liu Y-J, Huang Y-W, Zhao Y-P. Opt Express. 2007;15:12230–12239. doi: 10.1364/oe.15.012230. [DOI] [PubMed] [Google Scholar]
- 6.Premasiri WR, Moir DT, Klempner MS, Krieger N, Jones G, Ziegler LD. J Phys Chem B. 2005;109:312–320. doi: 10.1021/jp040442n. [DOI] [PubMed] [Google Scholar]
- 7.Jarvis RM, Goodacre R. Anal Chem. 2004;76:40–47. doi: 10.1021/ac034689c. [DOI] [PubMed] [Google Scholar]
- 8.Castellanos A, Ramos A, Gonzalez A, Green NG, Morgan H. J Phys D: Appl Phys. 2003;36:2584–2597. [Google Scholar]
- 9.Zhou R, Wang P, Chang HC. Electrophoresis. 2006;27:1376–1385. doi: 10.1002/elps.200500329. [DOI] [PubMed] [Google Scholar]
- 10.Wu J. IEEE Trans Nanotechnol. 2006;5:84–89. [Google Scholar]
- 11.Ocvirk G, Munroe M, Tang T, Oleschuk R, Westra K, Harrison DJ. Electrophoresis. 2000;21:107–115. doi: 10.1002/(SICI)1522-2683(20000101)21:1<107::AID-ELPS107>3.0.CO;2-Y. [DOI] [PubMed] [Google Scholar]
- 12.Boguslaw B, Szumski M, Klodzinska E, Dahm H. J Sep Sci. 2003;26:1045–1049. [Google Scholar]
- 13.Lay C, Teo CY, Zhu L, Peh XL, Ji HM, Chew B-R, Murthy R, Feng HH, Liu W-T. Lab Chip. 2008;8:830–833. doi: 10.1039/b800015h. [DOI] [PubMed] [Google Scholar]
- 14.Zhu L, Zhang Q, Feng H, Ang S, Chau FS, Liu W-T. Lab Chip. 2004;4:337–341. doi: 10.1039/b401834f. [DOI] [PubMed] [Google Scholar]
- 15.Berthier E, Warrick J, Yu H, Beebe DJ. Lab Chip. 2008;8:852–859. doi: 10.1039/b717422e. [DOI] [PMC free article] [PubMed] [Google Scholar]
- 16.Berthier E, Warrick J, Yu H, Beebe DJ. Lab Chip. 2008;8:860–864. doi: 10.1039/b717423c. [DOI] [PMC free article] [PubMed] [Google Scholar]
- 17.Sharma NR, Lukyanov A, Bardell RL, Seifried L, Shen M. Microfluidics, BioMEMS, and Medical Microsystems VI, San Jose, CA, USA. 2008 [Google Scholar]
- 18.Timmer BH, van Delft KM, Olthuis W, Bergveld P, van den Berg A. Sens Actuators B. 2003;91:342–346. [Google Scholar]
- 19.Walker GM, Beebe DJ. Lab Chip. 2002;2:57–61. doi: 10.1039/b202473j. [DOI] [PubMed] [Google Scholar]
- 20.Zimmermann M, Bentley S, Schmid H, Hunziker P, Delamarche E. Lab Chip. 2005;5:1355–1359. doi: 10.1039/b510044e. [DOI] [PubMed] [Google Scholar]
- 21.Kralchevsky PA, Denkov ND. Curr Opin Colloid Interface Sci. 2001;6:383–401. [Google Scholar]
- 22.Desai SP, Taff BM, Voldman J. Langmuir. 2008;24:575–581. doi: 10.1021/la702827v. [DOI] [PubMed] [Google Scholar]
- 23.Younan X, George MW. Angew Chem Int Ed. 1998;37:550–575. [Google Scholar]
Associated Data
This section collects any data citations, data availability statements, or supplementary materials included in this article.