

Abstract
We evaluated program capacity factors associated with client outcomes in publicly funded substance abuse treatment organizations in one of the most populous and diverse regions of the United States. Using multilevel cross-sectional analyses of program data (n = 97) merged with client data from 2010–2011 for adults (n = 8,599), we examined the relationships between program capacity (leadership, readiness for change, and Medi-Cal payment acceptance) and client wait time and treatment duration. Acceptance of Medi-Cal was associated with shorter wait times, whereas organizational readiness for change was positively related to treatment duration. Staff attributes were negatively related to treatment duration. Overall, compared to low program capacity, high program capacity was negatively associated with wait time and positively related to treatment duration. In conclusion, program capacity, an organizational indicator of performance, plays a significant role in access to and duration of treatment. Implications for health care reform implementation in relation to expansion of public health insurance and capacity building to promote health equities are discussed.
Keywords: program capacity, leadership, readiness for change, racial and ethnic disparities, treatment outcomes
Addiction health services (AHS) organizations in the United States confront an unprecedented challenge to reduce health disparities among racial and ethnic minority populations (Alegría et al., 2006; Amaro, Arévalo, Gonzalez, Szapocznik, & Iguchi, 2006; Marsh, Cao, Guerrero, & Shin, 2009). Community-based treatment programs may be organizationally unprepared to contend with the new payment and service delivery changes precipitated by health care reform (Jarvis, 2010; Rawson & McLellan, 2010); therefore, it is critical to identify program capacity factors that may help reduce disparities. Emerging models of capacity building to improve service delivery and engage clients in AHS have highlighted the role of program leaders (Edwards, Knight, Broome, & Flynn, 2010), staff readiness for change (Simpson & Flynn, 2007), and generation of different revenue sources. However, there is limited knowledge of what program factors may represent capacity to affect client outcomes, namely wait time and treatment duration. To help address this gap, the present study examined the association between program capacity—defined as effective leadership, organizational readiness for change, and acceptance of Medi-Cal (California’s Medicaid program) reimbursement for services—and two client outcomes critically important to AHS programs: wait time (i.e., access) and treatment duration (i.e., engagement).
Our focus on identifying program capacity factors among outpatient AHS providers related to serving hard-to-reach racial and ethnic minorities who would be most affected by the Affordable Care Act (ACA) increases this study’s significance. This study used county administrative data on client outcomes merged with program-level survey data to identify gaps in access and quality of care. This information is critical to federal and state insurance administrators, policy makers, local addiction treatment authorities, and community-based providers seeking to differentiate between high-capacity and low-capacity programs in relation to client outcomes (Blue Ribbon Task Force on NIDA Health Services Research, 2010; NIATx, 2011). The present study examined AHS programs located in low-income and minority communities in Los Angeles (L.A.) County during a period characterized by a critical need to respond to ACA legislation by increasing capacity to bill Medi-Cal and handle an increase in Medi-Cal eligibility in 2014 for an estimated 1 million people—mainly Latinos (40%) and Blacks (34%; California Health Interview Survey, 2009).
Conceptual Framework
Our conceptual framework (see Figure 1) outlines how key factors of the AHS organizational context may play a significant role in enhancing access to and engagement in care in underserved minority communities in relation to the expansion of public health insurance. As the ACA’s Medicaid expansion is implemented, an increasing number of uninsured clients will gain access to public health insurance and outpatient AHS provider organizations will experience a shift from primarily contract-based payment to an increasing dependence on public insurance reimbursement. To develop capacity to enhance treatment access and duration, program managers may need to use various mechanisms to develop strategic organizational climates and leadership (e.g., tailor organizational structures and processes, support staff development and motivation), invest in program readiness for change, and develop a billing and reporting system to transition from block grants to individual Medi-Cal reimbursement (Aarons, Ehrhart, Farahnak, & Sklar, 2014).
Figure 1.
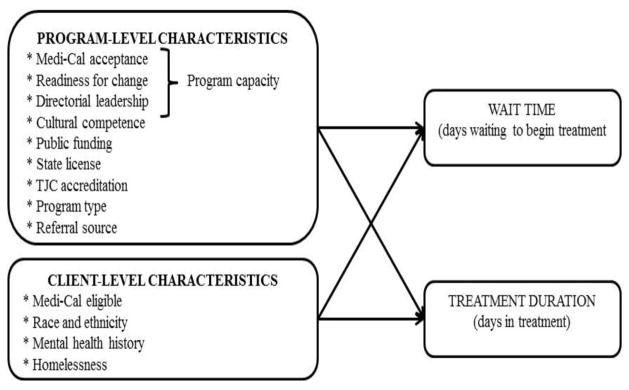
Conceptual framework of the effect of program cpacity on client engagement among publicly funded outpatient treatment programs.
Note. TJC, The Joint Commission
This study extended structural neoinstitutional theory with actor-oriented organizational development frameworks (i.e., leadership and organizational readiness for change) that are particularly relevant for community-based organizations. Neoinstitutional theory emphasizes that shifts in service provision result from mandates from the state, elite groups, and the professions, which incentivize or coerce organizations to adopt new practices using funding resources, policies, licensing, and other forms of capital and legitimacy (DiMaggio & Powell, 1983; Meyer & Rowan, 1977). Research has established that outpatient substance abuse treatment (OSAT) organizations are highly dependent on external funding and regulation to shape health and social services and culturally responsive practices (Gotham, Claus, Selig, & Homer, 2010; Guerrero, 2010; Simpson, Joe, & Rowan-Szal, 2007). Organizational capacity to respond to policy mandates and related opportunities in a timely fashion is contingent on how leaders interpret their funding and regulatory environments and decide to strategically invest scarce resources (Oliver, 1991; Peyrot, 1991; Pfeffer & Salancik, 1978; Simpson et al., 2007). Effective implementation of ACA’s client-centered provisions will likely rely heavily on leadership, strategic and proactive investment in program and staff development, and organizational readiness to adapt to a new payment and service delivery environment. As such, expansion of insurance may provide the resources and service delivery expectations necessary for leaders to increase financial and service delivery readiness, which is expected to increase access to and duration of OSAT (Guerrero, 2010).
Organizational Capacity Factors
Leadership
Leadership is an emerging focal point in efforts to develop organizational capacity and improve treatment services (Aarons, 2006; Aarons, Ehrhart, et al., 2014; Broome, Flynn, Knight, & Simpson, 2007; Garner, Hunter, Godley, & Godley, 2012; Guerrero, 2010; Guerrero & Andrews, 2011). Leadership styles in particular, such as transactional (guiding performance) and transformational (leading by example and motivating self-growth) leadership, are essential for fostering change (Avolio, Bass, & Jung, 1999). In OSAT organizations, these leadership styles have been associated with staff satisfaction (Broome et al., 2007; Edwards et al., 2010). Emerging research in health care also has highlighted the role of leadership in supporting strategic initiatives such as evidence-based practice implementation (Aarons, Farahnak, & Ehrhart, 2014) and efforts to leverage funding resources to foster an organizational process that improves both organizational capacity and client outcomes (Kaynak, 2003; Lozeau, Langley, & Denis, 2002; McConnell, Hoffman, Quanbeck, & McCarty, 2009; Shortell, Rundall, & Hsu, 2007).
Organizational readiness for change
Organizational processes associated with the implementation of new technologies or knowledge to successfully engage clients in OSAT has been described by the Texas Christian University (TCU) program change model (Simpson, 2004; Simpson & Flynn, 2007) and tested using the TCU Organizational Readiness for Change instrument (Lehman, Greener, & Simpson, 2002). Staff training and positive climate have been linked with increased treatment duration (Greener, Joe, Simpson, Rowan-Szal, & Lehman, 2007; Simpson et al., 2007). Treatment organizations will low readiness for change may be less able to enhance the delivery of care to improve client engagement (Fixsen, Naoom, Blase, Friedman, & Wallace, 2005; McConnell et al., 2009; McLellan, Carise, & Kleber, 2003; Sloboda & Schildhaus, 2002).
Medi-Cal payment acceptance
Because OSAT programs have historically been supported primarily by public funding (e.g., service contracts; D’Aunno, 2006) and health care reform shifted funding source from block grants to individualized Medi-Cal reimbursement, Medi-Cal payment acceptance is becoming a critical component of program capacity. By developing capacity to accept Medi-Cal payments, OSAT programs may increase their revenue, decrease funding uncertainty, and increase their investment in efforts to enhance treatment processes (Jarvis, 2010; Rawson & McLellan, 2010), such as client access to and duration in treatment. The present study expanded on previous research showing that client Medi-Cal eligibility and programs that offer culturally responsive services are associated with shorter wait times and increased treatment duration (Guerrero, 2013). By testing a model of program capacity to serve individuals primarily from low-income and racial and ethnic minority backgrounds, this study can inform health care policies to reduce disparities among urban Black and Latino clients.
Program capacity, wait time, and treatment duration
Among individuals seeking help for substance abuse issues, waiting to enter treatment is one of the most commonly cited barriers (Appel, Ellison, Jansky, & Oldak, 2004; Claus & Kindleberger, 2002; Farabee, Leukefeld, & Hays, 1998), whereas treatment duration (i.e., days in treatment) is a critical process outcome and robust predictor of reduced posttreatment substance use (Simpson, Joe, & Brown, 1997; Zhang, Friedmann, & Gerstein, 2003). It is well established that members of racial and ethnic minority groups are more likely than Whites to experience difficulty entering and staying in OSAT beyond 90 days and deriving subsequent benefits from treatment (Amaro et al., 2006; Marsh et al., 2009; Tonigan, 2003; Zhang et al., 2003). However, some studies have showed that this may not be the case when minorities are referred by the criminal justice system. In Los Angeles, Latinos report shorter wait to start treatment when referred by drug courts compared to other source of referrals (Grella & Joshi, 1999; Guerrero et al., 2013).
Overall, leadership and readiness for change are key components to adjusting service delivery to ensure disparities in treatment access and retention are minimized. This may include leaders who use “embedding mechanisms” to establish buy-in among staff to quickly implement service improvements, build the readiness of the program (infrastructure, computer systems, staff training, enhance motivation), and generate a culture of readiness (Aarons, Earhart, et al., 2014; Schein, 2010). Medi-Cal payment acceptance has become a key component of generating revenue for AHS programs because more than 30% of the client population attending publicly funded programs is Medi-Cal eligible. Although these programs may still rely on block grants to serve eligible Medi-Cal clients, block grant funding is becoming more limited and restrictive in terms of billable services, whereas Medi-Cal is increasing its billable services. Thus, we posited that these components may help programs located in minority communities decrease client wait time and increase treatment duration. Hence, we formulated the following hypotheses.
Hypothesis 1: OSAT program leadership, organizational readiness for change, and Medi-Cal payment acceptance will be negatively associated with client wait time.
Hypothesis 2: OSAT program leadership, readiness for change, and Medi-Cal payment acceptance will be positively associated with client treatment duration.
Beyond individual indicators of program capacity, emerging analytic frameworks have highlighted the importance of using program performance metrics to distinguish between high- and low-capacity programs (Garnick, Lee, Horgan, & Acevedo, 2009; Greener et al., 2007; McCarty et al., 2007), particularly based on client outcomes as advocated by health care reform (Andrulis, Siddiqui, Purtle, & Duchon, 2010). Because the extant literature has highlighted leadership, organizational readiness for change, and public insurance payment acceptance as sources of capacity building in OSAT, programs with high capacity may be able to expand service delivery (Guerrero, Aarons, & Palinkas, 2014) and improve access to and duration of care. In contrast, low-performing OSAT programs may not be as responsive to clients’ immediate need for treatment, turning them away, putting them on a waiting list, or not providing evidence-based engagement approaches to improve treatment duration. Using latent profile methods to test a program capacity measure represented by leadership, organizational readiness for change, and Medi-Cal acceptance, we hypothesized the following.
Hypothesis 3: High-capacity OSAT programs, characterized by more positive leadership, greater readiness for change, and Medi-Cal acceptance, would be associated with shorter wait times relative to low-capacity programs.
Hypothesis 4: High-capacity OSAT programs, characterized by strong leadership, greater readiness for change, and Medi-Cal acceptance, would be associated with longer treatment duration relative to low-capacity programs.
Limited empirical research has assessed the effect of program capacity factors and quality-of-care standards on client outcomes (D’Aunno, 2006), particularly treatment engagement among members of racial and ethnic minority groups (Guerrero, Campos, Urada, & Yang, 2012). Although a program’s degree of cultural competence is related to shorter wait time and increased treatment duration (Guerrero, 2013; Guerrero & Andrews, 2011), it is conceptually logical to expect that programs with the highest capacity and highest degree of cultural competence would be associated with the shortest wait time and longest treatment duration among minority clients. Thus, we hypothesized the following.
Hypothesis 5: (a) A negative relationship between high-capacity OSAT programs and wait time would be moderated by degree of cultural competence and (b) a positive relationship between high-capacity OSAT programs and treatment duration would be moderated by degree of cultural competence.
Methods
Sampling Frame and Data Collection
This study used a fully concatenated program and client data set collected in 2010–2011. The sampling frame included all 408 nonprofit substance abuse treatment programs funded by the Department of Public Health in L.A. County, California. The client data were drawn from the Los Angeles County Participant Reporting System (LACPRS). These systemwide evaluation data, collected by each provider on an ongoing basis, capture the treatment experience and immediate outcomes of a racially and ethnically diverse client population in the largest treatment system in the United States. Of the 141 items in the LACPRS survey, more than half comprise standardized scales with questions related to client admission, discharge, and health derived from state (California Outcome Measure System) and federal (Treatment Episode Data Set) measurement systems. Client data used in this study included 15,100 client treatment episodes collected from July 1, 2010, to December 30, 2011.
Data were also collected from a random sample of 147 publicly funded and nonprofit OSAT programs from the 350 programs located in communities with a population of 40% or more Black or Latino residents or both in L.A. County. Programs involving inpatient or residential treatment, the criminal justice system, or single practitioners were excluded from this sample because they have different length-of-stay criteria than OSAT programs.
We relied on a key-informant approach to collect program survey measures from clinical supervisors, in addition to other sources of data to cross-validate survey measures during follow-up site visits with 91% of the sample. To reduce the effect of upward reporting bias associated with managers’ reports on program context (Adams, Soumerai, Lomas, & Ross-Degnan, 1999; Lee & Cameron, 2009), we used a systematic approach to validate their responses. More specifically, we relied on counselors (89% of respondents) to provide qualitative data via semistructured interviews during site visits. During site visits, we used a matrix (Excel sheet) with key program features (e.g., staff training, services rendered, equipment) to cross-check consistency of supervisor reports on survey measures and our investigative team’s in vivo observations, and systematically collected qualitative reports from counselors related to those measures (e.g., staff attributes, resources during site visits). Programs were selected at random for site visits and the selection of counselors was based on a convenience sampling approach. Consistency was established when programs reported high or low organizational readiness for change scores and Medi-Cal billing and the investigative team confirmed that program met (high) or did not meet (low) at least two of the following three conditions: (a) adequate facilities and resources, (b) provision of indicated services, (c) and listed on the L.A. County Medi-Cal providers website. Inconsistency was represented by programs with high or low organizational readiness for change scores and reporting of Medi-Cal billing, but a visual inspection that found at least two inconsistent areas. Ten programs had such inconsistent reporting and a significant amount of missing data. Hence, these programs were not included in the final analytic sample.
Analytic Sample
The final analytic sample consisted of 97 programs and 8,599 client treatment episodes with full and verified information. Ninety-two percent of clinical supervisors responded to the online program survey. The final analytic sample decreased from 147 to 97 programs because 12 programs did not respond to the survey, 10 programs reported inconsistent data, 17 programs did not serve county clients in 2010–2011, and 11 programs had closed prior to survey data collection. The 50 excluded programs did not differ from the analytic sample in terms of main independent variables (p > .05). Rates of missingness were less than 16% across all survey measures.
Study Variables
We examined two dependent variables: (a) wait time to enter treatment and (b) treatment duration (i.e., days in treatment; see Table 1 for descriptive statistics). Wait time was measured at client intake and represented the client-reported number of days spent on a waiting list before starting treatment (78% of clients reported no wait). Treatment duration was measured at discharge and represented the number of days between admission and discharge dates as noted by counselors. Although the actual discharge date may vary by programs for unsuccessful cases, most programs consider two missed appointments as a criterion for discharge. Both variables were count measures that represented estimates of number of days. As analytic measures, they have been successfully used in several analyses (Friedmann, Lemon, Stein, & D’Aunno, 2003; Guerrero, Campos, et al., 2012; Guerrero, Cepeda, Duan, & Kim, 2012).
Table 1.
Program (N = 97) and Client (N = 8,599) Variables in Addiction Health Services
| Variables | n | M (SD) or n (%) | Response Format |
|---|---|---|---|
| Program characteristics | |||
| Medi-Cal acceptance | 95 | 72 (76%) | Accepts Medi-Cal payment reimbursement |
| Readiness for changea | 96 | 135.94 (21.60) | Sum of four measures |
| Motivation for change | 87 | 30.99 (5.74) | 21 items, e.g., Your program needs more training for effective implementation of EBPs |
| Resources | 89 | 38.05 (4.97) | 12 items, e.g., Your office and equipment are adequate. |
| Staff attributes | 95 | 40.41 (4.09) | 19 items, e.g., You are able to adapt quickly when you have to make changes |
| Organizational climate | 90 | 34.77 (4.61) | 16 items, e.g., You fell encouraged to try new and different techniques |
| Directorial leadership | 95 | 39.39 (6.84) | 9 items, e.g., Your director inspires others with plans for facility’s future |
| Cultural competence | 90 | 27.11 (4.19) | Overall cultural competence of 6 domains |
| Public funding | 78 | 0.35 (0.43) | Percentage of public funding in total funding during previous fiscal year |
| Program license | 96 | 92 (96%) | Licensed by state |
| TJC accreditation | 95 | 14 (15%) | Accredited by TJC |
| Program typeb | 8,599 | ||
| Outpatient | 8,104 (94%) | Primarily outpatient services | |
| Methadone | 495 (6%) | Primarily methadone maintenance services | |
| Referral sourceb | 8,599 | ||
| Self | 2,917 (34%) | Self-referred | |
| Community | 1,864 (22%) | Referred by community-based organization | |
| Proposition 36 | 1,676 (19%) | Referred by court via Proposition 36 in lieu of incarceration | |
| Drug court | 565 (7%) | Referred by drug court | |
| Social services | 1,577 (18%) | Referred by social services or county agency | |
| Client characteristics | |||
| Medi-Cal eligible | 8,599 | 4,531 (53%) | Eligible for Medi-Cal |
| Race and ethnicity | 8,599 | ||
| White | 1,901 (22%) | Self-identified as White | |
| Black | 1,968 (23%) | Self-identified as Black | |
| Latino | 3,912 (45%) | Self-identified as Latino | |
| Other | 818 (10%) | Self-identified as Asian or other | |
| History of mental health issues | 8,599 | 1,983 (23%) | Diagnosed with mental health issue in past |
| Homeless | 8,599 | 885 (10%) | Unstable housing status |
| Outcomes | |||
| Wait time | 8,599 | 1.18 (4.88) | Days waiting to start treatment |
| Treatment duration | 8,599 | 114.99 (104.03) | Days in treatment |
Note. TJC, The Joint Commission.
The subscales are an abbreviated version of the original organizational readiness for change measure.
Client-reported characteristics.
Independent variables of interest included Medi-Cal acceptance, four composite measures of organizational readiness for change, and a measure of directorial leadership. The TCU Organizational Readiness for Change (ORC-D4 version) instrument was used to measure program readiness to implement new practices using 68 out of the 101 items from the full version of the ORC-D4. These items are divided into four domains with 18 subscales: motivation for change (three subscales: program needs, training needs, and pressure for change; average α = .80), resources (five subscales: offices, staffing, training, equipment, and Internet access; average α = .74), staff attributes (four subscales: growth, efficacy, influence and adaptability; average α = .86), and organizational climate (six subscales; mission, cohesion, autonomy, communication, stress, and change; average α = .78; Gotham et al., 2010; Simpson et al., 2007). Informed by previous studies on components of the ORC measure (Greener et al., 2007; Lehman et al., 2002; Simpson et al., 2007) and to avoid overlap with similar concepts measured in the study, 33 items across the four domains were not included in the survey. The abbreviated subscale measures had Cronbach alpha values within the same range of the full version published elsewhere (Lundgren et al., 2011; Simpson et al., 2007). In addition, the subscale of organizational climate was not included in the final model due to collinearity issues. All items were rated on a 5-point Likert scale (1 = strongly disagree to 5 = strongly agree); higher scores represented greater readiness. The full scale is available online (http://ibr.tcu.edu/wp-content/uploads/sites/2/2013/10/ORC-S-sg.pdf).
The leadership scale consisted of nine items assessing agency or program director leadership. This measure included two subscales associated with implementation of evidence-based practices: transformational leadership characterized by intellectual stimulation, support for innovation, and integrity (seven items), and transactional leadership related to delegation and job expectations (two items; α = .96; Edwards et al., 2010). Clinical supervisors rated their directors’ leadership on a 5-point scale (1 = strongly disagree to 5 = strongly agree) and scores were totaled as suggested by the measure’s authors (Edwards et al., 2010). Higher scores represented higher levels of leadership among directors as reported by clinical supervisors.
To examine the interaction between program capacity and quality of care, which is generally associated with client engagement in treatment (Guerrero, 2013), we assessed programs’ degree of cultural competence for services delivered to Black and Latino clients. We relied on the Cultural Competence Self-Assessment Questionnaire (Mason, 1995). This measure of culturally competent practices is composed of six subscales with 57 items total. These subscales measured (1) knowledge of, (2) outreach to, and (3) personal involvement in racial and ethnic minority communities; (4) development of resources and linkages to serve racial and ethnic minorities; (5) development of policies and procedures to effectively respond to the service needs of racial and ethnic minority patients; and (6) hiring and duration of employees with racial and ethnic minority backgrounds. Sample items for each scale are presented in Table 1 (for a full description of items, see Mason, 1995). Reliabilities of the six subscales ranged from .69 to .85. Responses were rated on a 4-point Likert scale (1 = not at all to 4 = often) and averaged to create mean scores for each subscale. Higher scores indicated higher levels of program cultural competence in each subdomain as reported by supervisors.
Control variables were included at both the organizational and client level. Organizational characteristics included two program regulation measures associated with treatment outcomes in other research: (a) state licensure and (b) accreditation by the Joint Commission (Campbell & Alexander, 2002; D’Aunno, 2006; Guerrero & Andrews, 2011). At the client level, we accounted for several characteristics associated with wait time and treatment duration in other research, including client-reported Medi-Cal eligibility, gender, race and ethnicity, mental health history, and homelessness status (Evans, Li, & Hser, 2009; Guerrero & Andrews, 2011; Guerrero, Campos, et al., 2012; Marsh et al., 2009; Tonigan, 2003; Zhang et al., 2003). We also controlled for referral sources, particularly court referral and Proposition 36, which is a California initiative that refers individuals with less serious drug offenses to treatment in lieu of imprisonment (Guerrero, Cepeda, et al., 2012). See Table 1 for descriptive statistics and response formats.
Data Analysis
Stata/SE Version 12 was used to conduct all analyses. Two variables, accreditation by the Joint Commission and resources and linkages, had 16% missing data, whereas missing data for other variables was less than 10%. Multiple imputation was used to estimate missing values consistent with assumption of data missing at random (Rubin, 1987). Each missing value was replaced with 20 plausible values using the Markov Chain Monte Carlo method (Schaefer, 1997). Imputation was conducted for program and client variables independently. Twenty imputed data sets were developed, merged, and analyzed using Stata’s MI IMPUTE and MI ESTIMATE commands.
We also relied on Stata for our multilevel negative binomial regression analyses, using MI ESTIMATE: NBREG with a log link function (Stata, 2012). The CLUSTER option was used to account for the multilevel structure of the data (clients nested in programs) and obtain more accurate estimates of standard errors (Blakely & Woodward, 2000), as suggested in other research (see Guerrero, Cepeda, et al., 2012; Marsh et al., 2009). In particular, negative binomial regression with robust standard errors was used to analyze overdispersed wait time and duration measures (i.e., their variance was much greater than their mean; Cameron & Trivedi, 2009). Compared to Poisson regression, which is generally used to model count data, negative binomial analysis is more efficient at modeling overdispersed outcomes using the extra parameter of exposure to an event (Cameron & Trivedi, 2009; Xiang, Lee, Yau, & McLachlan, 2007). Client age was used to differentiate between event exposure (wait time and duration), consistent with other studies (see Guerrero, 2013; von Sydow, Lieb, Pfister, Höfler, & Wittchen, 2002).
The parameters presented in negative binomial regression are expressed as incidence rate ratios (IRRs). IRRs can be interpreted as the estimated rate ratio for a 1-unit increase in the independent variable, given the other variables are held constant in the model. For example, if a score for personal involvement in minority communities (range = 0–50) increased by 1 point, the ratio for number of wait days would be expected to decrease by a factor of IRR = 0.878.
We conducted four main models. The first two models tested individual components of program capacity (i.e., leadership, readiness for change, Medi-Cal acceptance) on wait time and treatment duration using two negative binomial regression models (see Table 2). The third and fourth models relied on two negative binomial regression models using a latent class variable as the main independent variable of interest representing high-capacity programs (see Table 3).
Table 2.
Multilevel Negative Binomial Regression of Program Capacity Factors on Wait Time and Treatment Duration
| Wait Time | Treatment Duration | |||||
|---|---|---|---|---|---|---|
| IRR | SE | 95% CI | IRR | SE | 95% CI | |
| Medi-Cal acceptance | 0.306*** | 0.100 | 0.161, 0.582 | 0.958 | 0.079 | 0.821, 1.119 |
| Readiness for change | ||||||
| Motivation for change | 0.982 | 0.012 | 0.959, 1.006 | 1.011* | 0.005 | 1.000, 1.021 |
| Resources | 1.050 | 0.039 | 0.974, 1.133 | 0.998 | 0.008 | 0.982, 1.014 |
| Staff attributes | 0.908 | 0.050 | 0.823, 1.003 | 0.979** | 0.007 | 0.965, 0.993 |
| Directorial leadership | 0.983 | 0.045 | 0.899, 1.075 | 1.006 | 0.005 | 0.995, 1.016 |
Note. Organizational climate, a subscale of readiness for change, was not included because it was correlated with staff attributes at 82%. We adjusted for program-level variables (private insurance, organizational cultural competence, public health services, and public funding) and client-level variables (gender, mental illness, homeless, Medi-Cal eligibility, referral type, race, and treatment type).
p < .05;
p < .01;
p < .001
Table 3.
Multilevel Negative Binomial Regressions of Program Capacity on Wait Time and Treatment Duration
| Wait Time | Treatment Duration | |||||
|---|---|---|---|---|---|---|
| IRR | SE | 95% CI | IRR | SE | 95% CI | |
| Program characteristics | ||||||
| High program capacity | 0.021*** | 0.009 | 0.009, 0.046 | 1.295*** | 0.074 | 1.159, 1.447 |
| High cultural competence | 1.016 | 0.089 | 0.856, 1.207 | 1.157*** | 0.040 | 1.081, 1.238 |
| High capacity × high cultural competence | 0.003 | 9.927 | 0.001, 0.006 | 0.930 | 0.123 | 0.716, 1.208 |
| Public funding | 0.990*** | 0.001 | 0.988, 0.991 | 1.000 | 0.000 | 0.999, 1.001 |
| License | 0.402*** | 0.108 | 0.238, 0.680 | 1.148* | 0.081 | 1.000, 1.318 |
| Accreditation | 1.166 | 0.123 | 0.947, 1.434 | 1.050 | 0.043 | 0.970, 1.137 |
| Methadone | 0.533 | 0.213 | 0.243, 1.167 | 0.849* | 0.055 | 0.749, 0.964 |
| Referral sourcea | ||||||
| Community | 2.275*** | 0.257 | 1.823, 2.840 | 0.946 | 0.027 | 0.895, 1.000 |
| Proposition 36 | 3.466*** | 0.360 | 2.828, 4.247 | 0.826*** | 0.027 | 0.775, 0.880 |
| Drug court | 1.537** | 0.218 | 1.163, 2.031 | 1.009 | 0.040 | 0.934, 1.089 |
| Social services | 1.735*** | 0.185 | 1.408, 2.137 | 0.849*** | 0.026 | 0.799, 0.902 |
| Client characteristics | ||||||
| Medi-Cal eligible | 0.496*** | 0.132 | 0.294, 0.835 | 1.105*** | 0.029 | 1.051, 1.163 |
| Race | ||||||
| Black | 0.811* | 0.072 | 0.681, 0.966 | 0.975 | 0.027 | 0.923, 1.029 |
| Latino | 0.771*** | 0.054 | 0.672, 0.884 | 0.989 | 0.024 | 0.943, 1.037 |
| Other | 0.808 | 0.105 | 0.627, 1.043 | 1.008 | 0.042 | 0.928, 1.094 |
| Mental health issues | 1.041 | 0.080 | 0.895, 1.210 | 1.004 | 0.024 | 0.959, 1.052 |
| Homeless | 0.702*** | 0.067 | 0.583, 0.847 | 0.925* | 0.030 | 0.869, 0.985 |
Note. Low program capacity, low cultural competence, outpatient, self-referral, and White served as reference categories for program capacity, program type, referral source, and race and ethnicity, respectively.
Measures at the client level.
p < .05;
p < .01;
p < .001.
To develop the latent class variable, we relied on latent profile analysis to identify levels of program capacity. We relied on leadership, readiness for change, and Medi-Cal acceptance to develop latent classes. Latent profile analysis can incorporate continuous, ordinal, and categorical indicators, in contrast to latent class analysis, which can only accommodate categorical indicators. We determined latent classes that represented different levels of program capacity by considering different solutions for multiple latent profiles (e.g., two classes, three classes, etc.). Established procedures and statistics such as the Bayesian information criterion allowed us to determine the appropriate number of classes (Muthén, 2001). Consistent with benchmarking methodologies used in NIATx (2011) studies, we relied on this latent class variable as a main independent variable in Table 3.
The relationship between program capacity and client outcomes was evaluated after controlling for program and client covariates. The fundamental equation (Lazarsfeld & Henry, 1968) of the latent profile model (Equation 1) was expressed as:
In Equation 1, i and j (i ≠ j) are index-specific variables and k designates a specific latent class, such that μik represents the mean and represents the variance for variable i in group j, k is the total number of latent classes, and πk indicates the proportion of cases belonging to each class ( ). After testing a series of competing models with different latent classes and comparing model estimates, we selected two as the appropriate number of latent classes. These two classes represented high- and low-capacity programs. This categorization represents differences in organizational resources and responsiveness and is consistent with the current literature that highlights two distinct type of AHS organizations: small, recovery-oriented and community-based treatment providers versus large providers that are part of a corporate parent health care organization (Chalk, 2010; McLellan et al., 2003; Rawson & McLellan, 2010).
Results
Findings partially supported Hypothesis 1. Medi-Cal acceptance was the only capacity factor negatively associated with wait time (IRR = 0.306, p < .001). Findings partially supported Hypothesis 2. Readiness for change measured by motivation for change was positively associated with treatment duration (IRR = 1.011, p < .05). However, staff attributes were negatively associated with treatment duration (IRR = 0.979, p < .01). See Table 2 for results regarding Hypotheses 1 and 2.
Findings supported Hypothesis 3. The latent variable representing high-program capacity (high leadership, readiness for change, and having a Medi-Cal payment system) was negatively associated with wait time (IRR = 0.021, p < .001) after controlling for all other organizational and client factors (see Table 3).
Findings also supported Hypothesis 4. The latent variable representing high-program capacity was positively associated with treatment duration (IRR = 1.295, p < .001) after controlling for all other organizational and client factors.
Findings did not support Hypothesis 5, i.e., the degree of cultural competence did not moderate the relationship between high-capacity OSAT programs and wait time (Hypothesis 5a), nor did cultural competence moderate the relationship between high-capacity OSAT programs and treatment duration (Hypothesis 5b).
Table 3 also shows other statistically significant relationships. Consistent with other studies, a high degree of cultural competence was associated with longer treatment duration (IRR = 1.157, p < .001). Public funding (IRR = 0.990, p < .001) and licensed programs (IRR = 0.402, p < .001) were negatively associated with wait time. Compared to self-referral, all other referral sources were positively related to wait time. Compared with non-Latino Whites, Blacks (IRR = 0.811, p < .05) and Latinos (IRR = 0.771, p < .001) were negatively related to wait time. Finally, homelessness was also negatively associated with wait time (IRR = 0.702, p < .001).
Treatment duration was also positively associated with several program and client characteristics. Compared to a low degree of cultural competence, programs with high cultural competence were positively related to treatment duration (IRR = 1.157, p < .001). Licensed programs were also positively related to treatment duration (IRR = 1.148, p < .05), whereas methadone programs were associated with shorter treatment duration, as expected (IRR = 0.849, p < .05). Compared to self-referral, Proposition 36 (IRR = 0.826, p < .001) and social services referrals (IRR = 0.849, p < .001) were negatively related to treatment duration, as was homelessness (IRR = 0.925, p < .05). A positive relationship was found between treatment duration and Medi-Cal-eligible clients (IRR = 1.105, p < .001).
Discussion
Findings partially supported our organizational capacity framework, which posited that high-capacity community-based programs, those with greater leadership and readiness for change, and those that accepted Medi-Cal would report decreased client wait times (i.e., better access) and increased treatment duration (i.e., better engagement) than low-capacity outpatient treatment programs. When testing a latent class that measured program capacity to reduce disparities in care, clients in minority communities reported greater access to and duration in care. As latent measures, leadership, readiness for change, and Medi-Cal acceptance were related to decreased wait time and increased treatment duration, and some individual indicators of capacity were also related to these client process outcomes.
Medi-Cal acceptance was the most important single component of program capacity negatively associated with wait time. This is an important finding for building program capacity in an era of expanded public health insurance (Andrulis et al., 2010; Guerrero, 2013; Rawson & McLellan, 2010). Indeed, individuals eligible for Medi-Cal were more likely than ineligible clients to initiate treatment faster and stay in treatment longer, suggesting that both client eligibility and program capacity to accept Medi-Cal are important components of access to care in AHS.
Other important structural factors associated with access to care, namely public funding and program licensure, were associated with reduced wait times. These findings are consistent with the neoinstitutional theory argument that through funding resources, policies, and licensing, the state incentivizes or coerces organizations to meet goals with public cachet (DiMaggio & Powell, 1983; Meyer & Rowan, 1977), such as immediate access to care. Findings also support a growing body of empirical research suggesting that the dependence of OSAT organizations on external funding and regulation allow them to become responsive to client service needs (Gotham et al., 2010; Guerrero, 2010; Simpson et al., 2007).
Wait time to access treatment was longer for most referrals sources compared to self-referral. This finding is concerning, because most referrals do not originate with the client (66%). Findings in the literature regarding the role of referrals in access to AHS have been inconsistent (Greenfield et al., 2007). Yet referral by criminal justice sources plays an important role in treatment duration and completion, particularly for ethnic minorities (Grella & Joshi, 1999; Guerrero et al., 2013). Thus, factors and processes related to criminal justice, public health, and social service referrals that enhance access to care require further investigation.
Black and Latino clients, compared to non-Latino Whites, had negative associations with wait time. In a publicly funded system in which minority clients account for more than 75% of all clients served, it is critical to further investigate the enabling processes that improve access for all clients. In particular, after accounting for program capacity and quality of care (i.e., cultural competence), future research should consider identifying sociodemographic and racial and ethnic factors associated with selecting programs that rely on evidence-based practices to engage all clients.
In terms of treatment duration, motivation for change, a subscale of readiness for change, was positively associated with treatment duration, whereas staff attributes for change were negatively associated with treatment duration. Albeit speculative, program and staff development in terms of satisfied program and training needs and pressure for change (subscales of motivation for change) may be a better measure of quality of care to engage clients compared to supervisor reports on staff attributes (i.e., growth, efficacy, influence, and adaptability). The negative relationship between staff attributes and treatment duration is puzzling. The assumption is that a well-trained and professional workforce may be better equipped to engage clients. However, the scale assessing staff attributes related to organizational readiness for change was not designed to capture specific skills to engage racial and ethnic minority clients, such as a direct measure of cultural competency. Consistent with emerging studies (Guerrero, 2013; Guerrero, Campos, et al., 2012) and study findings, programs with high degree of cultural competence is associated with higher retention of minority clients in care.
Also consistent with other research, there was a positive association between program licensure and treatment duration, whereas compared to regular OSAT programs, methadone programs showed a negative association with treatment duration. As previously indicated, institutional resources may support program capacity to engage clients (Gotham et al., 2010; Guerrero, 2010; Simpson et al., 2007). Reduced treatment duration in methadone maintenance programs may be expected because these programs are mainly detoxification and outpatient stabilization programs, which compared to regular OSAT may have shorter treatment duration rates. As for referral sources, compared to self-referral, Proposition 36 (i.e., probation and treatment rather than incarceration) and social services referrals were negatively related to treatment duration, potentially signaling that these clients move through their treatment episode more efficiently compared to self-referral. Finally, clients entering services via Proposition 36 referrals are more likely than self-referred clients to complete treatment (Guerrero et al., 2013), suggesting that criminal justice oversight may, on average, shorten clients’ stay in any given treatment episode.
Limitations
Limitations associated with study data must be considered when interpreting findings. First, all measures were derived from cross-sectional data, preventing inference of causality or directionality. However, the large sample of programs and clients provided robust estimates. Second, program measures were provided by one manager per program, potentially leading to social desirability. Informed by large organizational studies (D’Aunno, 2006; Knudsen, Ducharme, & Roman, 2006; Roman, Abraham, & Knudsen, 2011), this study’s key-informant model with cross-validation checks allowed collection of system data from a larger number of programs. Some studies have suggested relying on multiple informants to identify significant variability among staff members regarding organizational climate variables (Courtney, Joe, Rowan-Szal, & Simpson, 2007) or reduce response bias from managers who are asked to rate implementation of evidence-based practices (e.g., Adams et al., 1999; Lee & Cameron, 2009). However, other studies have found that the organizational readiness for change scales did not discriminate between responses of staff and supervisors, using aggregates in the final analysis (Saldana, Chapman, Henggeler, & Rowland, 2007). We attempted to reduce response bias by completing validity checks (using funding data, counselor reports, and printed materials at program sites) with 91% of the sample during site visits and excluded 10 programs that provided inconsistent data. Finally, findings regarding service delivery and client outcomes can be generalized only to the sampling frame: publicly funded OSAT programs serving communities with a population of 40% or more Latino or Black residents or both, or approximately 7.7 million residents in L.A. County, California. However, this study provides a preliminary understanding of program capacity issues related to client outcomes in a large, urban, and diverse region of the United States.
Conclusion
Health care reform seeks to improve access to health care and improve population health though meaningful engagement in care. Findings from the current study highlight the importance of using program capacity to understand system performance in terms of client-centered outcomes. Development of a payment system that accepts public insurance reimbursement in programs located in low-income and minority communities is a critical step to improve access to OSAT. In addition, improving leadership and readiness for change in the current change environment (e.g., Aarons, Ehrhart, et al., 2014) are essential components of building capacity to eliminate disparities in access to and engagement in care. Future research should examine how these components of program capacity are affected by changes in public insurance coverage and billing and how they ultimately influence outcomes that may contribute to health equities.
Contributor Information
Erick G. Guerrero, Email: erickgue@usc.edu.
William A. Vega, Email: williaav@usc.edu.
References
- Aarons GA. Transformational and transactional leadership: Association with attitudes toward evidence-based practice. Psychiatric Services. 2006;57:1162–1169. doi: 10.1176/appi.ps.57.8.1162. [DOI] [PMC free article] [PubMed] [Google Scholar]
- Aarons GA, Ehrhart MG, Farahnak LR, Sklar M. Aligning leadership across systems and organizations to develop a strategic climate for evidence-based practice implementation. Annual Review of Public Health. 2014;35:255–274. doi: 10.1146/annurev-publhealth-032013-182447. [DOI] [PMC free article] [PubMed] [Google Scholar]
- Aarons GA, Farahnak LR, Ehrhart MG. Leadership and strategic organizational climate to support evidence-based practice implementation. In: Beidas RS, Kendall PC, editors. Dissemination and implementation of evidence-based practices in child and adolescent mental health. New York, NY: Oxford University Press; 2014. pp. 82–97. [Google Scholar]
- Adams AS, Soumerai SB, Lomas J, Ross-Degnan D. Evidence of self-report bias in assessing adherence to guidelines. International Journal for Quality in Health Care. 1999;11:187–192. doi: 10.1093/intqhc/11.3.187. [DOI] [PubMed] [Google Scholar]
- Alegría M, Page JB, Hansen H, Cauce AM, Robles R, Blanco C, Berry P. Improving drug treatment services for Hispanics: Research gaps and scientific opportunities. Drug and Alcohol Dependence. 2006;84:S76–S84. doi: 10.1016/j.drugalcdep.2006.05.009. [DOI] [PubMed] [Google Scholar]
- Amaro H, Arévalo S, Gonzalez G, Szapocznik J, Iguchi MY. Needs and scientific opportunities for research on substance abuse treatment among Hispanic adults. Drug and Alcohol Dependence. 2006;84:S64–S75. doi: 10.1016/j.drugalcdep.2006.05.008. [DOI] [PubMed] [Google Scholar]
- Andrulis DP, Siddiqui NJ, Purtle JP, Duchon L. Patient Protection and Affordable Care Act of 2010: Advancing health equity for racially and ethnically diverse populations. Washington, DC: Joint Center for Political and Economic Studies; 2010. [Google Scholar]
- Appel PW, Ellison AA, Jansky HK, Oldak R. Barriers to enrollment in drug abuse treatment and suggestions for reducing them: Opinions of drug injecting street outreach clients and other system stakeholders. American Journal of Drug and Alcohol Abuse. 2004;30:129–153. doi: 10.1081/ADA-120029870. [DOI] [PubMed] [Google Scholar]
- Avolio BJ, Bass BM, Jung DI. Re-examining the components of transformational and transactional leadership using the Multifactor Leadership Questionnaire. Journal of Occupational and Organizational Psychology. 1999;72:441–462. doi: 10.1348/096317999166789. [DOI] [Google Scholar]
- Blakely TA, Woodward AJ. Ecological effects in multi-level studies. Journal of Epidemiology & Community Health. 2000;54:367–374. doi: 10.1136/jech.54.5.367. [DOI] [PMC free article] [PubMed] [Google Scholar]
- Blue Ribbon Task Force on NIDA Health Services Research. Report of the Blue Ribbon Task Force on Health Services Research at the National Institute on Drug Abuse. Bethesda, MD: National Institute on Drug Abuse; 2010. [Google Scholar]
- Broome KM, Flynn PM, Knight DK, Simpson DD. Program structure, staff perceptions, and client engagement in treatment. Journal of Substance Abuse Treatment. 2007;33:149–158. doi: 10.1016/j.jsat.2006.12.030. [DOI] [PMC free article] [PubMed] [Google Scholar]
- California Health Interview Survey. Eligible Medi-Cal population data. 2009 Retrieved from http://www.chis.ucla.edu/main/
- Cameron AC, Trivedi PK. Microeconometrics using Stata. College Station, TX: Stata Press; 2009. [Google Scholar]
- Campbell CI, Alexander JA. Culturally competent treatment practices and ancillary service use in outpatient substance abuse treatment. Journal of Substance Abuse Treatment. 2002;22:109–119. doi: 10.1016/S0740-5472(02)00221-0. [DOI] [PubMed] [Google Scholar]
- Chalk M. Healthcare reform and treatment: Changes in organization, financing, and standards of care. Presentation at the quarterly meeting of the County Alcohol and Drug Program Administrators Association of California; Sacramento, CA. 2010. [Google Scholar]
- Claus RE, Kindleberger LR. Engaging substance abusers after centralized assessment: Predictors of treatment entry and dropout. Journal of Psychoactive Drugs. 2002;34:25–31. doi: 10.1080/02791072.2002.10399933. [DOI] [PubMed] [Google Scholar]
- Courtney KO, Joe GW, Rowan-Szal GA, Simpson DD. Using organizational assessment as a tool for program change. Journal of Substance Abuse Treatment. 2007;33:131–137. doi: 10.1016/j.jsat.2006.12.024. [DOI] [PMC free article] [PubMed] [Google Scholar]
- D’Aunno TA. The role of organization and management in substance abuse treatment: Review and roadmap. Journal of Substance Abuse Treatment. 2006;31:221–233. doi: 10.1016/j.jsat.2006.06.016. [DOI] [PubMed] [Google Scholar]
- DiMaggio PJ, Powell WW. The iron cage revisited: Institutional isomorphism and collective rationality in organizational fields. American Sociological Review. 1983;48:147–160. doi: 10.2307/2095101. [DOI] [Google Scholar]
- Edwards JR, Knight DK, Broome KM, Flynn PM. The development and validation of a transformational leadership survey for substance use treatment programs. Substance Use & Misuse. 2010;45:1279–1302. doi: 10.3109/10826081003682834. [DOI] [PMC free article] [PubMed] [Google Scholar]
- Evans E, Li L, Hser YI. Client and program factors associated with dropout from court mandated drug treatment. Evaluation and Program Planning. 2009;32:204–212. doi: 10.1016/j.evalprogplan.2008.12.003. [DOI] [PMC free article] [PubMed] [Google Scholar]
- Farabee D, Leukefeld CG, Hays L. Accessing drug-abuse treatment: Perceptions of out-of-treatment injectors. Journal of Drug Issues. 1998;28:381–394. [Google Scholar]
- Fixsen DL, Naoom SF, Blase KA, Friedman RM, Wallace F. FMHI Publication No 231. Tampa, FL: University of South Florida, Louis de la Parte Florida Mental Health Institute, National Implementation Research Network; 2005. Implementation research: A synthesis of the literature. [Google Scholar]
- Friedmann PD, Lemon SC, Stein MD, D’Aunno TA. Accessibility of addiction treatment: Results from a national survey of outpatient substance abuse treatment organizations. Health Services Research. 2003;38:887–903. doi: 10.1111/1475-6773.00151. [DOI] [PMC free article] [PubMed] [Google Scholar]
- Garner BR, Hunter BD, Godley SH, Godley MD. Training and retaining staff to competently deliver an evidence-based practice: The role of staff attributes and perceptions of organizational functioning. Journal of Substance Abuse Treatment. 2012;42:191–200. doi: 10.1016/j.jsat.2011.10.016. [DOI] [PMC free article] [PubMed] [Google Scholar]
- Garnick DW, Lee MT, Horgan CM, Acevedo A. Adapting Washington Circle performance measures for public sector substance abuse treatment systems. Journal of Substance Abuse Treatment. 2009;36:265–277. doi: 10.1016/j.jsat.2008.06.008. [DOI] [PMC free article] [PubMed] [Google Scholar]
- Gotham HJ, Claus RE, Selig K, Homer AL. Increasing program capability to provide treatment for co-occurring substance use and mental disorders: Organizational characteristics. Journal of Substance Abuse Treatment. 2010;38:160–169. doi: 10.1016/j.jsat.2009.07.005. [DOI] [PubMed] [Google Scholar]
- Greener JM, Joe GW, Simpson DD, Rowan-Szal GA, Lehman WEK. Influence of organizational functioning on client engagement in treatment. Journal of Substance Abuse Treatment. 2007;33:139–147. doi: 10.1016/j.jsat.2006.12.025. [DOI] [PMC free article] [PubMed] [Google Scholar]
- Greenfield SF, Brooks AJ, Gordon SM, Green CA, Kropp F, McHugh RK, Miele GM. Substance abuse treatment entry, retention, and outcome in women: A review of the literature. Drug and Alcohol Dependence. 2007;86:1–21. doi: 10.1016/j.drugalcdep.2006.05.012. [DOI] [PMC free article] [PubMed] [Google Scholar]
- Grella CE, Joshi V. Gender differences in drug treatment careers among clients in the National Drug Abuse Treatment Outcome Study. American Journal of Drug and Alcohol Abuse. 1999;25:385–406. doi: 10.1081/ADA-100101868. [DOI] [PubMed] [Google Scholar]
- Guerrero EG. Managerial capacity and adoption of culturally competent practices in outpatient substance abuse treatment organizations. Journal of Substance Abuse Treatment. 2010;39:329–339. doi: 10.1016/j.jsat.2010.07.004. [DOI] [PMC free article] [PubMed] [Google Scholar]
- Guerrero EG. Enhancing access and duration in substance abuse treatment: The role of Medicaid payment acceptance and cultural competence. Drug and Alcohol Dependence. 2013;132:555–561. doi: 10.1016/j.drugalcdep.2013.04.005. [DOI] [PubMed] [Google Scholar]
- Guerrero EG, Aarons GA, Palinkas LA. Organizational capacity for service integration in community-based addiction health services. American Journal of Public Health. 2014;104:e40–e47. doi: 10.2105/AJPH.2013.301842. [DOI] [PMC free article] [PubMed] [Google Scholar]
- Guerrero EG, Andrews CM. Cultural competence in outpatient substance abuse treatment: Measurement and relationship to wait time and duration. Drug and Alcohol Dependence. 2011;119:e13–e22. doi: 10.1016/j.drugalcdep.2011.05.020. [DOI] [PMC free article] [PubMed] [Google Scholar]
- Guerrero EG, Campos M, Urada D, Yang JC. Do cultural and linguistic competence matter in Latinos’ completion of mandated substance abuse treatment? Substance Abuse Treatment, Prevention, and Policy. 2012;7:34. doi: 10.1186/1747-597X-7-34. [DOI] [PMC free article] [PubMed] [Google Scholar]
- Guerrero EG, Cepeda A, Duan L, Kim T. Disparities in completion of substance abuse treatment among Latino subgroups in Los Angeles County, CA. Addictive Behaviors. 2012;37:1162–1166. doi: 10.1016/j.addbeh.2012.05.006. [DOI] [PubMed] [Google Scholar]
- Guerrero EG, Marsh JC, Duan L, Oh C, Perron B, Lee B. Disparities in completion of substance abuse treatment between and within racial and ethnic groups. Health Services Research. 2013;48:1450–1467. doi: 10.1111/1475-6773.12031. [DOI] [PMC free article] [PubMed] [Google Scholar]
- Jarvis D. Paying for integrated services: FQHC, Medi-Cal and other funding strategies. 2010 [Webinar]. Retrieved from California Institute for Mental Health website: http://www.cimh.org/LinkClick.aspx?fileticket=ld56CkUu_VY%3D&tabid=804.
- Kaynak H. The relationship between total quality management practices and their effects on firm performance. Journal of Operations Management. 2003;21:405–435. doi: 10.1016/S0272-6963(03)00004-4. [DOI] [Google Scholar]
- Knudsen HK, Ducharme LJ, Roman PM. Early adoption of buprenorphine in substance abuse treatment centers: Data from the private and public sectors. Journal of Substance Abuse Treatment. 2006;30:363–373. doi: 10.1016/j.jsat.2006.03.013. [DOI] [PubMed] [Google Scholar]
- Lazarsfeld PF, Henry NW. Latent structure analysis. Boston, MA: Houghton Mifflin; 1968. [Google Scholar]
- Lee N, Cameron J. Difference in self and independent ratings on an organisational dual diagnosis capacity measure. Drug and Alcohol Review. 2009;28:682–684. doi: 10.1111/j.1465-3362.2009.00116.x. [DOI] [PubMed] [Google Scholar]
- Lehman WEK, Greener JM, Simpson DD. Assessing organizational readiness for change. Journal of Substance Abuse Treatment. 2002;22:197–209. doi: 10.1016/S0740-5472(02)00233-7. [DOI] [PubMed] [Google Scholar]
- Lozeau D, Langley A, Denis JL. The corruption of managerial techniques by organizations. Human Relations. 2002;55:537–564. doi: 10.1177/0018726702055005427. [DOI] [Google Scholar]
- Lundgren L, Amodeo M, Krull I, Chassler D, Weidenfeld R, de Saxe Zerden L, Beltrame C. Addiction treatment provider attitudes on staff capacity and evidence-based clinical training: Results from a national study. American Journal on Addictions. 2011;20:271–284. doi: 10.1111/j.1521-0391.2011.00127.x. [DOI] [PubMed] [Google Scholar]
- Marsh JC, Cao D, Guerrero EG, Shin HC. Need-service matching in substance abuse treatment: Racial/ethnic differences. Evaluation and Program Planning. 2009;32:43–51. doi: 10.1016/j.evalprogplan.2008.09.003. [DOI] [PMC free article] [PubMed] [Google Scholar]
- Mason JL. Cultural Competence Self-Assessment Questionnaire: A manual for users. Portland, OR: Portland State University, Research and Training Center on Family Support and Children’s Mental Health; 1995. Retrieved from http://www.racialequitytools.org/resourcefiles/mason.pdf. [Google Scholar]
- McCarty D, Gustafson DH, Wisdom JP, Ford F, Choi D, Molfenter T, Cotter F. The Network for the Improvement of Addiction Treatment (NIATx): Enhancing access and duration. Drug and Alcohol Dependence. 2007;88:138–145. doi: 10.1016/j.drugalcdep.2006.10.009. [DOI] [PMC free article] [PubMed] [Google Scholar]
- McConnell KJ, Hoffman KA, Quanbeck A, McCarty D. Management practices in substance abuse treatment programs. Journal of Substance Abuse Treatment. 2009;37:79–89. doi: 10.1016/j.jsat.2008.11.002. [DOI] [PMC free article] [PubMed] [Google Scholar]
- McLellan AT, Carise D, Kleber HD. Can the national addiction treatment infrastructure support the public’s demand for quality care? Journal of Substance Abuse Treatment. 2003;25:117–121. doi: 10.1016/S0740-5472(03)00156-9. [DOI] [PubMed] [Google Scholar]
- Meyer JW, Rowan B. Institutionalized organizations: Formal structure as myth and ceremony. American Journal of Sociology. 1977;83:340–352. doi: 10.1086/226550. [DOI] [Google Scholar]
- Muthén BO. Latent variable mixture modeling. In: Marcoulides GA, Schumacker RE, editors. New developments and techniques in structural equation modeling. Mahwah, NJ: Lawrence Erlbaum; 2001. pp. 1–33. [Google Scholar]
- NIATx. Health reform readiness index. 2011 Retrieved from http://www.niatx.net/hrri/Instructions.aspx.
- Oliver C. Strategic responses to institutional processes. Academy of Management Review. 1991;16:145–179. doi: 10.5465/AMR.1991.4279002. [DOI] [Google Scholar]
- Peyrot M. Institutional and organizational dynamics in community-based drug abuse treatment. Social Problems. 1991;38:20–33. doi: 10.1525/sp.1991.38.1.03a00020. [DOI] [Google Scholar]
- Pfeffer J, Salancik GR. The external control of organizations. New York, NY: Harper & Row; 1978. [Google Scholar]
- Rawson R, McLellan T. Health reform and treatment changes in organization, financing, and standards of care. Presentation at Los Angeles County Public Health Department; Los Angeles, CA. 2010. [Google Scholar]
- Roman PM, Abraham AJ, Knudsen HK. Using medication-assisted treatment for substance use disorders: Evidence of barriers and facilitators of implementation. Addictive Behaviors. 2011;36:584–589. doi: 10.1016/j.addbeh.2011.01.032. [DOI] [PMC free article] [PubMed] [Google Scholar]
- Rubin DB. Multiple imputation for non-response in surveys. New York, NY: John Wiley & Sons; 1987. [Google Scholar]
- Saldana L, Chapman JE, Henggeler SW, Rowland MD. The Organizational Readiness for Change scale in adolescent programs: Criterion validity. Journal of Substance Abuse Treatment. 2007;33:159–169. doi: 10.1016/j.jsat.2006.12.029. [DOI] [PMC free article] [PubMed] [Google Scholar]
- Schaefer JL. Analysis of incomplete multivariate data. New York, NY: Chapman and Hall; 1997. [Google Scholar]
- Schein EH. Organizational culture and leadership. 4. San Francisco, CA: Jossey-Bass; 2010. [Google Scholar]
- Shortell SM, Rundall TG, Hsu J. Improving patient care by linking evidence-based medicine and evidence-based management. Journal of the American Medical Association. 2007;298:673–676. doi: 10.1001/jama.298.6.673. [DOI] [PubMed] [Google Scholar]
- Simpson DD. A conceptual framework for drug treatment process and outcomes. Journal of Substance Abuse Treatment. 2004;27:99–121. doi: 10.1016/j.jsat.2004.06.001. [DOI] [PubMed] [Google Scholar]
- Simpson DD, Flynn PM. Moving innovations into treatment: A stage-based approach to program change. Journal of Substance Abuse Treatment. 2007;33:111–120. doi: 10.1016/j.jsat.2006.12.023. [DOI] [PMC free article] [PubMed] [Google Scholar]
- Simpson DD, Joe GW, Brown BS. Treatment duration and follow-up outcomes in the Drug Abuse Treatment Outcome Study (DATOS) Psychology of Addictive Behaviors. 1997;11:294–307. doi: 10.1037/0893-164X.11.4.294. [DOI] [Google Scholar]
- Simpson DD, Joe GW, Rowan-Szal GA. Linking the elements of change: Program and client responses to innovation. Journal of Substance Abuse Treatment. 2007;33:201–209. doi: 10.1016/j.jsat.2006.12.022. [DOI] [PMC free article] [PubMed] [Google Scholar]
- Sloboda Z, Schildhaus S. A discussion of the concept of technology transfer of research-based drug “abuse” prevention and treatment interventions. Substance Use & Misuse. 2002;37:1079–1087. doi: 10.1081/JA-120004167. [DOI] [PubMed] [Google Scholar]
- Stata. Stata 12 help for nbreg. 2012 Retrieved from http://www.stata.com/help.cgi?nbreg.
- Tonigan JS. Project Match treatment participation and outcome by self-reported ethnicity. Alcoholism: Clinical & Experimental Research. 2003;27:1340–1344. doi: 10.1097/01.ALC.0000080673.83739.F3. [DOI] [PubMed] [Google Scholar]
- von Sydow K, Lieb R, Pfister H, Höfler M, Wittchen HU. What predicts incident use of cannabis and progression to abuse and dependence? A 4-year prospective examination of risk factors in a community sample of adolescents and young adults. Drug and Alcohol Dependence. 2002;68:49–64. doi: 10.1016/S0376-8716(02)00102-3. [DOI] [PubMed] [Google Scholar]
- Xiang L, Lee AH, Yau KKW, McLachlan GJ. A score test for overdispersion in zero-inflated Poisson mixed regression model. Statistics in Medicine. 2007;26:1608–1622. doi: 10.1002/sim.2616. [DOI] [PubMed] [Google Scholar]
- Zhang Z, Friedmann PD, Gerstein DR. Does duration matter? Treatment duration and improvement in drug use. Addiction. 2003;98:673–684. doi: 10.1046/j.1360-0443.2003.00354.x. [DOI] [PubMed] [Google Scholar]