

Abstract
Alcohol dependence is a heterogeneous psychiatric disorder characterized by high genetic heritability and neuroadaptations occurring from repeated drug exposure. Through an integrated systems approach we observed consistent differences in transcriptome organization within postmortem human brain tissue associated with the lifetime consumption of alcohol. Molecular networks, determined using high-throughput RNA sequencing, for drinking behavior were dominated by neurophysiological targets and signaling mechanisms of alcohol. The systematic structure of gene-sets demonstrates a novel alliance of multiple ion-channels, and related processes, underlying lifetime alcohol consumption. Coordinate expression of these transcripts was enriched for genome-wide association signals in alcohol dependence and a meta-analysis of alcohol self-administration in mice. Further dissection of genes within alcohol consumption networks revealed the potential interaction of alternatively spliced transcripts. For example, expression of a human-specific isoform of the voltage-gated sodium channel subunit SCN4B was significantly correlated to lifetime alcohol consumption. Overall, our work demonstrates novel convergent evidence for biological networks related to excessive alcohol consumption, which may prove fundamentally important in the development of pharmacotherapies for alcohol dependence.
Keywords: alcoholism, alcohol dependence, addiction, RNA-Seq, gene expression
INTRODUCTION
Dysregulation of neurocircuitry and brain structure through altered neurotransmitter systems, endogenous peptides, hormone systems, and neuroimmune processes has been implicated for alcohol and other drugs of abuse 1-3. These numerous biological events call attention to the need for large-scale analyses to uncover the diverse pathways and mechanisms that are most prominent in addiction. Responses to repeated environmental and chemical stimuli cause enduring central nervous system (CNS) adaptations through coordinate actions of gene expression 4. Identifying end-stage CNS expression differences associated with human alcohol consumption will be instrumental in translating fundamental laboratory findings into human health.
Human postmortem brain tissue is a valuable resource for determining the role of gene expression in neuropsychiatric diseases, and establishing a connection with experimental models 5. Whole-genome profiling, primarily using microarrays, has identified subtle alterations in gene expression within discrete brain regions related to alcohol dependence 6, 7. High-throughput sequencing technologies (RNA-Seq) offer novel insights into transcriptome complexity, including non-coding RNAs and alternatively spliced variants, across different tissues and disease states 8. RNA-Seq analysis of postmortem human hippocampus has identified differentially expressed genes, potentially related to neuronal adaptations underlying long-term cocaine and alcohol abuse 9. These changes within human hippocampus are consistent with differential GABAergic gene expression in a rodent model of alcohol dependence 10. Additionally, RNA-Seq has shown alcohol dependence may modify alternative splicing of candidate genes, such as GABBR1, within human brain 11. Continued examination of discrete brain regions through RNA-Seq will provide additional evidence of the transcriptional landscape for alcohol dependence and other psychiatric diseases.
Coordinate expression of genes form highly organized biological networks within specific regions of human brain, that are reproducible across individuals 12, 13. The homeostatic structure of molecular networks may be disrupted through genetic and environmental perturbations producing long-lasting interactions involved in complex traits 14. Integrating multiple components and layers of information within the framework of a biological network helps identify and prioritize individual transcripts, as well as sets of co-regulated transcripts associated with disease 15. Due to the long-standing cellular adaptations caused by substance dependence 16, 17, we hypothesize that alcohol dependence is shaped, at least in part, by persistent differences in coexpression systems collectively affecting the propensity for compulsive alcohol consumption. Through massive parallel sequencing of RNA transcripts from postmortem human prefrontal cortex (PFC), a prominent brain area involved in addiction 18, 19, our bioinformatics approach used transcriptional networks and genetic variation in conjunction with estimates of lifetime alcohol consumption to determine groups of coexpressed molecular elements associated with alcohol dependence. Our analysis provides convergent systems-level evidence of genetic networks within PFC that contribute to the pathophysiology of alcohol drinking behavior in humans.
MATERIALS AND METHODS
Case selection and postmortem tissue collection
Human autopsy brain samples were obtained from the New South Wales Tissue Resource Centre at the University of Sydney. Fresh frozen samples of the superior frontal gyrus (Brodmann area 8; further referred to as prefrontal cortex (PFC) in this manuscript) were collected from each postmortem sample. Brain tissue was sectioned at 3 mm intervals in the coronal plane. Alcohol Dependent diagnoses were confirmed by physician interviews, review of hospital medical records, questionnaires to next-of-kin, and from pathology, radiology, and neuropsychology reports. Tissue samples were matched as closely as possible according to age, sex, post-mortem interval, pH of tissue, disease classification, and cause of death. To be included as part of the alcohol-dependent cohort subjects had to meet the following criteria: greater than 18 years of age, no head injury at time of death, lack of developmental disorder, no recent cerebral stroke, no history of other psychiatric or neurological disorders, suitable prolonged agonal state, no history of intraveneous or polydrug abuse, negative screen for AIDS and Hepatitis B/C, post-mortem interval within 48 hours, and diagnosis of alcohol abuse disorder meets the DSM-IV criteria.
Sample preparation and read counting
Total RNA from postmortem human prefrontal cortex was extracted from frozen tissue, excluding any samples with contaminated or degraded quality (RNA integrity numbers less than 5.0). Ribosomal RNA was depleted using RiboMinus Eukaryote kit for RNA-Seq and confirmed using an Agilent Bioanalyzer. Samples were processed using ABI whole transcriptome library preparation kit and sequenced on the ABI SOLiD 4 system using paired-end reads (35+50 bp). Collected reads were processed by the Texas Advanced Computing Center and mapped for sequence reads, allowing two mismatches per 25 bp seed length, against the human reference genome (hg19), to select unique alignments with the highest reproducible mapping. Read counts were generated using the Partek Genomics Suite software (a minimum of five reads/alignment was used to determine values). Abundance was calculated for full-length gene isoforms with an expectation-maximization algorithm 20. Detection of differential expression based on the negative binomial distribution for modeled read counts, and normalization using a regularized log2 transformation 21, was conducted within the R project for statistical computing. Expression data encompassed all sequencing reads that were unambiguously mapped to a single gene within an individual sample.
Bioinformatics analyses
Scale-free coexpression networks were constructed using the weighted gene coexpression network analysis (WGCNA) package in R 22. WGCNA provides a global perspective, emphasizing the interconnectedness between genes to classify different molecular groupings, rather than focusing on individual genes. Alterations in the molecular networks are due to environmental and genetic variation affecting mechanisms of regulation. The molecular groups in WGCNA are defined as modules formed by densely interconnected genes, and alternatively spliced isoforms, which were discerned using a dynamic tree-cutting algorithm based on hierarchical clustering (minimum module size=100, cutting height=0.99, deepSplit=TRUE) 23. Corresponding transcripts were assigned to unique numeric and color identifiers based on the level of read summarization, emphasizing the strongest pairwise relationships in expression across samples. Module preservation, and reproducibility, for alcoholic and matched control subjects was evaluated according to a Z-summary statistic with permutation 24. Assigned modules were functionally annotated against known ontological categories, and additional features such as predicted drug interactions, using standard biological enrichment tools 25, 26. Representative gene ontology plots were visualized using semantic dimension scatter plots to reduce redundancy in terms of the identified biological groups. The coordinates of x- and y-axes are assigned using multidimensional scaling of similarities in ontological terms among identified groups. Overall results for functional enrichment of gene modules related to lifetime consumption can be found in supplementary materials (Table S2). Cell-type overrepresentation analysis was restricted to genes having ≥ 10-fold enrichment in neurons, astrocytes, or oligodendrocytes 27, permitting a rigorous assessment of gene clusters within the three main CNS cell-types. Unless indicated otherwise, statistical significance of intersecting gene-sets was evaluated using the Fisher’s exact test. Visualizations were rendered using cytoscape for biomolecular connections 28 and available R packages.
Representative gene modules were examined for group-wise overrepresentation of genetic variants within the database of genotypes and phenotypes (dbGaP) 29 for the public results of two alcohol dependent studies and three non-psychiatric diseases as negative controls: Collaborative Study on the Genetics of Alcoholism (phs000125.v1.p1), Study of Addiction: Genetics and Environment (phs000092.v1.p1), National Eye Institute Age-Related Eye Disease Study for age-related macular degeneration and cataracts (phs000001.v3.p1), NIDDK IBD Genetics Consortium Crohn’s Disease (phs000130.v1.p1), and Type 1 Diabetes Genetics Consortium (phs000180.v2.p2). Individual datasets were extracted from dbGaP, filtered for genetic variants with P-values ≤ 0.01, and annotated for associated gene identifiers 30.
RESULTS
RNA-Seq Assessment of Gene Coexpression Networks in PFC
Paired-end sequencing (50/35 bps) fragments from ribosome-depleted RNA, spanning an average of ~35 million alignments per sample, were collected from the prefrontal cortex (PFC) of 16 alcoholics and 15 matched controls. Following filtering of raw reads for sequencing quality, RNA expression was detected using the RefSeq database 31 for 17,608 gene models, 29,607 alternatively spliced transcript models, and 196,453 exons. Alcohol dependent individuals varied in the duration and lifetime amount of alcohol consumed (Fig. S1); ranging from 20,857 to 325,893 standard drinks throughout the lifetime duration of alcohol dependent consumption. Alcohol dependent subjects did not significantly differ from control subjects in age, post-mortem interval (PMI), brain pH level, brain weight, RNA quality (RIN), or number of sequence alignments (Fig. S2).
Gene-level expression data for controls and alcoholics were assigned separately into organized clusters sharing highly similar expression patters (i.e. modules) using a signed weighted gene coexpression network analysis (WGCNA) 32. The modular organization of coexpression systems is suggested as an important underlying aspect of cellular function and in the pathogenesis of disease 33, 34. Coexpression analysis was applied separately for controls and alcoholics to contrast network structure between disease cohorts, and designate those PFC modules most related to excessive alcohol consumption within dependent individuals. Depicting expression data in the form of modules condenses a large number of expression characteristics into manageable units in order to clarify and prioritize systems within the human brain 35-37, as well as define representative expression profiles that can be associated with specific traits. Our analysis identified 32 and 38 gene expression modules for controls and alcoholics. RNA-Seq defined modules were significantly conserved in relation to previous network-based studies from human cortex (Table S1), forming distinctive functional categories that demonstrate consistency of networks with previous human brain studies. Alcoholic modules were further over-represented for a similar network analysis on alcohol dependence using microarray data (Fig. S3) 6; however, more modules were discerned in our current investigation, which may be attributed to the precision, larger dynamic range, and improved network characteristics involving RNA-Seq 38. The normalized read counts could also be further summarized for transcript-level and exon-level information (Fig. 1), providing an overall perspective of the transcriptome network structure. Neither controls or alcoholics showed any substantial clustering bias for brain weight, pH, PMI, RIN, age, or smoking (Fig. S4). To determine global differences in transcriptome architecture, we compared mean ranked expression and connectivity patterns between controls and alcoholics. Expression across all three levels, gene-, transcript-, and exon-level, was strongly correlated between controls and alcoholics (Fig. 1a). In contrast the global connectivity, a measure of interrelationship among all the features within a biological network, demonstrated progressively weaker correlation (Fig. 1a). The discrepancy between strong overall expression and weaker connectivity suggests the neurobiology of alcohol dependence in PFC is due to altered co-variation of transcribed molecular features rather than discrete differential expression across the transcriptome. Average global connectivity per feature was significantly reduced in alcoholics (Fig. 1b), reflecting consistent homeostatic dysregulation for biological processes within alcohol-dependent PFC.
Figure 1. Global comparison of prefrontal cortex (PFC) transcriptome architecture in alcoholic and matched controls.
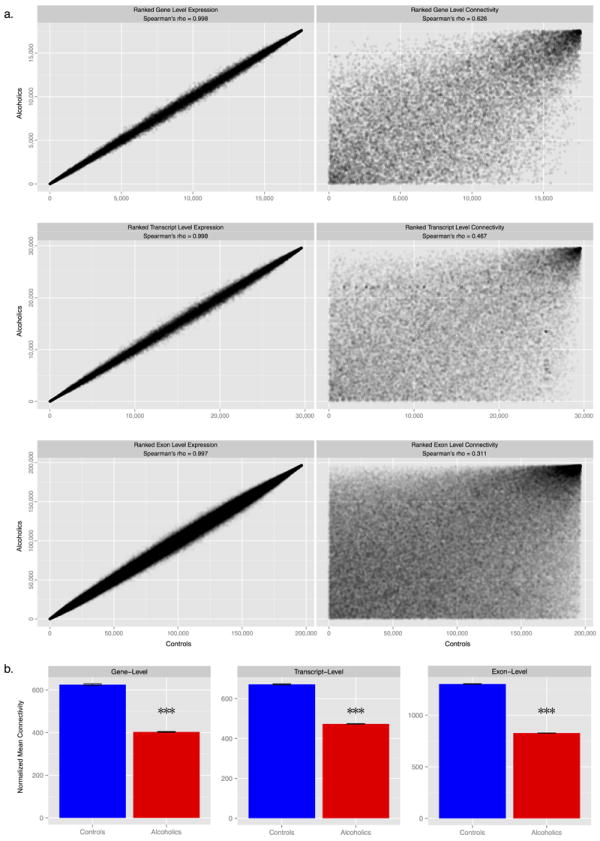
(a) Scatter plots of ranked expression (left) and connectivity (right) in alcoholics (n=16) and matched controls (n=15). The scatter plots demonstrate that overall transcriptome features are robustly correlated for overall expression for alcoholics (y-axis) and controls (x-axis), regardless of expression for genes, alternatively spliced transcripts, or individual exons; however, disease is related to increasingly disparate patterns in overall connectivity across genes, alternatively spliced transcripts, and individual exons. (b) Average connectivity of coding features is significantly reduced in alcoholic PFC compared to controls, showing diminished homeostatic interconnection among genes (left), transcripts (middle), and exons (right). Bar plots show the mean ± se, with asterisks (***) denoting a significant difference between controls and alcoholics at P < 1e-16.
In order to further refine gene modules (GM) in the context of alcohol dependence, GM network structure was correlated with phenotypic variation for lifetime consumption of alcohol across individual subjects. Establishing correspondence with a particular phenotypic trait (i.e., alcohol consumption), rather than a clinical diagnosis alone, is biologically relevant to substance abuse and experimentally tractable in future studies. Correlation with lifetime alcohol consumption ranged from |r = 0.01 to r = 0.73|, with ten individual GMs being in the upper and lower quartiles of the distribution (Fig. 2a). The first principal component of GM expression within the upper quartile on average accounted for 18.9% of the variance for lifetime consumption versus 1.5% for the lower quartile, a 12.6 fold-difference between the GM groups. Intermodular correlation is significantly higher among the upper quartile GMs associated with alcohol drinking compared to GMs residing in the lower quartile (t(88)=4.56, P = 1.65 e-05) (Fig. 2b). This correlation structure implies coherent biological function for a set of modules, comprising 2,330 genes in PFC, directly related to alcohol drinking behavior in humans. GMs within the upper quartile form two distinct groups (Group1: GM31, GM15, GM25, GM20 and Group2: GM19, GM30, GM33, GM28, GM13, GM37s), whereas GMs within the lower quartile share almost no pronounced inter-relationship. Interestingly, there was a significant difference for the average connectivity of genes residing in the upper versus the lower quartile and disease state (Fig. 2c). The interconnectedness of genes belonging to GMs weakly tied to alcohol consumption (i.e. lower quartile) followed a similar pattern to global differences in transcriptome organization between control and alcoholic PFC (Fig. 1b), while those within GMs linked with alcohol consumption (i.e. upper quartile) showed the reverse, with higher average gene connectivity in alcoholics compared to matched controls (F(1,14964)=111.5, P < 1e-16). This suggests a subtle restructuring of the transcriptome in alcoholic PFC favoring GMs associated with an individual’s lifelong pattern of alcohol intake. Due to the unique composition of gene networks associated with lifetime consumption of alcohol, gene coexpression in the upper quartile is less preserved in controls than remaining groups (Fig. S5). Such a favorable arrangement of genes in the upper quartile could indicate an allostatic mechanism for repeated maladaptive alcohol consumption. Upper quartile GMs related to alcohol intake are mainly neuronal (Fig. 2d) and comprised of ontological categories for genes involving synaptic plasticity, ion channel function, transmembrane transporters, and intracellular signaling molecules (Fig. 2e, Table S2).
Figure 2. Analysis of gene coexpression modules for estimates of lifetime alcohol consumption.
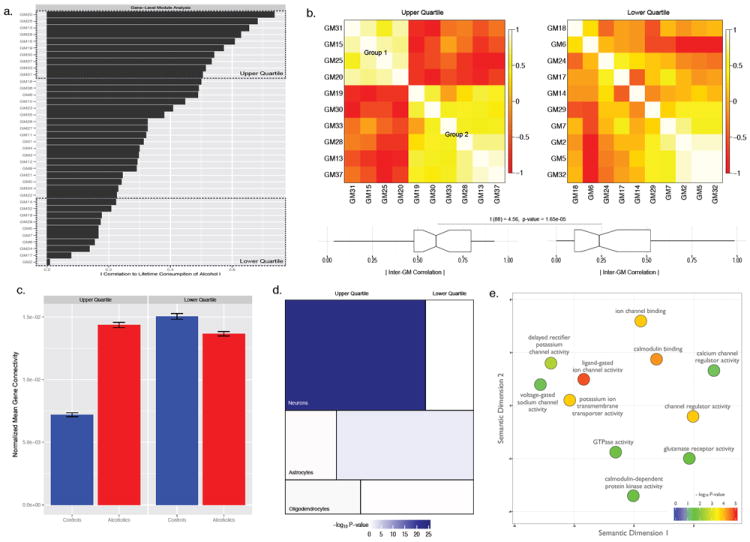
(a) Ranking of alcoholic gene coexpression networks in relation to a specific phenotypic trait, the degree of lifetime alcohol drinking; dividing modules into larger cohorts which are most (Upper Quartile) and least (Lower Quartile) associated with human alcohol consumption. (b) Ranked inter-correlation of modules in the upper quartile (left) and lower quartile (right) of alcohol consumption. Heatmaps demonstrate modules within the lower quartile are largely unorganized whereas those in the upper quartile form two distinct factions. Mean absolute correlation among the two categories are significantly different t(88)=4.56, P = 1.65 e-05. (c) Average connectivity of matched gene coexpression patterns within the upper and lower quartiles for controls (blue) and alcoholics (red), showing the lifetime amount of alcohol consumed influences transcriptome architecture F(1,14964)=111.5, P < 1.0 e-16 leading to higher average connectivity patterns associated with disease (Bar plots show the mean ± se). (d) Mosaic plot of the three major cell types in mammalian brain (Neurons: top, Astrocytes: middle, Oligodendrocytes: bottom) with ten-fold enrichment for the upper (left) and lower (right) quartiles; size of boxes reflects the number of overlapping genes. The upper quartile cohort is significantly enriched for neuronal classified genes (P = 4.66 e-23, Fisher’s exact test). (e) Scatter plot of relevant over-represented gene ontology categories, plotted based on semantic similarity and scaled according to −log10 P-values for the upper quartile (complete gene ontology results provided in Table S2; see methods for additional details).
Gene Modules Associated with Lifetime Consumption of Alcohol
A number of isolated model system approaches have implicated ion channels 39 and signaling networks 40 in the neurobiology of alcohol; however, such studies may overlook small responses or fail to capture widespread heterogeneous molecular effects in humans 41. Our results demonstrate a markedly orchestrated network of these genes in human PFC related to the degree of lifetime alcohol consumption, providing a framework for deciphering multiple genes in the context of a specific phenotypic trait of alcohol dependence. Molecular function for these networks spans multiple dimensions, but tie together several relevant biological processes of alcohol exposure. Glutamate receptor activity (P = 3.86 e-05), a known system underlying the PFC circuitry of compulsive behavior in addiction 42 and a direct pharmacological target of alcohol 43, is just one of several functional categories enriched within GMs associated with lifetime alcohol consumption.
Group1 of the upper quartile was the least variable contingent of modules, with the greatest inter-module correlation among 1030 genes (Fig. S6), promoting the observed differences in disease status and excessive alcohol consumption. Functional enrichment of elements contained within Group1 largely accounted for gene ontologies corresponding to lifetime alcohol consumption within the upper quartile (Fig. 2e). This set of transcripts within Group1 are preserved for neuronal protein-protein coexpression (P = 1.19 e-36) 44, suggesting the GMs may extend beyond co-regulated RNA transcripts. Additionally, this network substructure is further over-represented for a meta-analysis of alcohol drinking behavior in mice (P = 4.59 e-08) 45, providing independent evidence for a cohesive group of genes involved in alcohol consumption. Despite the fact our analysis has focused on molecular networks for lifetime alcohol consumption, a portion of these jointly expressed genes may be indirectly regulated by common substrates and closely associated endophenotypes governing the pathophysiology of alcohol dependence. MicroRNA miR-9, a post-transcriptional regulator of splice variation and neuroadaptations of alcohol tolerance (a hallmark of escalated alcohol drinking), targets a notable share of genes within Group1 (P = 9.17 e-04). Noteworthy targets of miR-9 include the BK potassium channel KCNMA1 and GAD1, components of neuronal excitability and alcohol behavioral phenotypes 46-48. These results further highlight the utility of the network-based approach to concurrently identify multiple disease relevant genes, an important tool given the multifaceted nature of alcohol use and other psychiatric disorders.
Leveraging network properties for the pairwise relationship among genes allows for the identification of functionally relevant candidates in neuroplasticity and disease 49, 50. Although modules within Group1 share similar expression patterns, the individual gene sets may also contribute to differing states of disease progression. We hypothesized that identifying genes within central positions (i.e., hub genes) of the alcohol-perturbed modules would distinguish major, yet underappreciated, participants in the neurobiology of human alcohol consumption. GM15, GM20, GM25, and GM31 were restricted to the top ten percent of connected genes, highlighting the primary contributors within the network that are associated with lifetime alcohol consumption (Fig. 3). Among the most central elements are glutamatergic and GABAergic receptors (GABRA3, GABBR1, GABBR2, GRIA1, and GRIN2B), two neurotransmitter systems widely recognized to affect alcohol-induced behaviors 51. In addition, a number of candidates within these networks represent novel determinants of alcohol dependence. Hub genes within these molecular networks conceivably act across species as 25/104 the core genes coincide with the aforementioned meta-analysis of alcohol drinking behavior in mice 45. Probing specific targets across species may highlight unknown pathways in human brain relevant for alcohol use disorders. PAK1 is one concurrent example, acting as a regulator of dendritic spine formation and remodeling, 52, 53 and may be important in cortical development and neuroadaptations underlying addiction 54.
Figure 3. Network diagrams for Group1 gene coexpression modules associated with lifetime alcohol consumption.
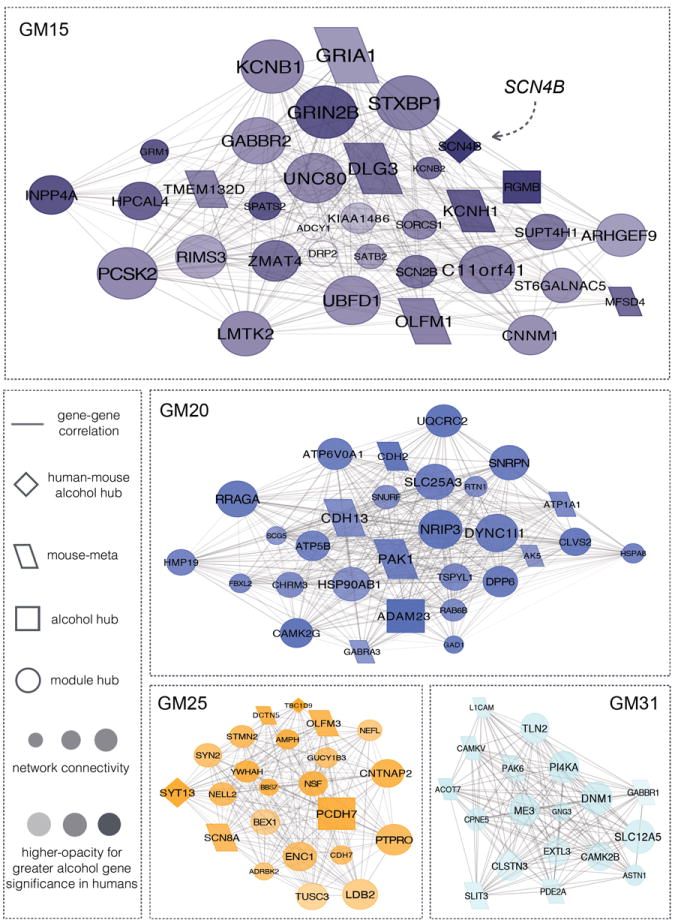
Visualization demonstrates the inter-connection of genes for the top ten percent of module members with ≥ |r = 0.80| correlation strength. Relative size of the depicted networks is based upon the size of the four modules. Size of the nodes reflects the module connectivity ranking for individual genes. The degree of node opacity is proportional to the correlation with lifetime consumption, with alcohol hubs defined as those genes within the top ten percent of alcohol-associated genes in our human sample. Networks were further overlapped using a prior meta-analysis of alcohol drinking behavior in mice45 to identify potential points of convergent validity in rodent models.
Potential role of SCN4B transcripts in lifetime human alcohol consumption
Concentrating on the top ten percent of genes, within Group1 of the upper quartile, related to lifetime alcohol consumption identified three high-confidence genes (SCN4B, SYT13, and TBC1D9) in common between mice and humans (Fig. 3). The voltage-gated sodium channel is a putative quantitative trait gene (QTG) for alcohol drinking behavior 45, 55. Serving as an auxiliary partner to sodium channel alpha subunits within neurons, SCN4B can override the effects of other beta subunits 56, modify sodium channel firing rates 57, and structurally alter neuronal projections 58. Currently there is only one recognized isoform of SCN4B in rodents; however, there are three coding isoforms of SCN4B in humans. Only the shortest coding variant (NM_001142349) is significantly correlated to alcohol consumption (Fig. 4). WGCNA of alternatively spliced transcripts closely mirrors pairwise gene expression profiles for biological function (Table S3, Fig. S7); NM_001142349 being an appreciable phenotypic focal point within the network that is distinct from the other two coding isoforms of SCN4B. Differentially spliced transcripts expressed alongside NM_001142349 included NM_014191 (SCN8A) (Fig. S7), a sodium channel alpha subunit expressed within cortical nodes of Ranvier, dendrites, and neuronal synapses 59. Positive coexpression of SCN8A and SCN4B isoforms, plus additional transcripts, within alcoholic PFC denotes a specific functional component influencing the neuronal circuitry of lifetime alcohol consumption.
Figure 4. Correlation of the quantitative trait gene candidate (QTG) SCN4B (voltage-gated sodium channel type IV beta subunit) isoforms.
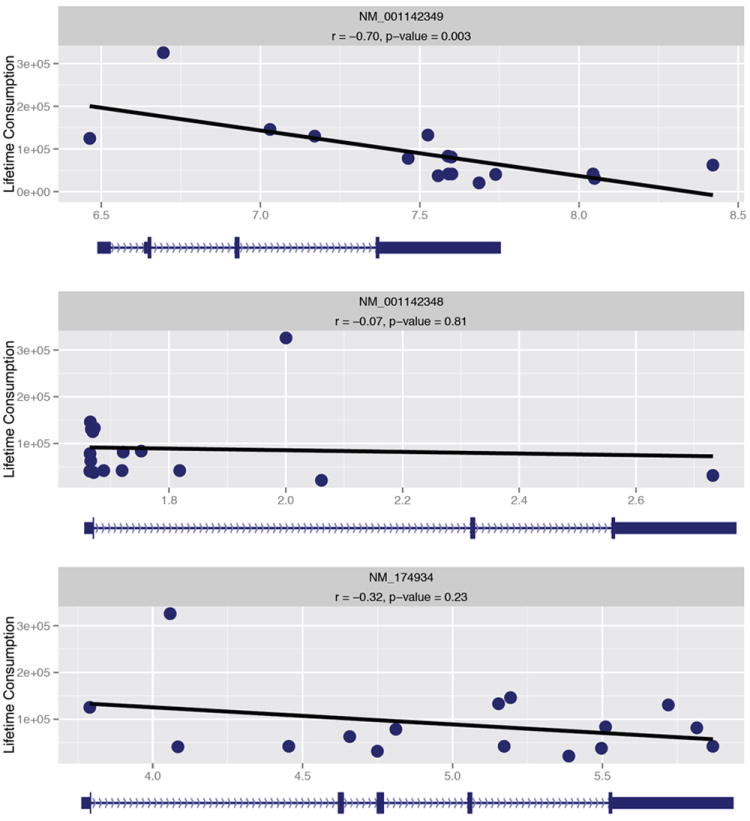
Scatter plots for three coding variants (NM_001142349, NM_001142348, and NM_174934) of SCN4B, demonstrating a significant negative correlation for only the shortest coding isoform (NM_001142349) for lifetime alcohol consumption in humans.
Convergent evidence from genome-wide association studies (GWAS)
Comparing the coexpression networks of alcoholics and non-alcoholics, in terms of lifetime consumption, we identified a coordinated set of multiple factors underlying synaptic dysregulation in disease. The identified groups of coexpression modules were further evaluated against genome wide association studies (GWAS) for alcohol dependence, the Collaborative Study on the Genetics of Alcoholism (COGA) and the Study of Addiction: Genetics and Environment (SAGE), to asses whether these gene sets were applicable to a larger cohort of afflicted individuals. Group1 of the GMs linked to lifetime consumption of alcohol was the only expression ensemble significantly enriched for genes containing single nucleotide polymorphisms (SNPs) associated with alcohol dependence (Fig. 5), suggesting genes within this cohort may have a decisive affect on the development of an alcohol use disorder. The coordinated network structure of alcohol drinking behavior for GMs in Group1 is set apart from generalized differential expression in disease status, emphasizing the network schema of a designated phenotype over non-specific changes in gene expression for alcoholism.
Figure 5. Over-representation for single nucleotide polymorphisms (SNPs) from genome-wide association studies (GWAS) related to alcohol dependence.
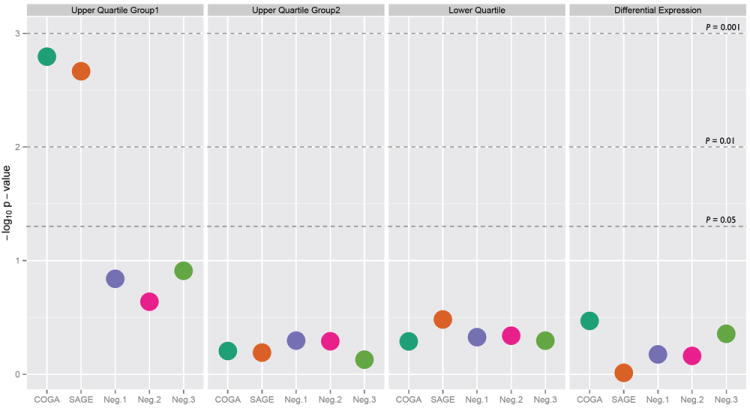
Enrichment of groups (left to right) upper quartile Group1, upper quartile Group2, lower quartile, and differentially expressed genes within two GWAS involving alcohol dependence (COGA – Collaborative Studies on Genetics of Alcoholism and SAGE – Study of Addiction: Genetics and Environment) and three non-psychiatric negative control datasets (Neg.1 – age related macular degeneration and age related cataracts, Neg.2 – Crohn’s disease, and Neg.3 – type 1 diabetes). The −log10 P-value is plotted along the y-axis, with dashed horizontal lines designating the cut-off level for over-representation at P = 0.05, 0.01, and 0.001. Only the aggregate of genes within Group1 of the upper quartile associated with lifetime alcohol consumption is significantly over-represented for SNPs underlying alcohol dependence.
DISCUSSION
Alcohol dependence, similar to other psychiatric diseases, manifests through the interaction of multiple genes and signaling pathways. Disrupting key genes within the network may affect a broad range of molecular mechanisms and modify downstream phenotypes. Through a systems-based approach of transcriptome-wide expression from human postmortem PFC, our analysis highlights comprehensive differences in sustained pairwise expression profiles related to an alcohol use disorder. The transcriptional landscape of alcoholic PFC formed a coordinate biological network associated with the lifetime consumption of alcohol. The internal structure of the network intertwined known and unknown targets related to the pathophysiology of alcohol drinking behavior, offering a comprehensive assessment for the widespread pharmacological actions of repeated alcohol exposure in human brain.
Diverse genetic and environmental effects influence patterns of alcohol use in humans and animal models 60, 61, with 50-60% of the risk of alcoholism being a consequence of genetic factors 62, 63. Alcohol consumption measures are reliable and valid indices of alcohol usage in human reports 64, 65. Gene networks affiliated with lifetime alcohol consumption were enriched for genetic association signals involving alcohol dependence (Fig. 5), providing convergent evidence for an aggregate of genes as causal determinants in disease progression. Disease-specific sequence variant commonalities were modest, but may be due to localization of SNPs within non-coding regions of DNA 66. Sequencing of DNA and RNA isolated from the same subjects could provide even greater detail of the genetic architecture of transcriptional variation and subsequent behavioral traits. Prior studies on candidate genes, such as AUTS2, have demonstrated a potential role for intronic SNPs in alcohol consumption 67. Allelic variation within the intronic SNP rs6943555 of AUTS2 was also associated with altered mRNA expression in human prefrontal cortex 67. Transcriptome meta-analysis of mice differing in voluntary alcohol consumption also showed expression differences of Auts2, which is located within a quantitative trait loci (QTL) for alcohol preference between high alcohol preferring (HAP1) and low alcohol preferring (LAP1) mice45. Furthermore, down-regulation of an AUTS2 homolog in Drosophila blunted alcohol sensitivity, providing cross-species evidence for the role of AUTS2 in alcohol-related behavioral traits 67. AUTS2 is a member of the upper quartile gene modules described herein for lifetime alcohol consumption, illustrating a specific gene within the network that has been validated in independent studies for alcohol consumption.
Gene modules in the upper quartile of lifetime alcohol consumption constituted two main groups (Fig. 2), with only Group1 being enriched for signals from GWAS of alcohol dependence. The lack of genetic association within GMs belonging to Group2 may by and large suggest a non-genetic, yet biologically related to Group1, set of molecular components affecting the neurobiology of alcohol intake. Chronic alcohol consumption, genetic factors, and associated environmental influences may bring about coordinately regulated molecular adaptations supporting brain function in addictive processes. GM19, a Group2 module, consists of genes encoding CNS white-matter proteins (MOBP, OPALIN, UGT8, and ERMN). Abnormal white-matter expression in the PFC plays an essential role in brain morphology and behavioral responses to alcohol and other drugs of abuse 68-70. Alterations in myelin-related proteins are capable of distorting axon-glial interactions and clustering of ion channels responsible for neuronal conduction 71, a prominent biological feature of the gene modules identified with association to alcohol drinking behavior. Group2 also contains long non-coding RNAs (ncRNAs) such as NCRNA00092, NCRNA00174, and NCRNA00284. The function of these ncRNAs is currently unknown, but may be important in gene regulation and human disease 72. The network of long ncRNAs may indicate a cooperative role in cellular plasticity that shapes patterns of human alcohol consumption.
Alternative splicing of transcripts occurs for ~95% of multiexon genes in humans 73 and produces substantial functional diversity and flexibility in complex phenotypes. RNA-Seq has the ability to delineate human-specific gene isoforms relevant to neurobiology and disease. Few studies to date have conducted large-scale studies on alternative splicing for alcohol consumption. Lack of existing studies on alternative splicing for alcohol use disorders across populations limits the ability to compare the results herein. The shortest coding version of the reported QTG SCN4B is one example significantly correlated to lifetime consumption and is part of a transcriptional network that may alter neurophysiological responses to alcohol. Although further experiments are necessary to probe molecular interactions with alcohol and yet unforeseen physiology of splice variants, our analysis provides evidence within a network-based infrastructure involving multiple adjoining isoforms for alcohol dependence. For example, activity of SCN8A transcripts, the density of which is maintained by the composition of white-matter 74, may be altered by interaction with SCN4B isoforms and in turn collectively affect neuronal properties amongst a network of receptor-mediated systems. RNA-Seq studies are poised to reveal novel transcriptome dynamics for a variety of diseases and phenotypes; however, independent studies from other model systems may extend RNA-Seq findings as additional tools and resources become available over time. RNA-Seq studies are restricted to the materials available for transcriptome profiling. Limited access to human brain tissue for alcohol dependence, as well as other neuropsychiatric conditions, often precludes investigation of temporal transcriptome changes in response to repeated substance abuse or environmental differences. Characterizing the transcriptome of postmortem brain tissue represents an end-stage molecular phenotype, the cumulative effects on the transcriptome within an individual. Expanding RNA-Seq efforts across a greater cross section of individuals and brain regions may strengthen our understanding of molecular networks influencing alcohol-drinking behavior, but across this representative sample of alcoholics emphasizes a broader picture of transcriptome differences within PFC that are related to disease. Transcriptome signatures defined by GMs in Group1 for lifetime alcohol consumption contain targets for several pharmaceutical agents that have the potential to curb alcohol intake, including the prescription drug gabapentin (P = 4.91e-07). A randomized clinical trial for alcohol dependence has previously shown the effectiveness of gabapentin on heavy drinking and prolonging abstinence 75. Combining clinical and transcriptome results demonstrates a practical utility of this and related studies to determine potential pharmacotherapies for alcohol abuse. Polymorphisms conferring the risk of developing alcohol dependence may influence network substructures related to alcohol drinking behavior and dictate logical treatment options. The results of our integrative study emphasize the power of high-throughput sequencing of human postmortem brain tissue as an intermediate resource for uncovering novel molecular mechanisms in human disease and as a means of informing personalized medicine for the treatment of alcohol use disorders.
Supplementary Material
Bar plots of variation across 16 individuals for estimates in (top to bottom) duration of alcohol consumption in years, lifetime consumption of alcohol (standard drinks / year), quantity of alcohol consumed (grams of alcohol / day), and standardized drinks of alcohol.
Table lists the modules from weighted gene coexpression analysis for genes and their alternatively spliced transcripts. Gene Modules (GM) corresponds with Transcript Modules (TM) in alcoholic prefrontal cortex (PFC). The three coding variants and one non-coding variant of SCN4B belong to four separate modules, with the non-coding form not coexpressed alongside any requisite sodium channel alpha subunits.
Plots of alcoholics (n=16, red) and matched controls (n=15, blue) for the number of mapped reads, age, brain weight, brain pH, post-mortem interval (PMI), and RNA integrity (RIN) value. Observed test statistics are shown beneath the title of each group, per comparison of controls and alcoholics. There is variation for each of the measures as expected from human samples; however, there are no statistical differences between alcoholics and controls in any of our case-sample information.
Twenty-two previously determined WGCNA modules (y-axis) for alcohol dependence using microarrays 6 are all significantly conserved in the current investigation using RNA-Seq to quantify gene expression. Colors and numbers indicate CTX (does it need to be defined?) modules from our prior published work. Shown along the x-axis are the -log10 P-values for conservation of RNA-Seq coexpression based on the Fisher’s exact test. All microarray gene modules are preserved in our RNA-Seq study, externally validating gene expression; however, RNA-Seq has technical advantages over microarray-based approaches leading to the detection of greater gene expression and improved network classification.
The dendrogram represents the clustering of control (top) and alcoholic (bottom) samples based on hierarchical clustering of gene expression. Beneath each dendrogram are heatmaps for the additional variables (brain weight, brain pH, PMI, RIN, age, smoking history, and blood alcohol concentration (BAC)). Brain weight is given in grams, and BAC is in grams / 100 mL with NA representing non-reported information for that individual. Smoking history is a ranking based upon being a heavy smoker (4), general smoker (3), social smoker (2), former smoker (1), and non-smoker (0). Each group of variables was z-scored to show that no substantial cluster bias occurs in relation to any of the seven variables.
Shown are the mean preservation scores for alcoholic versus control modules within the upper quartile (n=10), interquartile (n=18), and lower quartile (n=10) of association with lifetime alcohol consumption following 1000 permutations. Overall mean group-wise module preservation scores are strong (>10), reflecting module expression within an identical brain region of alcoholics and matched controls. However, module preservation is the weakest in the upper quartile group, suggesting an altered pairwise relationship of genes within this grouping that are collectively linked with alcohol drinking behavior in humans.
Boxplots depicting correlation values among gene coexpression modules within the upper quartile (GM20, GM25, GM13, GM28, GM15, GM19, GM30, GM37, GM33, GM31) and the lower quartile (GM14, GM32, GM18, GM29, GM5, GM7, GM6, GM24, GM17, GM2) of lifelong alcohol drinking. There are two sets of consistent patterns within the upper quartile, Group1 (GM20, GM25, GM15, GM31) and Group2 (GM13, GM28, GM19, GM30, GM37, GM33). Group1 is the least variable arrangement of modules, but also displays the highest correlation.
(a) Visualization demonstrates the inter-connection of alternatively spliced transcripts for the network containing the SCN4B isoform, NM_001142349, with ≥ |r = 0.75| correlation strength. Dashed box shows an enlarged subsection of the network, illustrating the significant association of SCN4B isoform NM_001142349 with SCN8A isoform NM_014191. (b) Functional enrichment for genes within the module containing NM_001142349, depicting similar ontological categories as the GM in the upper quartile of lifetime consumption of alcohol.
The tables list the over-representation of RNA-Seq gene modules (GM) by numeric and colored identifiers among a number of previous studies in brain and CNS cell types. RNA-Seq GMs are assembled into functional biological units with general agreement with prior studies of human brain, demonstrating the robustness of the RNA-Seq assessment in gene expression.
Tables show the significant over-representation of gene coexpression modules within the upper quartile of alcohol consumption, based on standard gene ontology categories, available human disease and mouse phenotypes, molecular pathways, functional domains, published literature, transcription-factor binding, drug targets, and microRNAs. Results are shown for the number of genes in GMs, number of targets in the reference set, and corresponding P-values (corrected for a 5% false discovery rate).
Acknowledgments
The authors acknowledge the Texas Advanced Computing Center (TACC) at the University of Texas at Austin for providing computing resources. The authors are grateful to the New South Wales Tissue Resource Centre at the University of Sydney for providing human brain samples; the Centre is supported by the National Health and Medical Research Council of Australia, Schizophrenia Research Institute, and National Institute on Alcohol Abuse and Alcoholism (NIH/NIAAA R24AA012725). This work was supported by funding through the National Institute on Alcohol Abuse and Alcoholism and the Integrative Neuroscience Initiative on Alcoholism (INIA-West): AA013517, AA012404, AA020926, AA019382, and AA007471.
Footnotes
Author Contributions: SPF analyzed data and wrote the manuscript; DA, SHS, and RDM performed sequencing and mapping of collected sequence reads; RAH and RDM assisted in experimental design, manuscript writing, and coordination of the collection and preparation for all experimental samples.
Conflict of interest: The authors declare no conflict of interest.
References
- 1.Kauer JA, Malenka RC. Synaptic plasticity and addiction. Nat Rev Neurosci. 2007;8:844–858. doi: 10.1038/nrn2234. [DOI] [PubMed] [Google Scholar]
- 2.Koob GF, Volkow ND. Neurocircuitry of addiction. Neuropsychopharmacology. 2010;35:217–238. doi: 10.1038/npp.2009.110. [DOI] [PMC free article] [PubMed] [Google Scholar]
- 3.Heilig M, Goldman D, Berrettini W, O’Brien CP. Pharmacogenetic approaches to the treatment of alcohol addiction. Nat Rev Neurosci. 2011;12:670–684. doi: 10.1038/nrn3110. [DOI] [PMC free article] [PubMed] [Google Scholar]
- 4.Farris SP, Wolen AR, Miles MF. Using expression genetics to study the neurobiology of ethanol and alcoholism. Int Rev Neurobiol. 2010;91:95–128. doi: 10.1016/S0074-7742(10)91004-0. [DOI] [PMC free article] [PubMed] [Google Scholar]
- 5.Sutherland GT, Sheedy D, Kril JJ. Using autopsy brain tissue to study alcohol-related brain damage in the genomic age. Alcohol Clin Exp Res. 2014;38:1–8. doi: 10.1111/acer.12243. [DOI] [PMC free article] [PubMed] [Google Scholar]
- 6.Ponomarev I, Wang S, Zhang L, Harris RA, Mayfield RD. Gene coexpression networks in human brain identify epigenetic modifications in alcohol dependence. J Neurosci. 2012;32:1884–1897. doi: 10.1523/JNEUROSCI.3136-11.2012. [DOI] [PMC free article] [PubMed] [Google Scholar]
- 7.Contet C. Gene Expression Under the Influence: Transcriptional Profiling of Ethanol in the Brain. Curr Psychopharmacol. 2012;1:301–314. doi: 10.2174/2211556011201040301. [DOI] [PMC free article] [PubMed] [Google Scholar]
- 8.Hitzemann R, Bottomly D, Darakjian P, Walter N, Iancu O, Searles R, et al. Genes, behavior and next-generation RNA sequencing. Genes Brain Behav. 2013;12:1–12. doi: 10.1111/gbb.12007. [DOI] [PMC free article] [PubMed] [Google Scholar]
- 9.Zhou Z, Yuan Q, Mash DC, Goldman D. Substance-specific and shared transcription and epigenetic changes in the human hippocampus chronically exposed to cocaine and alcohol. Proc Natl Acad Sci USA. 2011;108:6626–6631. doi: 10.1073/pnas.1018514108. [DOI] [PMC free article] [PubMed] [Google Scholar]
- 10.Enoch M-A, Zhou Z, Kimura M, Mash DC, Yuan Q, Goldman D. GABAergic gene expression in postmortem hippocampus from alcoholics and cocaine addicts; corresponding findings in alcohol-naïve P and NP rats. PLoS ONE. 2012;7:e29369. doi: 10.1371/journal.pone.0029369. [DOI] [PMC free article] [PubMed] [Google Scholar]
- 11.Lee C, Mayfield RD, Harris RA. Altered gamma-aminobutyric acid type B receptor subunit 1 splicing in alcoholics. Biological Psychiatry. 2014;75:765–773. doi: 10.1016/j.biopsych.2013.08.028. [DOI] [PMC free article] [PubMed] [Google Scholar]
- 12.Oldham MC, Konopka G, Iwamoto K, Langfelder P, Kato T, Horvath S, et al. Functional organization of the transcriptome in human brain. Nat Neurosci. 2008;11:1271–1282. doi: 10.1038/nn.2207. [DOI] [PMC free article] [PubMed] [Google Scholar]
- 13.Hawrylycz MJ, Lein ES, Guillozet-Bongaarts AL, Shen EH, Ng L, Miller JA, et al. An anatomically comprehensive atlas of the adult human brain transcriptome. Nature. 2012;489:391–399. doi: 10.1038/nature11405. [DOI] [PMC free article] [PubMed] [Google Scholar]
- 14.Civelek M, Lusis AJ. Systems genetics approaches to understand complex traits. Nat Rev Genet. 2014;15:34–48. doi: 10.1038/nrg3575. [DOI] [PMC free article] [PubMed] [Google Scholar]
- 15.Zhu J, Zhang B, Smith EN, Drees B, Brem RB, Kruglyak L, et al. Integrating large-scale functional genomic data to dissect the complexity of yeast regulatory networks. Nat Genet. 2008;40:854–861. doi: 10.1038/ng.167. [DOI] [PMC free article] [PubMed] [Google Scholar]
- 16.Koob GF, Le Moal M. Drug abuse: hedonic homeostatic dysregulation. Science. 1997;278:52–58. doi: 10.1126/science.278.5335.52. [DOI] [PubMed] [Google Scholar]
- 17.Nestler EJ, Aghajanian GK. Molecular and cellular basis of addiction. Science. 1997;278:58–63. doi: 10.1126/science.278.5335.58. [DOI] [PubMed] [Google Scholar]
- 18.Kalivas PW, Volkow ND. The neural basis of addiction: a pathology of motivation and choice. Am J Psychiatry. 2005;162:1403–1413. doi: 10.1176/appi.ajp.162.8.1403. [DOI] [PubMed] [Google Scholar]
- 19.Goldstein RZ, Volkow ND. Dysfunction of the prefrontal cortex in addiction: neuroimaging findings and clinical implications. Nat Rev Neurosci. 2011;12:652–669. doi: 10.1038/nrn3119. [DOI] [PMC free article] [PubMed] [Google Scholar]
- 20.Xing Y, Yu T, Wu YN, Roy M, Kim J, Lee C. An expectation-maximization algorithm for probabilistic reconstructions of full-length isoforms from splice graphs. Nucleic Acids Res. 2006;34:3150–3160. doi: 10.1093/nar/gkl396. [DOI] [PMC free article] [PubMed] [Google Scholar]
- 21.Anders S, Huber W. Differential expression analysis for sequence count data. Genome Biol. 2010;11:R106. doi: 10.1186/gb-2010-11-10-r106. [DOI] [PMC free article] [PubMed] [Google Scholar]
- 22.Langfelder P, Horvath S. WGCNA: an R package for weighted correlation network analysis. BMC Bioinformatics. 2008;9:559. doi: 10.1186/1471-2105-9-559. [DOI] [PMC free article] [PubMed] [Google Scholar]
- 23.Langfelder P, Zhang B, Horvath S. Defining clusters from a hierarchical cluster tree: the Dynamic Tree Cut package for R. Bioinformatics. 2008;24:719–720. doi: 10.1093/bioinformatics/btm563. [DOI] [PubMed] [Google Scholar]
- 24.Langfelder P, Luo R, Oldham MC, Horvath S. Is my network module preserved and reproducible? PLoS Comput Biol. 2011;7:e1001057. doi: 10.1371/journal.pcbi.1001057. [DOI] [PMC free article] [PubMed] [Google Scholar]
- 25.Dennis G, Sherman BT, Hosack DA, Yang J, Gao W, Lane HC, et al. DAVID: Database for Annotation, Visualization, and Integrated Discovery. Genome Biol. 2003;4:P3. [PubMed] [Google Scholar]
- 26.Chen J, Bardes EE, Aronow BJ, Jegga AG. ToppGene Suite for gene list enrichment analysis and candidate gene prioritization. Nucleic Acids Res. 2009;37:W305–W311. doi: 10.1093/nar/gkp427. [DOI] [PMC free article] [PubMed] [Google Scholar]
- 27.Cahoy JD, Emery B, Kaushal A, Foo LC, Zamanian JL, Christopherson KS, et al. A transcriptome database for astrocytes, neurons, and oligodendrocytes: a new resource for understanding brain development and function. J Neurosci. 2008;28:264–278. doi: 10.1523/JNEUROSCI.4178-07.2008. [DOI] [PMC free article] [PubMed] [Google Scholar]
- 28.Shannon P, Markiel A, Ozier O, Baliga NS, Wang JT, Ramage D, et al. Cytoscape: a software environment for integrated models of biomolecular interaction networks. Genome Res. 2003;13:2498–2504. doi: 10.1101/gr.1239303. [DOI] [PMC free article] [PubMed] [Google Scholar]
- 29.Mailman MD, Feolo M, Jin Y, Kimura M, Tryka K, Bagoutdinov R, et al. The NCBI dbGaP database of genotypes and phenotypes. Nat Genet. 2007;39:1181–1186. doi: 10.1038/ng1007-1181. [DOI] [PMC free article] [PubMed] [Google Scholar]
- 30.Durinck S, Spellman PT, Birney E, Huber W. Mapping identifiers for the integration of genomic datasets with the R/Bioconductor package biomaRt. Nat Protoc. 2009;4:1184–1191. doi: 10.1038/nprot.2009.97. [DOI] [PMC free article] [PubMed] [Google Scholar]
- 31.Pruitt KD, Tatusova T, Klimke W, Maglott DR. NCBI Reference Sequences: current status, policy and new initiatives. Nucleic Acids Res. 2009;37:D32–D36. doi: 10.1093/nar/gkn721. [DOI] [PMC free article] [PubMed] [Google Scholar]
- 32.Zhang B, Horvath S. A general framework for weighted gene co-expression network analysis. Stat Appl Genet Mol Biol. 2005;4 doi: 10.2202/1544-6115.1128. Article17. [DOI] [PubMed] [Google Scholar]
- 33.Barabási A-L, Oltvai ZN. Network biology: understanding the cell’s functional organization. Nat Rev Genet. 2004;5:101–113. doi: 10.1038/nrg1272. [DOI] [PubMed] [Google Scholar]
- 34.Vidal M, Cusick ME, Barabási A-L. Interactome networks and human disease. Cell. 2011;144:986–998. doi: 10.1016/j.cell.2011.02.016. [DOI] [PMC free article] [PubMed] [Google Scholar]
- 35.Kang HJ, Kawasawa YI, Cheng F, Zhu Y, Xu X, Li M, et al. Spatio-temporal transcriptome of the human brain. Nature. 2011;478:483–489. doi: 10.1038/nature10523. [DOI] [PMC free article] [PubMed] [Google Scholar]
- 36.Willsey AJ, Sanders SJ, Li M, Dong S, Tebbenkamp AT, Muhle RA, et al. Coexpression networks implicate human midfetal deep cortical projection neurons in the pathogenesis of autism. Cell. 2013;155:997–1007. doi: 10.1016/j.cell.2013.10.020. [DOI] [PMC free article] [PubMed] [Google Scholar]
- 37.Gaiteri C, Ding Y, French B, Tseng GC, Sibille E. Beyond modules and hubs: the potential of gene coexpression networks for investigating molecular mechanisms of complex brain disorders. Genes Brain Behav. 2014;13:13–24. doi: 10.1111/gbb.12106. [DOI] [PMC free article] [PubMed] [Google Scholar]
- 38.Iancu OD, Kawane S, Bottomly D, Searles R, Hitzemann R, McWeeney S. Utilizing RNA-Seq data for de novo coexpression network inference. Bioinformatics. 2012;28:1592–1597. doi: 10.1093/bioinformatics/bts245. [DOI] [PMC free article] [PubMed] [Google Scholar]
- 39.Harris RA, Trudell JR, Mihic SJ. Ethanol’s molecular targets. Sci Signal. 2008;1:re7. doi: 10.1126/scisignal.128re7. [DOI] [PMC free article] [PubMed] [Google Scholar]
- 40.Ron D, Messing RO. Signaling pathways mediating alcohol effects. Curr Top Behav Neurosci. 2013;13:87–126. doi: 10.1007/7854_2011_161. [DOI] [PMC free article] [PubMed] [Google Scholar]
- 41.Lovinger DM, Crabbe JC. Laboratory models of alcoholism: treatment target identification and insight into mechanisms. Nat Neurosci. 2005;8:1471–1480. doi: 10.1038/nn1581. [DOI] [PubMed] [Google Scholar]
- 42.Everitt BJ, Robbins TW. Neural systems of reinforcement for drug addiction: from actions to habits to compulsion. Nat Neurosci. 2005;8:1481–1489. doi: 10.1038/nn1579. [DOI] [PubMed] [Google Scholar]
- 43.Lovinger DM, White G, Weight FF. Ethanol inhibits NMDA-activated ion current in hippocampal neurons. Science. 1989;243:1721–1724. doi: 10.1126/science.2467382. [DOI] [PubMed] [Google Scholar]
- 44.Bayés A, van de Lagemaat LN, Collins MO, Croning MDR, Whittle IR, Choudhary JS, et al. Characterization of the proteome, diseases and evolution of the human postsynaptic density. Nat Neurosci. 2011;14:19–21. doi: 10.1038/nn.2719. [DOI] [PMC free article] [PubMed] [Google Scholar]
- 45.Mulligan MK, Ponomarev I, Hitzemann RJ, Belknap JK, Tabakoff B, Harris RA, et al. Toward understanding the genetics of alcohol drinking through transcriptome meta-analysis. Proc Natl Acad Sci USA. 2006;103:6368–6373. doi: 10.1073/pnas.0510188103. [DOI] [PMC free article] [PubMed] [Google Scholar]
- 46.Davies AG, Pierce-Shimomura JT, Kim H, VanHoven MK, Thiele TR, Bonci A, et al. A central role of the BK potassium channel in behavioral responses to ethanol in C. elegans. Cell. 2003;115:655–666. doi: 10.1016/s0092-8674(03)00979-6. [DOI] [PubMed] [Google Scholar]
- 47.Kuo P-H, Kalsi G, Prescott CA, Hodgkinson CA, Goldman D, Alexander J, et al. Associations of glutamate decarboxylase genes with initial sensitivity and age-at-onset of alcohol dependence in the Irish Affected Sib Pair Study of Alcohol Dependence. Drug Alcohol Depend. 2009;101:80–87. doi: 10.1016/j.drugalcdep.2008.11.009. [DOI] [PMC free article] [PubMed] [Google Scholar]
- 48.Buck KJ, Metten P, Belknap JK, Crabbe JC. Quantitative trait loci involved in genetic predisposition to acute alcohol withdrawal in mice. J Neurosci. 1997;17:3946–3955. doi: 10.1523/JNEUROSCI.17-10-03946.1997. [DOI] [PMC free article] [PubMed] [Google Scholar]
- 49.Peñagarikano O, Abrahams BS, Herman EI, Winden KD, Gdalyahu A, Dong H, et al. Absence of CNTNAP2 leads to epilepsy, neuronal migration abnormalities, and core autism-related deficits. Cell. 2011;147:235–246. doi: 10.1016/j.cell.2011.08.040. [DOI] [PMC free article] [PubMed] [Google Scholar]
- 50.Parikshak NN, Luo R, Zhang A, Won H, Lowe JK, Chandran V, et al. Integrative functional genomic analyses implicate specific molecular pathways and circuits in autism. Cell. 2013;155:1008–1021. doi: 10.1016/j.cell.2013.10.031. [DOI] [PMC free article] [PubMed] [Google Scholar]
- 51.Harris RA. Ethanol actions on multiple ion channels: which are important? Alcohol Clin Exp Res. 1999;23:1563–1570. [PubMed] [Google Scholar]
- 52.Hayashi K, Ohshima T, Mikoshiba K. Pak1 is involved in dendrite initiation as a downstream effector of Rac1 in cortical neurons. Mol Cell Neurosci. 2002;20:579–594. doi: 10.1006/mcne.2002.1144. [DOI] [PubMed] [Google Scholar]
- 53.Hayashi K, Ohshima T, Hashimoto M, Mikoshiba K. Pak1 regulates dendritic branching and spine formation. Dev Neurobiol. 2007;67:655–669. doi: 10.1002/dneu.20363. [DOI] [PubMed] [Google Scholar]
- 54.Robinson TE, Kolb B. Structural plasticity associated with exposure to drugs of abuse. Neuropharmacology. 2004;47:33–46. doi: 10.1016/j.neuropharm.2004.06.025. [DOI] [PubMed] [Google Scholar]
- 55.Tabakoff B, Saba L, Kechris K, Hu W, Bhave SV, Finn DA, et al. The genomic determinants of alcohol preference in mice. Mamm Genome. 2008;19:352–365. doi: 10.1007/s00335-008-9115-z. [DOI] [PMC free article] [PubMed] [Google Scholar]
- 56.Yu FH, Westenbroek RE, Silos-Santiago I, McCormick KA, Lawson D, Ge P, et al. Sodium channel beta4, a new disulfide-linked auxiliary subunit with similarity to beta2. J Neurosci. 2003;23:7577–7585. doi: 10.1523/JNEUROSCI.23-20-07577.2003. [DOI] [PMC free article] [PubMed] [Google Scholar]
- 57.Grieco TM, Malhotra JD, Chen C, Isom LL, Raman IM. Open-channel block by the cytoplasmic tail of sodium channel beta4 as a mechanism for resurgent sodium current. Neuron. 2005;45:233–244. doi: 10.1016/j.neuron.2004.12.035. [DOI] [PubMed] [Google Scholar]
- 58.Oyama F, Miyazaki H, Sakamoto N, Becquet C, Machida Y, Kaneko K, et al. Sodium channel beta4 subunit: down-regulation and possible involvement in neuritic degeneration in Huntington’s disease transgenic mice. J Neurochem. 2006;98:518–529. doi: 10.1111/j.1471-4159.2006.03893.x. [DOI] [PubMed] [Google Scholar]
- 59.Caldwell JH, Schaller KL, Lasher RS, Peles E, Levinson SR. Sodium channel Na(v)1.6 is localized at nodes of ranvier, dendrites, and synapses. Proc Natl Acad Sci USA. 2000;97:5616–5620. doi: 10.1073/pnas.090034797. [DOI] [PMC free article] [PubMed] [Google Scholar]
- 60.Crabbe JC, Belknap JK, Buck KJ. Genetic animal models of alcohol and drug abuse. Science. 1994;264:1715–1723. doi: 10.1126/science.8209252. [DOI] [PubMed] [Google Scholar]
- 61.Li TK. Pharmacogenetics of responses to alcohol and genes that influence alcohol drinking. J Stud Alcohol. 2000;61:5–12. doi: 10.15288/jsa.2000.61.5. [DOI] [PubMed] [Google Scholar]
- 62.Heath AC, Bucholz KK, Madden PA, Dinwiddie SH, Slutske WS, Bierut LJ, et al. Genetic and environmental contributions to alcohol dependence risk in a national twin sample: consistency of findings in women and men. Psychol Med. 1997;27:1381–1396. doi: 10.1017/s0033291797005643. [DOI] [PubMed] [Google Scholar]
- 63.Prescott CA, Kendler KS. Genetic and environmental contributions to alcohol abuse and dependence in a population-based sample of male twins. Am J Psychiatry. 1999;156:34–40. doi: 10.1176/ajp.156.1.34. [DOI] [PubMed] [Google Scholar]
- 64.Del Boca FK, Darkes J. The validity of self-reports of alcohol consumption: state of the science and challenges for research. Addiction. 2003;98(2):1–12. doi: 10.1046/j.1359-6357.2003.00586.x. [DOI] [PubMed] [Google Scholar]
- 65.Grant BF, Dawson DA, Stinson FS, Chou PS, Kay W, Pickering R. The Alcohol Use Disorder and Associated Disabilities Interview Schedule-IV (AUDADIS-IV): reliability of alcohol consumption, tobacco use, family history of depression and psychiatric diagnostic modules in a general population sample. Drug Alcohol Depend. 2003;71:7–16. doi: 10.1016/s0376-8716(03)00070-x. [DOI] [PubMed] [Google Scholar]
- 66.ENCODE Project Consortium. Bernstein BE, Birney E, Dunham I, Green ED, Gunter C, et al. An integrated encyclopedia of DNA elements in the human genome. Nature. 2012;489:57–74. doi: 10.1038/nature11247. [DOI] [PMC free article] [PubMed] [Google Scholar]
- 67.Schumann G, Coin LJ, Lourdusamy A, Charoen P, Berger KH, Stacey D, et al. Genome-wide association and genetic functional studies identify autism susceptibility candidate 2 gene (AUTS2) in the regulation of alcohol consumption. Proceedings of the National Academy of Sciences. 2011;108:7119–7124. doi: 10.1073/pnas.1017288108. [DOI] [PMC free article] [PubMed] [Google Scholar]
- 68.Pfefferbaum A, Sullivan EV, Mathalon DH, Lim KO. Frontal lobe volume loss observed with magnetic resonance imaging in older chronic alcoholics. Alcohol Clin Exp Res. 1997;21:521–529. doi: 10.1111/j.1530-0277.1997.tb03798.x. [DOI] [PubMed] [Google Scholar]
- 69.Farris SP, Miles MF. Fyn-dependent gene networks in acute ethanol sensitivity. PLoS ONE. 2013;8:e82435. doi: 10.1371/journal.pone.0082435. [DOI] [PMC free article] [PubMed] [Google Scholar]
- 70.Ersche KD, Jones PS, Williams GB, Turton AJ, Robbins TW, Bullmore ET. Abnormal brain structure implicated in stimulant drug addiction. Science. 2012;335:601–604. doi: 10.1126/science.1214463. [DOI] [PubMed] [Google Scholar]
- 71.Poliak S, Peles E. The local differentiation of myelinated axons at nodes of Ranvier. Nat Rev Neurosci. 2003;4:968–980. doi: 10.1038/nrn1253. [DOI] [PubMed] [Google Scholar]
- 72.Mercer TR, Dinger ME, Mattick JS. Long non-coding RNAs: insights into functions. Nat Rev Genet. 2009;10:155–159. doi: 10.1038/nrg2521. [DOI] [PubMed] [Google Scholar]
- 73.Pan Q, Shai O, Lee LJ, Frey BJ, Blencowe BJ. Deep surveying of alternative splicing complexity in the human transcriptome by high-throughput sequencing. Nat Genet. 2008;40:1413–1415. doi: 10.1038/ng.259. [DOI] [PubMed] [Google Scholar]
- 74.Rasband MN, Taylor CM, Bansal R. Paranodal transverse bands are required for maintenance but not initiation of Nav1.6 sodium channel clustering in CNS optic nerve axons. Glia. 2003;44:173–182. doi: 10.1002/glia.10284. [DOI] [PubMed] [Google Scholar]
- 75.Mason BJ, Quello S, Goodell V, Shadan F, Kyle M, Begovic A. Gabapentin treatment for alcohol dependence: a randomized clinical trial. JAMA Intern Med. 2014;174:70–77. doi: 10.1001/jamainternmed.2013.11950. [DOI] [PMC free article] [PubMed] [Google Scholar]
Associated Data
This section collects any data citations, data availability statements, or supplementary materials included in this article.
Supplementary Materials
Bar plots of variation across 16 individuals for estimates in (top to bottom) duration of alcohol consumption in years, lifetime consumption of alcohol (standard drinks / year), quantity of alcohol consumed (grams of alcohol / day), and standardized drinks of alcohol.
Table lists the modules from weighted gene coexpression analysis for genes and their alternatively spliced transcripts. Gene Modules (GM) corresponds with Transcript Modules (TM) in alcoholic prefrontal cortex (PFC). The three coding variants and one non-coding variant of SCN4B belong to four separate modules, with the non-coding form not coexpressed alongside any requisite sodium channel alpha subunits.
Plots of alcoholics (n=16, red) and matched controls (n=15, blue) for the number of mapped reads, age, brain weight, brain pH, post-mortem interval (PMI), and RNA integrity (RIN) value. Observed test statistics are shown beneath the title of each group, per comparison of controls and alcoholics. There is variation for each of the measures as expected from human samples; however, there are no statistical differences between alcoholics and controls in any of our case-sample information.
Twenty-two previously determined WGCNA modules (y-axis) for alcohol dependence using microarrays 6 are all significantly conserved in the current investigation using RNA-Seq to quantify gene expression. Colors and numbers indicate CTX (does it need to be defined?) modules from our prior published work. Shown along the x-axis are the -log10 P-values for conservation of RNA-Seq coexpression based on the Fisher’s exact test. All microarray gene modules are preserved in our RNA-Seq study, externally validating gene expression; however, RNA-Seq has technical advantages over microarray-based approaches leading to the detection of greater gene expression and improved network classification.
The dendrogram represents the clustering of control (top) and alcoholic (bottom) samples based on hierarchical clustering of gene expression. Beneath each dendrogram are heatmaps for the additional variables (brain weight, brain pH, PMI, RIN, age, smoking history, and blood alcohol concentration (BAC)). Brain weight is given in grams, and BAC is in grams / 100 mL with NA representing non-reported information for that individual. Smoking history is a ranking based upon being a heavy smoker (4), general smoker (3), social smoker (2), former smoker (1), and non-smoker (0). Each group of variables was z-scored to show that no substantial cluster bias occurs in relation to any of the seven variables.
Shown are the mean preservation scores for alcoholic versus control modules within the upper quartile (n=10), interquartile (n=18), and lower quartile (n=10) of association with lifetime alcohol consumption following 1000 permutations. Overall mean group-wise module preservation scores are strong (>10), reflecting module expression within an identical brain region of alcoholics and matched controls. However, module preservation is the weakest in the upper quartile group, suggesting an altered pairwise relationship of genes within this grouping that are collectively linked with alcohol drinking behavior in humans.
Boxplots depicting correlation values among gene coexpression modules within the upper quartile (GM20, GM25, GM13, GM28, GM15, GM19, GM30, GM37, GM33, GM31) and the lower quartile (GM14, GM32, GM18, GM29, GM5, GM7, GM6, GM24, GM17, GM2) of lifelong alcohol drinking. There are two sets of consistent patterns within the upper quartile, Group1 (GM20, GM25, GM15, GM31) and Group2 (GM13, GM28, GM19, GM30, GM37, GM33). Group1 is the least variable arrangement of modules, but also displays the highest correlation.
(a) Visualization demonstrates the inter-connection of alternatively spliced transcripts for the network containing the SCN4B isoform, NM_001142349, with ≥ |r = 0.75| correlation strength. Dashed box shows an enlarged subsection of the network, illustrating the significant association of SCN4B isoform NM_001142349 with SCN8A isoform NM_014191. (b) Functional enrichment for genes within the module containing NM_001142349, depicting similar ontological categories as the GM in the upper quartile of lifetime consumption of alcohol.
The tables list the over-representation of RNA-Seq gene modules (GM) by numeric and colored identifiers among a number of previous studies in brain and CNS cell types. RNA-Seq GMs are assembled into functional biological units with general agreement with prior studies of human brain, demonstrating the robustness of the RNA-Seq assessment in gene expression.
Tables show the significant over-representation of gene coexpression modules within the upper quartile of alcohol consumption, based on standard gene ontology categories, available human disease and mouse phenotypes, molecular pathways, functional domains, published literature, transcription-factor binding, drug targets, and microRNAs. Results are shown for the number of genes in GMs, number of targets in the reference set, and corresponding P-values (corrected for a 5% false discovery rate).