

Abstract
Persistent inflammation results in an increase in the amplitude and duration of depolarization-evoked Ca2+ transients in putative nociceptive afferents. Previous data indicated that these changes were the result of neither increased neuronal excitability nor an increase in the amplitude of depolarization. Subsequent data also ruled out an increase in voltage-gated Ca2+ currents and recruitment of Ca2+-induced Ca2+ release. Parametric studies indicated that the inflammation-induced increase in the duration of the evoked Ca2+ transient required a relatively large and long-lasting increase in the concentration of intracellular Ca2+ implicating the Na+/Ca2+ exchanger (NCX), a major Ca2+ extrusion mechanism activated with high intracellular Ca2+ loads. The contribution of NCX to the inflammation-induced increase in the evoked Ca2+ transient in rat sensory neurons was tested using fura-2 AM imaging and electrophysiological recordings. Changes in NCX expression and protein were assessed with real-time PCR and Western blot analysis, respectively. An inflammation-induced decrease in NCX activity was observed in a subpopulation of putative nociceptive neurons innervating the site of inflammation. The time course of the decrease in NCX activity paralleled that of the inflammation-induced changes in nociceptive behavior. The change in NCX3 in the cell body was associated with a decrease in NCX3 protein in the ganglia, an increase in the peripheral nerve (sciatic) yet no change in the central root. This single response to inflammation is associated with changes in at least three different segments of the primary afferent, all of which are likely to contribute to the dynamic response to persistent inflammation.
Keywords: dorsal root ganglion, hyperalgesia, nociceptor sensitization, pain, retrograde tracer
Introduction
Tissue inflammation is associated with an increase in the amplitude and duration of the evoked Ca2+ transient in a subpopulation of putative nociceptive cutaneous DRG neurons (Lu and Gold, 2008). Alterations in intracellular Ca2+ ([Ca2+]i) signaling can increase afferent excitability (Zhang et al., 2012), facilitate transmitter release (Flake and Gold, 2005), and/or lead to changes in gene expression (Fields et al., 2005), all functions that may contribute to the pain and hypersensitivity of persistent inflammation.
The amplitude and duration of evoked Ca2+ transients are determined by the combined action of channels, buffers, pumps, and exchangers (Berridge et al., 2000). Therefore, there are a number of mechanisms that could contribute to the inflammation-induced increase in the depolarization-induced Ca2+ transient. We have previously ruled out many mechanisms, including an increase in the amplitude of depolarization (Lu and Gold, 2008) and density of voltage-gated Ca2+ channels (VGCCs; Lu et al., 2010), the recruitment of Ca2+-induced Ca2+ release, a change in sarco-endoplasmic reticulum ATPase function, and mitochondrial-dependent Ca2+ buffering (Scheff et al., 2013). Furthermore, because the inflammation-induced change in Ca2+ signaling is not associated with an increase in resting Ca2+ (Lu and Gold, 2008) and the available evidence suggests that the plasma-membrane Ca2+ ATPase (PMCA) contributes to resting Ca2+ levels (Wanaverbecq et al., 2003; Gemes et al., 2012), we predicted that the inflammation-induced changes in the evoked Ca2+ transient were not attributable to a decrease in PMCA activity. However, as we have described previously (Scheff et al., 2014), the Na+/Ca2+ exchanger (NCX), a relatively low-affinity Ca2+ extrusion mechanism, is only active in the IB4-binding (IB4+) subset of small-diameter capsaicin-responsive cutaneous neurons, the same population in which the inflammation-induced increase in the duration of the evoked transient is manifest (Lu and Gold, 2008). We have also demonstrated that NCX activity in this population of putative nociceptive cutaneous neurons influences the duration of the evoked Ca2+ transient but not the amplitude (Lu et al., 2006). Therefore, we hypothesized that NCX contributes, at least in part, to the inflammation-induced increase in the duration of the depolarization-evoked Ca2+ transient.
To test this hypothesis, retrogradely labeled small-diameter IB4+ DRG neurons from naive and complete Freund's adjuvant (CFA)-inflamed rats were studied with ratiometric Ca2+ imaging and voltage-clamp electrophysiology in combination with a variety of pharmacological manipulations. The potential mechanisms underlying an inflammation-induced decrease in NCX activity were assessed with semiquantitative RT-PCR, Western blot analysis, and immunohistochemistry. Our results suggest that the inflammation-induced increase in the duration of the evoked Ca2+ transient is attributable to a decrease in NCX activity. This appears to be caused by an increase in trafficking of the exchanger to the peripheral but not central terminals of these putative nociceptors.
Materials and Methods
Adult male Sprague Dawley rats (220–300 g; Harlan) were used for all experiments. Rats were housed two per cage in a temperature- and humidity-controlled animal facility on a 12 h light/dark schedule with food and water available ad libitum. All procedures were approved by the University of Pittsburgh Institutional Animal Care and Use Committee and performed in accordance with National Institutes of Health guidelines for the use of laboratory animals in research.
Fourteen to 17 d before tissue harvest, the retrograde tracer 1,1′-dioctadecyl-3,3,3′,3′-tetramethylindocarbo-cyanine perchlorate (DiI; Invitrogen) was injected into the glabrous skin of the hindpaw to label cutaneous afferents. The tracer was dissolved at 170 mg/ml in dimethylsufoxide (DMSO; diluted 1:10 in 0.9% sterile saline), and injected in three to five subcutaneous sites using a 30 g needle for a total volume of 10 μl per hindpaw under isoflurane (Abbott Laboratories) anesthesia. Three days, or as indicated, before tissue harvest, rats were again anesthetized with isoflurane, and inflammation was induced at the site of tracer injection in the hindpaw with a 100 μl subcutaneous injection of CFA (Sigma-Aldrich) diluted 1:1 in 0.9% sterile saline. Before tissue removal, rats were deeply anesthetized with an intraperitoneal injection (1 ml/kg) of rat mixture containing ketamine (55 mg/ml), xylazine (5.5 mg/ml), and acepromazine (1.1 mg/ml), and the L4–L5 DRGs were removed ipsilateral to labeling and CFA-induced inflammation. Ganglia were treated enzymatically, dissociated mechanically, and plated on laminin (1 mg/ml; Invitrogen) and poly-l-ornithine-coated (1 mg/ml; Sigma-Aldrich) glass coverslips as described previously (Lu et al., 2006). All subsequent experiments were performed within 8 h of tissue harvest.
Ca2+ imaging.
Neurons were incubated with 2.5 μm Ca2+ indicator fura-2 AM ester with 0.025% Pluronic F-127 for 20 min at room temperature. Neurons were then labeled with FITC-conjugated IB4 (10 μg/ml) for 10 min at room temperature. Labeled neurons were placed in a recording chamber and superfused continuously with normal bath solution [in mm: 130 NaCl, 3 KCl, 2.5 CaCl2, 0.6 MgCl2, 10 HEPES, and 10 glucose, pH 7.4 (osmolality 325 mOsm)] or an “Na+-free” bath solution [in mm: 130 Choline-Cl or LiCl, 3 KCl, 2.5 CaCl2, 0.6 MgCl2, 10 Hepes, 10 glucose, pH 7.4, osmolality 325 mosmol]. An Na+-free solution was used to block NCX activity by preventing NCX from fulfilling the Na+ binding requirement for exchange activity (Cook et al., 1998). Fluorescence data were acquired on a personal computer running Metafluor software (Molecular Devices) via a CCD camera (model RTE/CCD 1300; Roper Scientific). The ratio of fluorescence emission (510 nm) in response to 340/380 nm excitation (controlled by a lambda 10-2 filter changer; Sutter Instruments) was acquired at 1 Hz during drug application. All drugs were applied through a computer-controlled peizo-driven perfusion system (switching time, <20 ms; fast-step model SF-77B; Warner Instruments). [Ca2+]i was determined from the fura-2 ratio after the in situ calibration experiment as described in detail previously (Grynkiewicz et al., 1985; Scheff et al., 2013).
Voltage-clamp electrophysiology.
Perforated patch-clamp experiments were performed using a HEKA EPC9 amplifier (HEKA Elektronik). Glass electrodes (1–4 MΩ) were filled with the following (in mm): 100 cesium-methanesulfonate, 5 NaCl, 40 tetraethylammonium-Cl, 0.1 CaCl2, 2 MgCl2, and 1 EGTA, pH adjusted with Tris-base to 7.2. Osmolality was adjusted to 320 mOsm with sucrose. A normal bath solution or Na+-free bath solution was used as mentioned for the microfluorimetry experiments. The pH was adjusted with Tris-base to 7.4, and osmolality was adjusted with sucrose to 320 mOsm.
Gramicidin (Sigma-Aldrich) perforated patch was used for all voltage-clamp recordings because it allows for analysis of intracellular Ca2+ regulation while recording membrane activity through monovalent cation channels inserted into the plasma membrane (Tajima et al., 1996). A stock solution of gramicidin (1.5 mg/100 μl) was prepared in DMSO. This was diluted with electrode solution in a 1:300 ratio to give a final concentration of 50 μg/ml. The gramicidin-containing electrode solution was vortexed for 15 s. No filtering was applied. The tip of the electrode was loaded with a small volume of gramicidin-free electrode solution to avoid interference of the antibiotic with seal formation. Gramicidin-containing electrode solution was back loaded. The progress of perforation was monitored with the capacitative transient to a 5 mV step. Experiments were not started until access resistance was <7 MΩ.
Series resistance compensation (>70%) was used for all voltage-clamp recording. A 4 s voltage step from −60 to 0 mV was used to evoked a Ca2+ transient. Fura-2 AM-based microfluorimetry was used in combination with voltage-clamp recording to track the decay rate of the voltage step-evoked Ca2+ transient. A computer-controlled perfusion fast-step system was used to apply an Na+-free bath solution while clamping the membrane at −60 mV to measure the amount of Na+-sensitive current throughout the decay period.
PCR.
DRGs from anesthetized rats were harvested in a manner identical to that used for neuron isolation and plating. PCR was used to amplify specific sequences within the cDNA generated from mRNA extracted from isolated ganglia. SYBR green-based real-time PCR was used to assess relative changes in NCX isoform expression with NCX primers (Table 1) on a real-time thermal cycler (Applied Biosciences) controlled by a personal computer running Prism 7000 SDS software. The melting curve of all PCR products produced a single peak, and single bands of the expected size were confirmed with agarose-gel electrophoresis. The ΔΔCt method was used to estimate changes in expression relative to that in naive rats.
Table 1.
NCX semiquantitative RT-PCR primers
| Target | GenBank accession number | Start | Sequence |
|---|---|---|---|
| NCX1 | NM_001270778.1 | 2657 | Forward: TGC AGT TGT GTT TGT CGC TCT TGG |
| 2754 | Reverse: TGC CTA TGG ACG CAT CTG CAT ACT | ||
| NCX2 | NM_078619.1 | 2382 | Forward: CAT CCC TGA CAC GTT TGC CA |
| 2480 | Reverse: AAC ACG TTC ACC GCA TTG GA | ||
| NCX3 | NM_078620.1 | 2553 | Forward: AAG GGT GGT GGT GAG GAC TTT GAA |
| 2702 | Reverse: CCA TTT CGG TTC ACC AAG GGC AAT |
Western blot.
L4 and L5 DRGs and central root and sciatic nerve samples were homogenized with Teflon tube and mortar for <10 strokes in ice-cold radioimmunoprecipitation assay (RIPA; Pierce Thermo Scientific) buffer supplied with protease inhibitors [aprotinin, leupeptin, pepstatin, E-64, trypsin inhibitor, and phenylmethanesulfonyl fluoride (PMSF), all at a final concentration of 2 ng/ml except PMSF, which was used at a final concentration of 1 mm]. The glabrous skin of the hindpaw was removed and minced, followed by homogenization steps similar to other tissues. All protease inhibitors were obtained from Sigma-Aldrich. Lysates were collected in 0.5 ml tubes. Teflon tubes were rinsed with RIPA buffer, and the solutions were combined with the lysates collected previously. Lysates were centrifuged for 5 min at 10,000 rpm at 4°C. Protein concentration was determined via bicinchoninic acid (BCA) protein assay using a BCA assay kit (Thermo Fisher Scientific). Lysates were then mixed with Laemmli's buffer (2×, 400 μl plus 100 μl of β-mercaptoethanol) and boiled for 5 min before loading. Protein (30 μg) from one animal was then loaded per lane and separated on a 7% SDS-PAGE gel and transferred to nitrocellulose membrane. Membranes were blocked with 5% milk for 1 h at room temperature and then incubated with primary antibody at 4°C overnight [1:100 for R3F1 (anti-NCX1), 1:200 for W1C3 (anti-NCX2), 1:100 for anti-NCX3 (catalog #LS-B5775; LifeSpan Biosciences), and 1:100 for anti-cluster of differentiation 68 (CD68; Abcam)] diluted with 5% milk/Tris-buffered saline with Tween 20 (TBST; Sigma-Aldrich). The blots were washed and then incubated with peroxidase-conjugated secondary antibody (1:2000 in 5% milk/TBST; Jackson ImmunoResearch) for 1 h at room temperature. An ECL kit (GE Healthcare) was used for detection of immunoreactivity, and luminescence data were collected on an LAS3000 imager (Fujifilm) and analyzed with NIH ImageJ. Both antibodies used to detect NCX1 and NCX2 were gifts from Dr. Kenneth Philipson of University of California, Los Angeles (Los Angeles, CA). Both antibodies have been characterized by Dr. Philipson and colleagues in heterologous expression systems and hippocampal cultures, in which R3F1 (anti-NCX1) detects a prominent band at 120 kDa and minor bands at 70 and 60 kDa, and W1C3 (anti-NCX2) detects only one prominent band at 60 kDa. There appears to be no cross-reactivity between isoforms (Thurneysen et al., 2002; Papa et al., 2003). Furthermore, the specificity of the anti-NCX2 antibody was confirmed in NCX2 null mutant mice (Jeon et al., 2003).
Immunohistochemistry.
Rats were anesthetized deeply with an intraperitoneal injection of rat anesthetic mixture and perfused transcardially with ice-cold 1× PBS, pH 7.2. Sciatic nerves were dissected and cryoprotected with 30% sucrose for 48 h at 4°C, embedded in OCT (Tissue Tek), cryostat sectioned at 16 μm, and thaw mounted on SuperFrost plus slides (Thermo Fisher Scientific) before staining. Glabrous skin of the hindpaw was removed gently by dissecting the sural nerve from the ankle down to the toes and immediately embedded in OCT, frozen, cryostat sectioned at 20 μm, and thaw mounted on SuperFrost plus slides before staining. Slides containing sciatic nerve sections were heated to 50°C on a hotplate for 1 h and rehydrated with PBS. All sections (nerve and skin) were postfixed for 10 min with ice-cold 4% paraformaldehyde washed extensively in PBS and blocked with PBS containing 3% normal donkey serum, 0.03% Triton X-100, and 1% BSA for 1 h at room temperature. Subsequently, slides were incubated in primary antibody [1:250 for anti-NCX3 (catalog #LS-B5775; LifeSpan Biosciences), 1:200 for anti-CD68 (Abcam), and 1:250 anti-GFRα2 (R&D Systems)] in PBS containing 1% BSA overnight at 4°C. Slides were washed extensively in PBS and incubated in donkey anti-rabbit secondary antibodies conjugated to cyanine 3 or cyanine 2 (Jackson ImmunoResearch) in blocking solution at 1:200 for 2.5 h, washed extensively, and coverslipped with Fluoromount-G (Southern Biotech). Sciatic nerve slides were photographed under epifluorescence with a Leica DM4000B upright microscope. Images were captured using a Leica DFC300FX camera and processed for brightness and contrast with NIH ImageJ, in which the same settings were used for all images. Skin sections were photographed with a confocal microscope (Olympus Fluoview FV1000) with identical settings used for all image acquisition. Six- to 10-μm-thick optical sections were captured of superficial nerve bundles.
Sciatic nerve ligations.
Two days after induction of inflammation in the hindpaw, rats were anesthetized deeply with isoflurane. The hair over the back of the thigh was shaved, and blunt dissection was used to separate the hamstring muscle to expose the sciatic nerve. Two tight ligatures were placed around the exposed nerve ∼1 cm apart using sterile 6.0 silk sutures. Rats were anesthetized deeply 24 h later with rat mixture, and sciatic nerves were removed and processed for immunohistochemistry as described above. Quantification of protein trafficking was done using NIH Image J software. Regions of interest (ROIs) were selected as a standard square (2 × 2 mm) centered over the nerve and positioned as close to the top of the first ligature as possible. Mean pixel density within the ROI was use to quantify immunoreactivity. Nerves from naive and inflamed rats were processed in parallel, and images were acquired under identical conditions for subsequent quantification. Three sections per nerve were averaged to obtain a value per rat, and the average value from naive and inflamed rats were compared.
Nociceptive behavior.
The behavioral data were collected in the Rodent Behavior Analysis Core of the University of Pittsburgh Schools of Health Sciences. Inflammation-induced changes in nociceptive behavior were assessed as described previously (Scheff et al., 2014). Rats were habituated to the testing procedure and experimenter for 3 d before the collection of baseline data. The testing apparatus consisted of a row of six clear acrylic enclosures [4 inches (∼10.2 cm) wide, 7 inches (19.4 cm) long, and 5 inches (12.7 cm) high]. Opaque dividers separated the enclosures. On testing days, rats were loaded in their enclosures and given 10 min of habituation before the initiation of data collection. Because rats were not subjected to experimental manipulations beyond the induction of inflammation, it was not possible to collect behavioral data in a blinded manner. Nevertheless, care was taken to apply stimuli in a consistent manner throughout the experiment at the same time of day and by the same experimenter.
An electronic von Frey anesthesiometer (IITC Plantar Test Analgesia Meter 2390; IITC Life Sciences) fitted with a rigid tip (1.0 mm tip diameter) was used to assess changes in mechanical threshold. Rats would stand on anodized aluminum mesh [¼ (6.4 mm) waffle hole], and the tip of the device was applied from below to the glabrous skin of the hindpaw with steady vertical pressure until the rat withdrew from the stimulus or until the paw was lifted off the mesh floor (at ∼70 g). The greatest force generated before withdrawal was recorded. This procedure was repeated three times, and the average of the three measures for each paw was considered the withdrawal threshold for each day of testing.
Changes in heat threshold were assessed in the same group of rats after determination of mechanical threshold with a plantar analgesia meter (IITC Life Sciences). The intensity of the heat lamp was set to produce a withdrawal at a latency of 10 s in naive rats. The heat stimulus was applied three times to each hindpaw at an interval of 5 min, and the average of the three measures was used as the withdrawal latency.
Chemicals and reagents.
DiI was purchased from Invitrogen. Fura-2 AM ester (2.5 mm stock in DMSO) and Pluronic F-127 (0.025% in water) were purchased from TEF Laboratories. KB-R7943 (2-[4-[(4-nitrophenyl)methoxy]phenyl]ethyl ester) was purchased from R&D Systems and was dissolved to 100 mm stock concentration in DMSO (Sigma-Aldrich).
Statistical analysis.
Data are expressed as mean ± SEM. Student's t test was used for simple comparison between two groups. For experiments involving the application of test compounds, vehicle controls were always included. A one-way ANOVA was used to assess the presence of time-dependent changes, and a mixed-design two-way ANOVA was used for analysis of time × treatment effects. The Holm–Sidak test used for post hoc analysis, where p < 0.05 was considered statistically significant.
Results
Ca2+ imaging data were collected from 367 cutaneous DRG neurons dissociated acutely from 44 male Sprague Dawley rats, of which 18 were control and 26 were inflamed. Based on previous results indicating that the inflammation-induced increase in the 4 s, 30 mm KCl (high K+)-evoked Ca2+ transient was primarily manifest in small (<30 μm)-diameter, cutaneous, IB4+, capsaicin-sensitive DRG neurons, this subpopulation was the focus of the present study and is subsequently referred to as a subpopulation of cutaneous putative nociceptive neurons. Consistent with our previous results (Lu and Gold, 2008; Scheff et al., 2013), inflammation was associated with no change in resting Ca2+, which was 120.47 ± 4.09 nm (n = 39) and 125.74 ± 5.88 nm (n = 49) in neurons from naive and inflamed rats, respectively (p > 0.05). However, these was a significant increase in the amplitude, as measured by a change in [Ca2+]i from baseline (260.34 ± 13.3 and 405.62 ± 26.1 nm Ca2+ in neurons from naive and inflamed rats, respectively), and duration, as measured by the time to a 50% decrease from peak (T50) (22.88 ± 1.7 and 53.12 ± 6.5 s for Ca2+ in neurons from naive and inflamed rats, respectively), of the high K+-evoked Ca2+ transient (Fig. 1A).
Figure 1.

The inflammation-induced increase in the amplitude and duration of the evoked Ca2+ transient are only manifest with long-duration stimuli. A, Putative nociceptive cutaneous neurons from naive (gray trace) and inflamed (3 d after CFA injection, black trace) rats were stimulated with 30 mm KCl (high K+), applied for durations ranging between 250 ms and 4 s. B, Pooled data indicate that the amplitude of the evoked Ca2+ transient, as measured by a change from baseline (Δ[Ca2+]i) was significantly greater in neurons (black circles, n = 22) from inflamed rats than that in neurons (white circles, n = 27) from naive rats in response to stimuli ≥500 ms. C, In contrast, the duration of the evoked Ca2+ transient, as measured by T50, was only significantly greater in neurons from inflamed rats, in response to stimuli ≥2 s. *p < 0.05, **p < 0.01.
A parametric experiment using DiI+/IB4+ neurons was used to determine the stimulus duration at which it was possible to detect an inflammation-induced increase in the amplitude and duration of the depolarization-evoked transient. Neurons from naive (n = 24) and inflamed (n = 22) rats were stimulated with high K+, applied for durations ranging between 250 ms and 4 s (Fig. 1A). Analysis of the amplitude (Fig. 1B) and T50 (Fig. 1C) of decay versus the stimulus duration, with a two-way mixed-design ANOVA revealed a significant interaction between inflammation and stimulus duration for both transient amplitude and duration. Post hoc analysis indicated that the difference between naive and inflamed neurons was significant for amplitude with a stimulus duration ≥500 ms and was significant for transient duration with a stimulus duration of ≥2 ms. To determine whether this difference in stimulus duration was significant, we reanalyzed the data from inflamed rats to determine the stimulus duration at which an increase in transient amplitude or duration was >30% of the mean transient amplitude or duration in neurons from naive rats. A 30% increase was chosen because this would be considered a significant increase from baseline. Stimulus duration data were analyzed with a signed rank test, which confirmed that the stimulus duration needed to produce an increase in duration (a median of 1000 ms) was significantly (p < 0.01) longer than that needed to detect an increase in transient amplitude (a median of 250 ms).
Inflammation was associated with a decrease in NCX activity
To determine whether an inflammation-induced decrease in NCX activity may contribute to the increase in the duration of the depolarization-evoked Ca2+ transient, we measured the 4 s high K+ evoked transient duration before and after inhibition of NCX activity using an Na+-free bath in which Na+ was replaced with Li+ (Fig. 2A, left traces) or choline. Consistent with our previous results in unlabeled DRG neurons (Lu et al., 2006) and cutaneous neurons (Scheff et al., 2014), block of NCX resulted in no change in the amplitude but was associated with a significant increase in duration (T50) of the depolarization-evoked transient in neurons from naive rats (Fig. 2A, top left traces). However, in neurons from inflamed rats (Fig. 2A, bottom left traces), NCX block resulted in no detectable change in either the amplitude [387.8 ± 29.6 (n = 35) and 389.3 ± 37.2 before and after 0 Na+ bath, respectively, p < 0.05] or duration [42.5 ± 4.9 (n = 35) and 57.7 ± 8.5 s, respectively, p > 0.05] of the depolarization-evoked Ca2+ transient (Fig. 2B). Although data plotted in Figure 2B were analyzed as a percentage change from baseline in the presence of NCX block, raw data were analyzed with a two-way mixed-design ANOVA. Post hoc analysis confirmed that the difference between naive and inflamed neurons within NCX block was significant for transient duration (p < 0.01) but not amplitude (p > 0.05).
Figure 2.

Inflammation is associated with a loss of NCX activity in putative nociceptive cutaneous neurons. High K+ (30 mm) evoked Ca2+ transients in small-diameter (≤30 μm) retrogradely labeled (DiI+), capsaicin-sensitive (Cap+), IB4+ neurons from naive (gray traces, top) and inflamed (black traces, bottom) rats before and after NCX block with a bath solution in which Na+ was replaced with Li+ (A) or 100 nm KB-R7943 (B). C, Evoked transient data from naive and inflamed rats were analyzed as a percentage change in the amplitude (top) and duration (bottom) in response to NCX block with 0 mm Na+ bath or KB-R7943 (KB-R) replacement. Thirty-six and 34 neurons were studied with 0 mm Na+ from naive and inflamed rats, respectively, whereas 21 and 23 neurons from naive and inflamed rats were studied with KB-R7943, respectively. The inset describes the results from the analysis of transient data before and after NCX block in neurons from naive and inflamed rats with a two-way mixed-design ANOVA.
The absence of an increase in the duration of the depolarization-evoked Ca2+ transient in the presence of 0 mm Na+ in the bath is consistent with a loss of NCX activity in neurons from inflamed rats. To confirm the apparent loss of NCX activity with inflammation, two additional experiments were performed. In the first, we tested the efficacy of the relatively NCX3-selective blocker KB-R7943 on neurons from naive and inflamed rats (Fig. 2A, right traces) based on previous data suggesting that NCX3 underlies the majority of NCX activity in this subpopulation of sensory neurons (Scheff et al., 2014). In neurons from naive rats, 100 nm KB-R7943 significantly prolonged the duration of the transient 237.2 ± 46.7% (p < 0.05; Fig. 2B). However, consistent with results using 0 mm Na+ bath, KB-R7943 had no detectable influence on the duration of the depolarization-evoked Ca2+ transient (5.1 ± 0.23%, p > 0.05) in neurons from CFA-treated rats (Fig. 2B).
In the second set of experiments, we sought to directly measure the inward current generated from NCX activity in neurons from naive and CFA-treated rats. The gramicidin perforated patch configuration was used for whole-cell voltage-clamp recording to simultaneously assess changes in membrane current and [Ca2+]i with fura-2 AM imaging. A 4 s depolarization to 0 mV was used to evoke Ca2+ influx and, consequently, a Ca2+ transient. We have demonstrated previously that the transient evoked with this stimulus is similar in amplitude and duration to that evoked with 4 s application of high K+ (Scheff et al., 2014). At membrane potentials negative to approximately −26 mV in the presence of 130 mm [Na+]o and ≥325 nm [Ca2+]i, the exchanger is in Ca2+ efflux mode transporting 3 Na+ in for each Ca2+ extruded out at a rate thought to be ∼5000 ions s−1 (DiPolo and Beaugé, 2006). Therefore, inhibition of exchange activity with the application of 0 mm Na+ bath should result in the block of the NCX-mediated inward current. There was no detectable change in membrane current or [Ca2+]i in response to a 4 s application of 0 mm Na+ bath before evoking a Ca2+ transient in any of the 12 putative nociceptive cutaneous neurons tested (Fig. 3A,B). However, after the voltage step to 0 mV, 4 s application of 0 mm Na+ bath resulted in a decrease in inward current, the amplitude of which decreased in association with the decay of the depolarization-evoked Ca2+ transient (Fig. 3A). Pooled data from six neurons from naive rats indicated that, just after the peak of the depolarization-evoked Ca2+ transient, associated with a [Ca2+]i of 223.61 ± 9.5 nm, the 0 mm Na+ bath-sensitive current was 28.73 ± 1.8 pA (Fig. 3C). Despite the fact that the depolarization-evoked transient in neurons from inflamed rats (352.72 ± 27.9 nm, n = 6) was significantly (p < 0.01) larger than that of neurons from naive rats, the 0 mm Na+ bath-sensitive current was significantly smaller in these neurons (5.10 ± 1.88 pA, p < 0.05; Fig. 3C), consistent with an inflammation-induced loss in NCX activity in the isolated cell body.
Figure 3.

Inflammation-induced decrease in NCX current. A combination of perforated patch recording and Ca2+ imaging was used to assess the Ca2+ transient (top trace) evoked in response to a 4 s voltage step to 0 mV in a neuron from a naive rat (A) and from a rat 3 d after CFA (B). The Ca2+ current (bottom trace) resulted in an increase in 0 mm Na+-sensitive current (inset), which decreased in association with the decay of the Ca2+ transient. C, Pooled peak 0 mm Na+-sensitive current data from neurons (n = 6 in each group) from naive and inflamed rats. **p < 0.01.
Time course of inflammation-induced changes in NCX activity
To begin to explore both the basis for the inflammation-induced decrease in NCX activity in putative nociceptive neurons and whether these changes might contribute to the onset or resolution of the inflammatory response, we assessed the time course of the inflammation-induced changes in NCX activity. To correlate changes in Ca2+ regulation with changes the inflammation-induced thermal and mechanical sensitivity, we first assessed the time course of inflammation-induced changes in nociceptive behavior. A significant decrease in both mechanical (p < 0.01; Fig. 4A) and thermal (p < 0.01; data not shown) threshold was fully manifest by 24 h after the injection of CFA, was relatively stable for up to 72 h after CFA, and then returned to baseline over the subsequent 4–10 d. Data were analyzed with a one-way repeated-measures ANOVA with post hoc comparisons with baseline nociceptive threshold.
Figure 4.

Time-dependent changes in nociceptive behavior and the evoked Ca2+ transient. A, The inflammation-induced decrease in nociceptive mechanical threshold was manifest in the paw ipsilateral (Inflamed, black circles) but not contralateral (Contra, gray circles) to the CFA injection (black arrow). n = 8 per group. B, The time course of inflammation-induced increase in the depolarization-evoked Ca2+ transient amplitude (top) and duration (bottom). Post hoc comparisons were made with naive rats (day 0). C, As shown in Figure 2, block of NCX with 0 mm Na+ bath, plotted as a percentage change from the transient evoked before NCX block (normal bath), had no influence on the amplitude of the evoked transient (squares) but increased the duration of the evoked transient (circles) in neurons from naive rats (white symbols). Although there was no detectable change in the effect of NCX block on the amplitude of the evoked transient at any time after the induction of inflammation, the increase in transient duration was completely occluded 2 and 3 d after CFA. Post hoc comparisons were made with naive rats (day 0). The number of neurons per group in B and C were as follows: Day 0, n = 29; Day 1, n = 22; Day 2, n = 17; Day 3, n = 29; Day 7, n = 37; and Day 14, n = 24. *p < 0.05, **p < 0.01.
Our initial assessment of the inflammation-induced changes in the depolarization-evoked Ca2+ transient and NCX activity used neurons harvested 72 h after the injection of CFA. Therefore, we assessed the onset of changes in neurons harvested 24 and 48 h after the induction of inflammation and resolution at 7 and 14 d after the induction of inflammation. These data were also analyzed with a one-way repeated-measures ANOVA with post hoc comparisons with naive neurons. Results of this analysis indicate that a significant increase in the amplitude of the depolarization-evoked Ca2+ transient was detectable at 48 h, peaked at 72 h after CFA, and was still significantly elevated at 14 d after CFA (Fig. 4B). In contrast, the inflammation-induced increase in depolarization-evoked Ca2+ transient duration peaked at 48 h after CFA and had resolved by 7 d after CFA (Fig. 4B). To determine whether the time course of the changes in transient amplitude and duration were significantly different, we determined the proportion of neurons at each day after CFA injection in which the transient amplitude or duration was more than two times the SD of the transient in naive neurons. These data were analyzed with a χ2 test, the results of which confirmed that there was a significant difference between transient amplitude and duration with respect to the proportion of neurons in which these parameters were elevated across days.
The inflammation-induced loss of NCX activity followed the same trajectory as the increase in evoked-transient duration, with a significant decrease in the effect of Li+ bath on the Ca2+ transient duration that peaked at 48 h. Analyzed as a percentage change from the transient evoked in normal bath, repeated-measures one-way ANOVA with post hoc comparisons with naive rats indicated that there was still a significant decrease in the effect of Li+ bath on day 7 (Fig. 4C). Because the inflammation-induced increase in transient duration had fully resolved by this time point, the persistent decrease in NCX activity suggests that other mechanisms may contribute to the normalization of the depolarization-evoked Ca2+ transient duration. Consistent with results obtained in neurons from naive rats and 72 h after CFA injection, there was no detectable influence of Li+ on the amplitude of the depolarization-evoked Ca2+ transient at any other time point assessed after inflammation (Fig. 4C).
Inflammation-induced increase in trafficking of NCX3
To explore the basis for the inflammation-induced decrease in NCX activity, we first assessed the influence of inflammation on the expression levels of NCX isoforms in DRG. Negative results from this experiment should be viewed with caution because the inflammation-induced change in NCX activity is only present in a subset of neurons that innervate the site of inflammation, which are a subpopulation of the total cells in the L4 and L5 DRGs (that give rise to the innervation of the hindpaw). Nevertheless, because others have detected inflammation-induced increases (Lu et al., 2010; DeBerry et al., 2014) and decreases (Zhang et al., 1998; Marsh et al., 2012) in the expression of a number of different molecules, we felt it was still worth assessing changes in NCX expression. However, despite a significant decrease in NCX activity, mRNA extracted from L4–L5 DRGs harvested from naive (n = 8) and 3 d CFA-treated (n = 7) rats revealed no detectable change the expression of any of the three NCX isoforms (Fig. 5A).
Figure 5.

Inflammation was associated with a decrease in NCX protein but not mRNA. A, Semiquantitative RT-PCR was used to screen for changes in NCX1, NCX2, and NCX3 mRNA extracted from whole L4 and L5 DRGs. The fold change in NCX isoform in inflamed rats (n = 4) relative to that in naive (n = 4) was assessed relative to that of GAPDH. B, Western blot analysis of inflammation (CFA)-induced changes in NCX isoforms in total protein extracted from L4 and L5 DRGs. Pooled data for inflamed rats (n = 6) are plotted as a percentage change from the average band intensity in naive rats (n = 3), in which only the 120 and 70 kDa band for NCX1 and NCX3, respectively, were included in the analysis. *p < 0.05, significant decrease from the protein levels in DRGs from naive rats as determined with post hoc analysis.
Next, because mRNA levels do not directly reflect protein density, we assessed the effect of inflammation on NCX isoform protein extracted from L4–L5 DRGs harvested from naive (n = 4) and 3 d CFA-treated (n = 4) rats. NCX isoform-like immunoreactivity (LI) normalized to the loading control (GAPDH) from naive and inflamed rats was analyzed with a two-way ANOVA. Results of this analysis revealed a significant interaction between NCX isoform and inflammation, in which post hoc analysis confirmed that this was attributable to a significant (p < 0.05) inflammation-induced decrease in NCX3 relative to levels in naive rats, which was not significant for NCX1 or NCX2 (Fig. 5B). To clearly illustrate these differences, data in Figure 5B are plotted as a percentage of naive.
We have demonstrated recently that NCX3 is the isoform primarily responsible for NCX activity in putative nociceptive DRG neurons (Scheff et al., 2014). Furthermore, pharmacological results of the present study suggest that a decrease in NCX3 accounts for the inflammation-induced decrease in NCX activity. Therefore, we focused on NCX3 in an expanded analysis of the inflammation-induced changes in NCX protein in which we determined both the time course of the changes and whether the decrease was uniform throughout the sensory neuron. Protein was extracted from approximately the first centimeter of the nerve root extending centrally from the L4–L5 DRGs to the spinal cord (central root), corresponding DRGs, and ∼1 cm of the sciatic nerve proximal to trifurcation, from groups of rats with no inflammation (naive) and 1, 3, 7, and 14 d after the induction of inflammation. Data were normalized to GAPDH, pooled, and analyzed with a one-way repeated-measures ANOVA, with post hoc comparisons made to naive. To more clearly illustrate the pattern of changes in each tissue over time, pooled data are plotted as a percentage change from naive. Results of this analysis indicated that changes over time in NCX3 protein in the DRGs mirror that of the inflammation-induced decrease in NCX activity observed in isolated putative nociceptive DRG neurons, with a decrease that peaks at day 3 after CFA. In contrast to the inflammation-induced changes in NCX activity that appear to parallel the inflammation-induced decrease in nociceptive threshold (Fig. 4), the significant (p < 0.01) decrease in NCX protein in the L4–L5 DRGs observed 3 d after CFA injury, rebounded by 7 d such that total NCX protein in the DRGs was significantly (p < 0.05) higher that baseline levels (Fig. 6A). Additionally, there is a robust inflammation-induced increase in NCX3 protein in the sciatic nerve that peaked at day 3 after CFA that resolved by day 7 after CFA (p < 0.01; Fig. 6B). Interestingly, there was no inflammation-induced change in NCX3 in the central root (p > 0.05; Fig. 6C). This loss of protein in the ganglia and increase in the peripheral nerve only, near the peak of inflammation-induced loss of NCX activity, is suggestive of differential trafficking.
Figure 6.
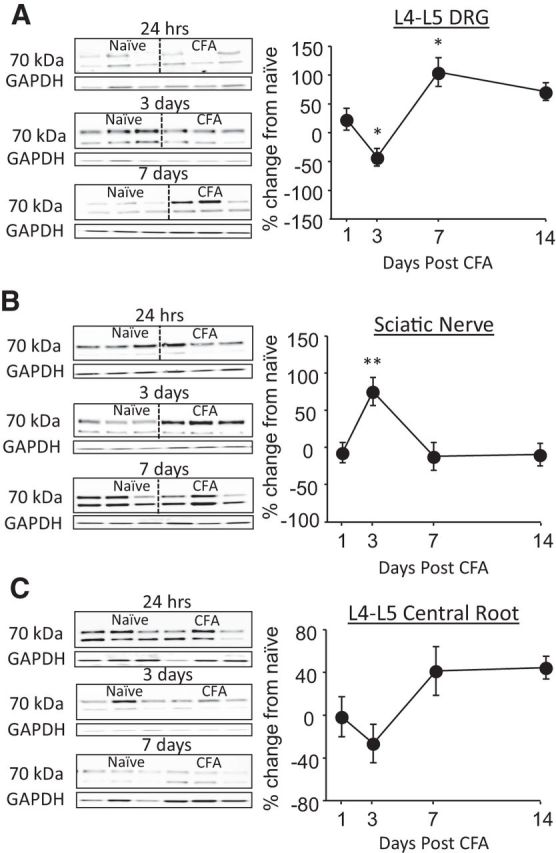
Time-dependent changes in NCX3 protein at three major sites in the nerve. Western blot analysis of total protein extracted from the L4–L5 DRGs (A), sciatic nerve (B), and central root (C) at 1, 3, 7, and 14 d after the induction of inflammation with subcutaneous injection of CFA. Data were first normalized with respect to GAPDH and then plotted as a percentage change from naive. Typical blots from rats treated with CFA after 1, 3, and 7 are shown. Pooled data are from three rats per time point. *p < 0.05, **p < 0.01, significant differences from the protein levels in tissue from naive rats as determined by post hoc analysis.
To further test the hypothesis that the changes in NCX3 in the DRGs and sciatic nerve were attributable to a change in trafficking of the exchanger, we used a dual ligation of the sciatic nerve ipsilateral to the site of CFA injection to clearly differentiate trafficked protein from that synthesized locally. Ligatures were placed on the sciatic nerve of naive rats (n = 4) or on that of rats (n = 4) 48 h after the induction of inflammation. The nerves were removed 24 h after ligation and processed for immunohistochemical analysis. The ligation alone did not produce any detectable changes in NCX3-LI (Fig. 7A). However, in the presence of inflammation, there was a robust increase in NCX3-LI proximal to the first ligature (Fig. 7B). Pooled data confirm that the NCX3-LI proximal to the ligature was significantly greater in nerves from inflamed rats than that in nerves from naive controls (p < 0.01; Fig. 7C).
Figure 7.

Inflammation-induced increase in NCX3 trafficking to the periphery. Immunohistochemical analysis of NCX3-LI in the sciatic nerve from a naive rat (A) or from a rat 3 d after the induction of inflammation with CFA (B). Low-powered micrographs (4× magnification, left) illustrate the double ligature sites. Higher-powered micrographs (10× magnification, right) are of the proximal ligature site. Ligatures were placed 24 h before tissue harvest. Scale bars, 200 μm. C, Pooled densitometry data were collected from the nerve in the regions indicated on the photomicrograph just proximal to the first ligature (anterograde) and just distal to the second ligature (retrograde) from naive (Ctrl, n = 4) and inflamed (CFA, n = 4) rats. **p < 0.01, significant difference from control.
Inflammation-induced increase in NCX3 in glabrous skin
Finally, to determine whether NCX3 protein was shipped to the terminals innervating the site of injury, Western blot analysis was done to assess changes in NCX3 protein in the inflamed glabrous skin at 1, 3, 7, and 14 d after the CFA injection. Data were analyzed as a one-way repeated-measures ANOVA, with post hoc comparisons made to protein levels in naive rats. Data are plotted as a percentage change from naive (Fig. 8A). Results from this analysis revealed an increase in NCX3 in the skin from rats that was significant by 3 d after the induction of inflammation, and it remained significantly elevated 14 d out (p < 0.01; Fig. 8A). To confirm that the inflammation-induced increase in NCX3 protein was attributable to an increase in the nerve and not infiltrating monocytes thought to also express NCX3 (Boscia et al., 2013; Staiano et al., 2013), we assessed changes in monocyte protein in the inflamed glabrous skin with Western blots probed with a CD68 antibody at 1, 3, 7, and 14 d after the CFA injection. Data were analyzed and plotted as described for NCX3 in the skin. Results of this analysis indicated that the inflammation-induced increase in CD68-LI was significant at 1 and 3 d after CFA injection but returned to baseline by 7 d after CFA injection. The differences in the time course of NCX3 and CD68 levels suggest that the inflammation-induced increase in NCX3 in the skin is not attributable to infiltrating monocytes and macrophages.
Figure 8.

Inflammation-induced increase in NCX3 and immune cells at the site of inflammation. A, Top, Representative blots of total protein probed with antibodies against NCX3 (left) and CD68 (macrophage/monocyte marker; right) at 1, 3, 7, and 14 d after the induction of inflammation with subcutaneous injection of CFA. To control for the potential influence of inflammation-induced sprouting of peripheral nerve terminals, the neural marker PGP 9.5 was used as a loading control for NCX, whereas GAPDH was used as a loading control for CD68. Each lane was loaded with protein from one rat. Bottom, Pooled data analyzed as a percentage change from naive are plotted for each day after CFA injection. *p < 0.05, **p < 0.01 for NCX3 (black circles) and #p < 0.05 for CD68 (white boxes), significant differences from naive, as determined from post hoc analyses. Data are from an n = 4 for each time point except Day 3, in which n = 8. B, Confocal photomicrographs (20× magnification) of glabrous skin probed with antibodies against NCX3 (left, green) and CD68 (middle, red) from naive rats (top) and from rats 1, 3, 7, and 14 d after CFA injection. The right is the merged NCX and CD68 images. Scale bars, 100 μm.
To explore the basis for the increase in NCX3 protein in the skin, the distribution of NCX3-LI was assessed in situ. Latitudinal sections of hindpaw skin from naive rats and rats 1, 3, 7, and 14 d after CFA injection were costained with antibodies against NCX3 and CD68. Consistent with the Western blot analysis, there was a rapid and robust increase in CD68-LI in the skin after CFA that was resolving by day 7 after injection (Fig. 8B), and although there appeared to be non-neural sources of NCX3-LI in the skin, marked increases in neural NCX3 were clearly detectable (Fig. 8B).
Discussion
The purpose of the present study was to test the hypothesis that a decrease in NCX activity contributes to the inflammation-induced increase in the duration of the depolarization-evoked Ca2+ transient in putative nociceptive cutaneous DRG neurons. Consistent with our previous results (Lu and Gold, 2008), inflammation was associated with an increase in both the amplitude and duration of the depolarization-evoked Ca2+ transient in the IB4+ subset of putative nociceptive cutaneous neurons. Also, consistent with previous results, block of NCX in this subpopulation of neurons from naive rats resulted in a significant increase in the duration of the depolarization-evoked Ca2+ transient (Scheff et al., 2014). However, in neurons harvested from rats 3 d after the induction of inflammation, NCX block had no detectable influence on the duration of the depolarization-evoked Ca2+ transient. Comparable data were obtained with electrophysiological analysis of NCX current in this population of neurons. These changes developed over the first 3 d after the induction of inflammation and resolved over the subsequent 4–10 d. This trajectory mirrored the changes in CFA-induced nociceptive behavior. The decrease in NCX activity was not associated with a detectable change in NCX mRNA levels. However, it was associated with a significant decrease in NCX3, but not NCX1 or NCX2, protein in the cell body and an increase in NCX3 protein in the sciatic nerve. Sciatic nerve ligation at 48 h after induction of inflammation resulted in a buildup of NCX3-LI proximal to the ligation site. Finally, there was a significant increase in NCX3-LI in the glabrous skin ipsilateral to CFA injection. These results are consistent with our initial hypothesis and suggest that the decrease in NCX activity observed in the cell body is attributable to an increase in the trafficking of NCX3 to the site of inflammation.
Results from the stimulus-duration experiment indicated that mechanisms underlying the increase in the duration of the depolarization-evoked Ca2+ transient had a high threshold for activation, requiring at least 2 s of depolarization. These results were consistent with a decrease in NCX activity as a mechanism for the inflammation-induced increase in transient duration because NCX has been shown to be a low-affinity Ca2+ extrusion mechanism. Furthermore, these results argue against a role of PMCA because it is a higher-affinity protein thought to mediate Ca2+ homeostasis that should be revealed, if not at rest, than with a much shorter stimulus duration (Gemes et al., 2012).
Although the initial decrease in NCX activity and protein in the cell body could be attributable to an undetected increase in expression or protein turnover, the most likely explanation, protein trafficking, is well supported by the increase in protein in the sciatic nerve at 3 d after CFA and the increase in NCX3-LI in the ligation experiment. These results demonstrated that the increase in NCX3 was in the nerve and not attributable to an infiltration of immune cells in NCX3 (Boscia et al., 2013; Staiano et al., 2013). This conclusion was further supported by Western blot and immunohistochemical analysis of the glabrous skin, which confirmed that an increase in NCX3-LI in the skin was attributable, as least in part, to an increase in NCX3 in the peripheral nerve. However, the increase in NCX3 protein in the cell body at 7 d after CFA injection in the absence of a detectable change in NCX activity in the isolated cell body suggests that the increase in protein does not necessarily reflect functional protein. Instead, we propose that NCX activity in the cell body is relatively tightly regulated, with spare protein ready to be trafficked if needed.
Results of the present study indicate that the inflammation-induced increase in the depolarization-evoked Ca2+ transient reflects changes in at least two distinct Ca2+ regulatory processes. That is, although the increase in transient duration reflects a decrease in NCX activity, the increase in amplitude must reflect another mechanism. The two components of the Ca2+ transient were dissociable on multiple levels, including the stimulus duration required to detect an inflammation-induced increase. Interestingly, the mechanism(s) underlying the increase in amplitude are manifest in the face of a decrease in VGCC current density (Lu et al., 2010). This implies a shift in coupling between the initial depolarization-induced Ca2+ influx via VGCCs and an amplification system that ultimately influences the transient amplitude. Although ryanodine receptor-mediated Ca2+-induced Ca2+ release is a well described transient amplification system (Berridge, 2006), we were unable to implicate this system as a mechanism of the inflammation-induced increase in the amplitude (Scheff et al., 2013). Furthermore, with evidence against a change in mitochondrial Ca2+ buffering (Scheff et al., 2013), we are left suggesting that far less conventional mechanisms may ultimately be responsible for the increase in amplitude. One such mechanism includes the sensitization of channels typically activated by exogenous stimuli, such as ligand-gated transient receptor potential vanilloid 1 (TRPV1) or ankyrin 1 receptors. TRPV1 in particular demonstrates some voltage dependence (Matta and Ahern, 2007) and is both upregulated and sensitized in the presence of inflammation (Julius, 2013). Thus, a depolarization-induced recruitment of TRPV1 could contribute to the inflammation-induced increase in the amplitude of the depolarization-evoked transient.
The observation that there were differences between transient amplitude and duration with respect to the trajectory of the inflammation-induced changes in these parameters lends additional support to the suggestion that distinct mechanisms underlie these two changes. However, more interesting is that the significant increase in duration of the depolarization-evoked transient fully recovered at a time point at which rats were still quite hypersensitive. This separation was also reflected in protein levels, in which the significant decrease in NCX3 protein in the DRGs was only detectable on day 3 after CFA. This suggests that the change in NCX might be more relevant for the initiation and initial maintenance and not the resolution of inflammatory hypersensitivity.
It was striking that, despite a relatively complete loss of NCX activity in neurons from CFA-treated rats, the duration of the depolarization-evoked Ca2+ transient in the presence of inflammation was shorter than that observed after block of NCX activity in neurons from naive rats with 0 mm Na+ bath or KB-R7943. This mismatch underscores the complexity of Ca2+ regulatory processes in which even a small shift in the relative distribution of Ca2+ regulatory mechanisms can have a profound influence on the properties of the depolarization-evoked transient. In previous studies, we attempted to determine the contribution of specific Ca2+ regulatory mechanisms to the inflammation-induced increase in the depolarization-evoked Ca2+ transient through assessment of individual components of the Ca2+ signaling toolkit. However, because the individual components of the toolkit do not function in isolation, the net change in the evoked Ca2+ transient will not only reflect the loss of NCX and/or the mechanisms underlying the increase in the amplitude but also the interaction between the two. Furthermore, given evidence that a prolonged release of Ca2+ from the endoplasmic reticulum engages a Ca2+ extrusion mechanisms in putative nociceptive DRG neurons from inflamed but not naive rats (Scheff et al., 2013), it is also possible that the shift in the relative balance of mechanisms underlying the change in amplitude and duration could engage other regulatory proteins not normally involved in depolarization-evoked Ca2+ regulation.
Ultimately, the physiological effect of the inflammation-induced increase in NCX trafficking depends on NCX function in the terminals and cell body. A decrease in exchanger activity at the cell body results in a change in the duration of the depolarization-evoked transient. Given evidence that Ca2+ is the integrator underlying activity-dependent changes in gene expression (Fields et al., 2005), a change in the properties of the depolarization-evoked Ca2+ transient should result in a change in gene expression. The trend toward the decrease in NCX3 in the central terminals should, if anything, result in an increase in transmitter release from the central terminals. Although there is no direct evidence of NCX-mediated regulation of neurotransmitter release to date, as many have speculated (Blaustein and Lederer, 1999; Jeon et al., 2003; Khananshvili, 2013), we hypothesized that this was the most likely explanation for the hyperalgesia observed after siRNA-induced knockdown of NCX3 (Scheff et al., 2014). In contrast, the increase in NCX in peripheral terminals should result in a decrease in transmitter release. Although peptidergic fibers are generally considered in the context of peripheral transmitter release and neurogenic inflammation, there is growing evidence for functional glutamate receptors in the periphery that may be either pro-nociceptive or anti-nociceptive (Miller et al., 2011). Alternatively, a decrease in the duration of depolarization-evoked Ca2+ transients in the periphery as a result of the increase in NCX activity may influence the excitability of the peripheral endings. For example, a decrease in Ca2+-dependent K+ channel activity should result in an increase in excitability, whereas a decrease in Ca2+-dependent Cl− channel activity should result in a decrease in excitability. Thus, this single response to inflammation is associated with changes in at least three different segments of the primary afferent, all of which are likely to contribute to the dynamic response to persistent inflammation.
Footnotes
This work is supported by National Institutes of Health Grants F31-NS08466 (N.N.S.) and 1R01DE018252 (M.S.G.) and the Virginia Kaufman Endowment Fund No. 1. We thank Drs. Ken Philipson and Michela Ottolia at the Cedars-Sinai Heart Institute for the very generous supply of NCX antibodies. We thank Parthasarathy Kesavaramanujam and Sonali Joyce for their expert technical assistance. We also thank Drs. Gerald Gebhart, Brian Davis, Steve Meriney, and William de Groat for their assistance and constructive feedback during the preparation of this manuscript.
The authors declare no competing financial interests.
References
- Berridge MJ. Calcium microdomains: organization and function. Cell Calcium. 2006;40:405–412. doi: 10.1016/j.ceca.2006.09.002. [DOI] [PubMed] [Google Scholar]
- Berridge MJ, Lipp P, Bootman MD. The versatility and universality of calcium signalling. Nat Rev Mol Cell Biol. 2000;1:11–21. doi: 10.1038/35036035. [DOI] [PubMed] [Google Scholar]
- Blaustein MP, Lederer WJ. Sodium/calcium exchange: its physiological implications. Physiol Rev. 1999;79:763–854. doi: 10.1152/physrev.1999.79.3.763. [DOI] [PubMed] [Google Scholar]
- Boscia F, D'Avanzo C, Pannaccione A, Secondo A, Casamassa A, Formisano L, Guida N, Scorziello A, Di Renzo G, Annunziato L. New roles of NCX in glial cells: activation of microglia in ischemia and differentiation of oligodendrocytes. Adv Exp Med Biol. 2013;961:307–316. doi: 10.1007/978-1-4614-4756-6_26. [DOI] [PubMed] [Google Scholar]
- Cook O, Low W, Rahamimoff H. Membrane topology of the rat brain Na+-Ca2+ exchanger. Biochim Biophys Acta. 1998;1371:40–52. doi: 10.1016/S0005-2736(97)00272-1. [DOI] [PubMed] [Google Scholar]
- DeBerry JJ, Schwartz ES, Davis BM. TRPA1 mediates bladder hyperalgesia in a mouse model of cystitis. Pain. 2014;155:1280–1287. doi: 10.1016/j.pain.2014.03.023. [DOI] [PMC free article] [PubMed] [Google Scholar]
- DiPolo R, Beaugé L. Sodium/calcium exchanger: influence of metabolic regulation on ion carrier interactions. Physiol Rev. 2006;86:155–203. doi: 10.1152/physrev.00018.2005. [DOI] [PubMed] [Google Scholar]
- Fields RD, Lee PR, Cohen JE. Temporal integration of intracellular Ca2+ signaling networks in regulating gene expression by action potentials. Cell Calcium. 2005;37:433–442. doi: 10.1016/j.ceca.2005.01.011. [DOI] [PubMed] [Google Scholar]
- Flake NM, Gold MS. Inflammation alters sodium currents and excitability of temporomandibular joint afferents. Neurosci Lett. 2005;384:294–299. doi: 10.1016/j.neulet.2005.04.091. [DOI] [PubMed] [Google Scholar]
- Gemes G, Oyster KD, Pan B, Wu HE, Bangaru ML, Tang Q, Hogan QH. Painful nerve injury increases plasma membrane Ca2+-ATPase activity in axotomized sensory neurons. Mol Pain. 2012;8:46. doi: 10.1186/1744-8069-8-46. [DOI] [PMC free article] [PubMed] [Google Scholar]
- Grynkiewicz G, Poenie M, Tsien RY. A new generation of Ca2+ indicators with greatly improved fluorescence properties. J Biol Chem. 1985;260:3440–3450. [PubMed] [Google Scholar]
- Jeon D, Yang YM, Jeong MJ, Philipson KD, Rhim H, Shin HS. Enhanced learning and memory in mice lacking Na+/Ca2+ exchanger 2. Neuron. 2003;38:965–976. doi: 10.1016/S0896-6273(03)00334-9. [DOI] [PubMed] [Google Scholar]
- Julius D. TRP channels and pain. Annu Rev Cell Dev Biol. 2013;29:355–384. doi: 10.1146/annurev-cellbio-101011-155833. [DOI] [PubMed] [Google Scholar]
- Khananshvili D. The SLC8 gene family of sodium-calcium exchangers (NCX)—structure, function, and regulation in health and disease. Mol Aspects Med. 2013;34:220–235. doi: 10.1016/j.mam.2012.07.003. [DOI] [PubMed] [Google Scholar]
- Lu SG, Gold MS. Inflammation-induced increase in evoked calcium transients in subpopulations of rat dorsal root ganglion neurons. Neuroscience. 2008;153:279–288. doi: 10.1016/j.neuroscience.2008.02.006. [DOI] [PMC free article] [PubMed] [Google Scholar]
- Lu SG, Zhang X, Gold MS. Intracellular calcium regulation among subpopulations of rat dorsal root ganglion neurons. J Physiol. 2006;577:169–190. doi: 10.1113/jphysiol.2006.116418. [DOI] [PMC free article] [PubMed] [Google Scholar]
- Lu SG, Zhang XL, Luo ZD, Gold MS. Persistent inflammation alters the density and distribution of voltage-activated calcium channels in subpopulations of rat cutaneous DRG neurons. Pain. 2010;151:633–643. doi: 10.1016/j.pain.2010.08.030. [DOI] [PMC free article] [PubMed] [Google Scholar]
- Marsh B, Acosta C, Djouhri L, Lawson SN. Leak K(+) channel mRNAs in dorsal root ganglia: relation to inflammation and spontaneous pain behaviour. Mol Cell Neurosci. 2012;49:375–386. doi: 10.1016/j.mcn.2012.01.002. [DOI] [PMC free article] [PubMed] [Google Scholar]
- Matta JA, Ahern GP. Voltage is a partial activator of rat thermosensitive TRP channels. J Physiol. 2007;585:469–482. doi: 10.1113/jphysiol.2007.144287. [DOI] [PMC free article] [PubMed] [Google Scholar]
- Miller KE, Hoffman EM, Sutharshan M, Schechter R. Glutamate pharmacology and metabolism in peripheral primary afferents: physiological and pathophysiological mechanisms. Pharmacol Ther. 2011;130:283–309. doi: 10.1016/j.pharmthera.2011.01.005. [DOI] [PMC free article] [PubMed] [Google Scholar]
- Papa M, Canitano A, Boscia F, Castaldo P, Sellitti S, Porzig H, Taglialatela M, Annunziato L. Differential expression of the Na+-Ca2+ exchanger transcripts and proteins in rat brain regions. J Comp Neurol. 2003;461:31–48. doi: 10.1002/cne.10665. [DOI] [PubMed] [Google Scholar]
- Scheff NN, Lu SG, Gold MS. Contribution of endoplasmic reticulum Ca(2+) regulatory mechanisms to the inflammation-induced increase in the evoked Ca(2+) transient in rat cutaneous dorsal root ganglion neurons. Cell Calcium. 2013;54:46–56. doi: 10.1016/j.ceca.2013.04.002. [DOI] [PMC free article] [PubMed] [Google Scholar]
- Scheff NN, Yilmaz E, Gold MS. The properties, distribution, and function of Na+/Ca2+ exchanger isoforms in rat cutaneous sensory neurons. J Physiol. 2014;592:4969–4993. doi: 10.1113/jphysiol.2014.278036. [DOI] [PMC free article] [PubMed] [Google Scholar]
- Staiano RI, Granata F, Secondo A, Petraroli A, Loffredo S, Annunziato L, Triggiani M, Marone G. Human macrophages and monocytes express functional Na(+)/Ca(2+) exchangers 1 and 3. Adv Exp Med Biol. 2013;961:317–326. doi: 10.1007/978-1-4614-4756-6_27. [DOI] [PubMed] [Google Scholar]
- Tajima Y, Ono K, Akaike N. Perforated patch-clamp recording in cardiac myocytes using cation-selective ionophore gramicidin. Am J Physiol. 1996;271:C524–C532. doi: 10.1152/ajpcell.1996.271.2.C524. [DOI] [PubMed] [Google Scholar]
- Thurneysen T, Nicoll DA, Philipson KD, Porzig H. Sodium/calcium exchanger subtypes NCX1, NCX2 and NCX3 show cell-specific expression in rat hippocampus cultures. Brain Res Mol Brain Res. 2002;107:145–156. doi: 10.1016/S0169-328X(02)00461-8. [DOI] [PubMed] [Google Scholar]
- Wanaverbecq N, Marsh SJ, Al-Qatari M, Brown DA. The plasma membrane calcium-ATPase as a major mechanism for intracellular calcium regulation in neurones from the rat superior cervical ganglion. J Physiol. 2003;550:83–101. doi: 10.1113/jphysiol.2002.035782. [DOI] [PMC free article] [PubMed] [Google Scholar]
- Zhang XL, Mok LP, Lee KY, Charbonnet M, Gold MS. Inflammation-induced changes in BK(Ca) currents in cutaneous dorsal root ganglion neurons from the adult rat. Mol Pain. 2012;8:37. doi: 10.1186/1744-8069-8-37. [DOI] [PMC free article] [PubMed] [Google Scholar]
- Zhang X, Xu ZO, Shi TJ, Landry M, Holmberg K, Ju G, Tong YG, Bao L, Cheng XP, Wiesenfeld-Hallin Z, Lozano A, Dostrovsky J, Hökfelt T. Regulation of expression of galanin and galanin receptors in dorsal root ganglia and spinal cord after axotomy and inflammation. Ann N Y Acad Sci. 1998;863:402–413. doi: 10.1111/j.1749-6632.1998.tb10710.x. [DOI] [PubMed] [Google Scholar]