

Abstract
In day‐to‐day life, we need to apply strategies to cascade different actions for efficient unfolding of behavior. While deficits in action cascading are examined extensively, almost nothing is known about the neuronal mechanisms mediating superior performance above the normal level. To examine this question, we investigate action control in airplane pilot trainees. We use a stop‐change paradigm that is able to estimate the efficiency of action cascading on the basis of mathematical constraints. Behavioral and EEG data is analyzed along these constraints and integrated with neurochemical data obtained using Magnetic Resonance Spectroscopy (MRS) from the striatal gamma‐aminobutyric acid (GABA) ‐ergic system. We show that high performance in action cascading, as exemplified in airplane pilot trainees, can be driven by intensified attentional processes, circumventing response selection processes. The results indicate that the efficiency of action cascading and hence the speed of responding as well as attentional gating functions are modulated by striatal GABA and Glutamate + Glutamine concentrations. In superior performance in action cascading similar increases in the concentrations of GABA and Glutamate + Glutamine lead to stronger neurophysiological and behavioral effects as compared to subjects with normal performance in action cascading. Hum Brain Mapp 35:5040–5051, 2014. © 2014 Wiley Periodicals, Inc.
Keywords: magnetic resonance spectroscopy (MRS), EEG, action control, attention, action cascading
INTRODUCTION
Many little boys dream of becoming an airplane pilot, however, only a few of them have the chance to fulfill their dream. One reason is that prospective airplane pilot trainees (APTs) undergo an extensive assessment of cognitive performance to ensure that they are able to cope with the multiple demands in a cockpit, especially in case of emergency [for review: Borghini et al., 2012]. Currently, knowledge about the neuronal mechanisms underlying action control is acquired through the examination of neurological disorders. However, almost nothing is known about the neuronal mechanisms mediating superior performance above the normal level. APTs may reflect a possible model to examine which neurophysiological and neurobiochemical processes underlie superior performance in action control.
When faced with multiple response options it is necessary to prioritize and cascade different actions [Mückschel et al., 2013]. Previous results from cognitive psychology suggest that in situations requiring a prioritization and chaining of actions, responses can be selected along a continuum from a more serial to a more parallel mode [e.g., Miller et al., 2009; Mückschel et al., 2013; Oberauer and Kliegel, 2004; Verbruggen et al., 2008] and therefore in a strategic nature that differ in efficiency [Meyer and Kieras, 1997]. In the serial mode action selection is performed in a step‐by‐step fashion, while in the parallel mode actions are activated in an overlapping manner, i.e., one action is activated before a previous one is terminated [Verbruggen et al., 2008]. A more parallel processing mode is accompanied with slow response times in the different actions to be cascaded, and hence an inefficient unfolding of behavior [Mückschel et al., 2013; Miller et al., 2009]. Previous results using electrophysiological techniques suggest that interindividual differences in these processing modes and action cascading efficiency are reflected in a network encompassing the anterior cingulate cortex (ACC) and the temporo‐parietal junction (TPJ) [Mückschel et al., 2013]. The ACC and the TPJ are areas constituting the multiple demand system (MD‐system), known to be important for the execution of multi‐component behavior [Duncan, 2013, 2010]. Mückschel et al. [2013] have shown that these areas are involved in processes mapping stimuli on appropriate responses (reflected by the P3 event‐related potential) and that the P3 predicts the degree of overlap between two actions to‐be‐cascaded: a smaller P3 being related to a more efficient mode of action cascading [see also: Stock et al., 2014]. Functional imaging studies further show that striatal activity predicts the degree of overlap between two actions to be cascaded [Ness and Beste, 2013], suggesting a role for the striatum. The importance of the striatum is also corroborated by clinical data [Beste and Saft, 2013] and is well in line with several accounts suggesting that the basal ganglia and GABAergic striatal medium spiny neurons (MSNs) play an important role in the selection and coordination between different actions [e.g., Bar‐Gad et al., 2003; Redgrave et al., 1999].
However, the basal ganglia can be seen as a structure that is not only involved in processes related to motor aspects of actions, but also as a structure that receives sensory information from different modalities including the visual and the auditory system [Kropotov et al., 2000; Nagy et al., 2006; Redgrave and Gurney, 2006; Znamenskiy and Zador, 2013]. This sensory afferent information is fed into the basal ganglia via glutamatergic cortico‐striatal synapses [e.g., Bolam et al., 2000]. This convergence of sensory information in the striatum is interesting, as it also has been noted that besides response‐related processes, attentional selection processes are important in situations where two or more actions have to be coordinated and cascaded to fulfill a task [Brisson and Jolicoeur, 2007]. The basal ganglia and especially the striatum may therefore be seen as a structure that integrates converging information in order to select and coordinate the selection of the appropriate action [Redgrave and Gurney, 2006]. The striatum may thus be central to the understanding of possible neurophysiological and neurobiochemical mechanisms underlying performance differences in action cascading processes.
As information processing within the striatum is highly dependent upon GABAergic and glutamatergic neural transmission we apply MR‐spectroscopy (MRS) and integrate this data with event‐related potential (ERP) data reflecting attentional selection processes [i.e., P1 and N1 ERPs; Herrmann and Knight, 2001], as well as processes mediating between stimuli and response (i.e., P3) [Falkenstein et al., 1994a,b; Polich, 2007; Verleger et al., 2005]. We hypothesize that APTs show enhanced attentional selection processes (stronger P1 and N1) and more efficient processes mediating between stimuli and responses [i.e., a smaller P3; see Mückschel et al., 2013]. This should come along with a more efficient behavioral performance in response selection in APTs. We further expect that GABA levels and metabolites of glutamatergic neural transmission (i.e., Glu and Glx) as revealed by MRS predicts interindividual variations in P1, N1, and P3 amplitude as well as behavioral data, because striatal structures may serve as a central element in the integration of the different streams of information and processes necessary for action cascading.
MATERIALS AND METHODS
Participants
A sample of 20 airplane pilot trainees (age 23.18 ± 1.97 years, range 21–29 years, two females) after passing the entrance examination and in process of obtaining their Multi‐crew Pilot License (MPL) was recruited for the experimental group. The control group consisted of 20 subjects (age 24.94 ± 2.82 years, range 20–31 years, two females); two control subjects were discarded from analyses because the MRS data was of poor quality. All subjects had normal or corrected‐to‐normal vision. All subjects received financial compensation or course credit for their participation. Experiments were carried out in accordance with the Declaration of Helsinki and the study was approved by the ethics committee of the medical faculty of the University of Bochum.
Task
The task used to examine action cascading processes and allowing for a classification of the mode of action selection along a continuum ranging from a more serial to a more parallel mode and hence the efficiency of action cascading is a stop‐change (SC) paradigm. This paradigm has been used previously [e.g., Mückschel et al., 2013; Stock et al., 2014] and is adapted from a paradigm by Verbruggen et al. [2008]. The paradigm is shown in Figure 1.
Figure 1.

Schematic illustration of the Stop‐change paradigm. GO1 trials end after the first response to the GO1 stimulus (bold). In contrast, SC trials end after the first response to the CHANGE signal (bold). The stop‐signal delay (SSD) between the onset of the GO1 stimulus and the STOP signal was adjusted using a staircase procedure described in the methods section. The stimulus onset asynchrony (SOA) between the onset of the STOP and CHANGE stimuli was set to either 0 or 300 ms. As indicated in the upper right corner, the three CHANGE stimuli were associated with one of the three reference lines [cf., Stock et al., 2014].
Throughout every trial, a rectangle (20 × 96 mm2) containing four vertically aligned circles (8‐mm diameter) and three horizontal reference lines (line thickness: 1 mm, width: 8 mm) separating the circles were presented on the screen. At the start of each trial, all lines were white and the four circles were filled black. After 250 ms, one of the circles was filled white thus becoming the GO1 target stimulus. In the GO1 condition (67% of all trials), the participants' response was expected to indicate whether this filled white circle (target) was located above or below the middle reference line. Responses were given by pressing the outer right key with the right middle finger (“above” judgment) or by pressing the inner right key with the right index finger (“below” judgment). All stimuli remained visible until the participant either responded or 2,500 ms had elapsed. In case of reaction times (RTs) longer than 1,000 ms the German word “Schneller!” (translating to “Faster!”) was presented above the box until the participant responded thereby ending the trial.
The remaining 33% of trials were SC trials. The SC condition started with the presentation of a white GO1 stimulus. After a variable ‘stop‐signal delay’ (SSD), which was adjusted using a staircase procedure [Logan and Cowan, 1984], a STOP signal (a red rectangle replacing the usual white frame; depicted grey in Fig. 1) was presented, putting an end to the GO1 trial. This STOP signal remained on the screen until the end of the trial and requested the participant to try to inhibit the right hand response to the GO1 stimulus. The SSD was initially set to 450 ms and adapted to the participants' performance by means of a “staircase procedure” yielding a 50% probability of successfully inhibited GO1 responses. In case of a completely correct SC trial (no response to GO1 stimulus, no response before the GO2 stimulus (explained below) in SCD300 conditions and a correct left hand response to the GO2 stimulus), the SSD was adjusted by adding 50 ms to the SSD of the evaluated trial. In case of an erroneous SC trial (if any of the above criteria were not met), the SSD was adjusted by subtracting 50 ms from the SSD of the evaluated trial. Limiting this procedure, SSD values were set not to go below a value of 50 ms and not to exceed a value of 1,000 ms.
Irrespective of the inhibition performance, every stop signal was combined with one of the three possible CHANGE stimuli. The CHANGE stimulus was a 100 ms sine tone presented via headphones at 75‐dB SPL and could be either high (1,300 Hz), medium (900 Hz) or low (500 Hz). It assigned a new reference line in relation to which the GO2 stimulus (the previous GO1 white target circle that had remained on the screen during the whole trial) had to be judged. While the high tone represented the highest of the three lines as the new reference, the medium tone represented the middle line and the low tone represented the lowest line (see Fig. 1). All three reference lines were in effect equally often. The required GO2 response had to be performed with the left hand. If the target circle was located above the newly assigned reference line, an outer left key press (left middle finger) was required and if the target circle was located below the newly assigned reference line, a left inner key press (left index finger) was required. In half of the SC trials, there was a stop‐change delay (SCD) with a stimulus onset asynchrony (SOA) of 300 ms between the STOP and the CHANGE signal (“SCD300” condition) while in the other half of SC trials, the two stimuli were presented simultaneously (SOA of 0 ms, “SCD0” condition). In case of RTs longer than 2,000 ms the German word “Schneller!” (translating to “Faster!”) was presented above the box until the participant responded to end the trial. During the inter‐trial interval (ITI; fixed duration of 900 ms), a fixation cross was presented at the center of the screen.
Participants were instructed to respond as fast and accurately as possible. All conditions were presented in a randomized order. Therefore, preparatory effects in the motor system biasing the results are very unlikely. The experiment consisted of 864 trials (divided into six blocks) and took the participants ∼30 min to finish. Prior to the experiment participants completed an exercise until they understood the task.
Estimation of the Mode and Efficiency of Action Cascading
The mode of action cascading and hence the efficiency of this process was estimated using a mathematical model: As described above, the paradigm introduces two different SCD intervals. On the basis of these SCDs (i.e., 0 and 300 ms) we calculated a slope value for the GO2 RTs using the equation:
The slope value was individually calculated for each participant. This value becomes steeper the more SCD0‐RT and SCD300‐RT differ. The interpretation of the slope value as a measure of response selection processes on a serial–parallel continuum is based on the following rationale [see Verbruggen et al., 2008]: The SOA in the SCD300 condition enforces a serial processing of the STOP‐ and CHANGE‐related processes because the STOP process has usually been finished when the CHANGE stimulus is presented 300‐ms later. In contrast to this, the SCD0 condition provides the participants with a choice of how to cascade STOP‐ and CHANGE‐associated processes. Bottleneck models suggest that response selection can be done rather serially (one step is executed after another) or rather parallel [steps are processed in parallel so that there is a temporal overlap of processes; Miller et al., 2009; Verbruggen et al., 2008; Wiu and Liu, 2008]. Because response selection depends on a restricted resource, the processing strategy differentially affects the GO2 RT in the SCD0 condition: When the STOP process has not finished at the time the CHANGE process is initiated (parallel processing), the slope value becomes larger and action cascading less efficient. If it has finished (serial processing), the slope is closer to 0 and action cascading more efficient [Verbruggen et al., 2008]. 1 Obtaining a mean slope value in between 0 and −1 hence suggests that the initiation of some (but not all) of the GO2 response processes were initiated before the termination of the inhibitory process of stopping the GO1 response. Therefore, the slope of the SOA‐RT function is flatter in case of more efficient processing than in the case of less efficient processing mode [quoted from Stock et al., 2014].
EEG Recording and Analysis
The EEG recording and analysis was performed similar to our previous study [Mückschel et al., 2013; Stock et al., 2014]: The EEG was recorded from 65 Ag/AgCl electrodes against a reference electrode located at FCz. Electrode impedances were kept below 5 kΩ. After data recording, a band‐pass filter (0.5–20 Hz at a slope of 48 db/oct) was applied and a raw data inspection was conducted to remove technical artifacts. Periodically recurring artifacts (pulse artifacts, horizontal, and vertical eye movements) were corrected using an independent component analysis (ICA; Infomax algorithm) which was applied to the unepoched data. Stimulus‐locked segments based on the stop signal were formed. Automated artifact rejection procedures were applied. Rejection criteria included a maximum voltage step of more than 60 μV ms−1, a maximal value difference of 150 μV in a 250 ms interval or activity below 1 μV. Artifact rejection was followed by a current‐source‐density (CSD) transformation yielding a reference‐free evaluation of the electrophysiological data and helping to identify the electrodes showing the strongest effects. Baseline correction was conducted using the interval from −900 ms to −700 ms as prestimulus baseline (i.e., a baseline set before the occurrence of the GO1 stimulus). The electrodes used for the quantification of the P1, N1, and P3 ERPs, were selected in a data‐driven manner. Based on the scalp topography maps, the visual P1 and N1 were quantified at electrodes P7 and P8 (P1: 0 ms till 140 ms; N1: 150 till 250), the auditory P1 at electrodes TP9 and TP10, the auditory N1 at C5 and C6 (0 ms till 500 ms), and the P3 at Cz (200 ms till 600 ms). All ERP components (peak amplitudes) were quantified relative to the pre‐stimulus baseline on the single subject level. For each subject peak amplitudes and latencies were obtained.
MRS Acquisition and Analysis
MRS data was acquired on a 3 T Philips Achieva whole‐body scanner using a 32‐channel head coil. Fast T2‐weighted images were obtained in axial, coronal and sagittal planes to enable placement of a 30 × 30 × 25 mm3 MRS volume of interest (VOI) centered on the striatum. MRS data was acquired from VOIs placed in the left as well as the right striatum to rule out any laterality effects. Automatic shimming resulted in linewidths of <20 Hz for all spectra. Both, short echo time point resolved spectroscopy (PRESS) spectra (echo time (TE) = 30 ms, repetition time (TR) = 2,000 ms, 32 averages) and MEGA‐PRESS edited GABA spectra (TE/TR = 68/2,000 ms, edit ON acquisitions = 16, edit OFF acquisitions = 16) [Edden et al., 2007; Mescher et al., 1998] were acquired from each VOI. In addition, a reference scan without water suppression was also acquired for frequency and phase correction. LCModel [Provencher et al., 1993] (v6.2‐0R), which fits the in vivo MR spectra as a linear combination of single metabolite “basis spectra,” was used to quantify the spectra. PRESS spectra were used for the quantification of major metabolites including N‐acetyl aspartate (NAA), total choline (tCho), total creatine (tCr), myo‐inositol (mI), and glutamate+glutamine (Glx). GABA was quantified from the MEGA‐PRESS difference spectra as GABA plus macromolecules (GABA+) using basis spectra obtained by density matrix simulations. The value of tCr for computing GABA+/tCr was obtained from fitting the edit OFF spectrum of the MEGA‐PRESS acquisition. Metabolite concentrations are reported in institutional units (i.u) as well as ratios to tCr. PRESS metabolites with LCModel percentage standard deviation (SD) over 20 were excluded from further analysis. Prior to the regression analyses the concentrations of the different metabolites were averaged across the VOI placed in the left and the right striatum.
The fractions of gray matter (GM), white matter (WM) and cerebrospinal fluid (CSF) were calculated by superimposing the coordinates of the spectroscopy VOI on the high resolution T1‐weighted images using the partial volume correction tool provided by N. Goulden and P. Mullins (http://biu.bangor.ac.uk/projects.php.en). The corresponding volume in the T1‐weighted data set was then segmented into GM, WM and CSF fractions using the VBM8 toolbox (http://dbm.neuro.uni‐jena.de/vbm/) as part of SPM8. To control if the fraction of GM, WM and CSF change the predictive values of the spectroscopy parameters on neurophysiological and behavioral data these fractions were also used as predictors in the regression analyses.
Statistical Analyses
The data was analyzed using mixed effects ANOVAs with the factors “SCD interval (SCD0 vs. 300)” and “electrode” (wherever necessary) and the between‐subject factor “group” (APT vs. control). Post hoc tests were Bonferroni‐corrected whenever necessary. All included variables were normally distributed as tested with Kolmogorov–Smirnov tests (all z < 0.9; P > 0.3). Additionally, regression analyses were calculated using the “enter” method. For these regression analyses, the individual striatal GABA+/tCr and Glx/tCr concentration ratios measured using MRS were used to predict the amplitudes of the ERP components differing between APTs and controls. The group effect (i.e., APTs vs. controls), was also modeled in the regression analyses.
RESULTS
Behavioral Data
The reaction time data was analyzed in a mixed effects ANOVA using “condition” (GO1, SCD0 and SCD 300) as within‐subject factor and “group” (APTs vs. controls) as between‐subject factor. There was a main effect “condition” (F(2,72) = 136.02; P < 0.001; η 2 = 0.781) showing that RTs were fastest in the GO1 condition (517 ± 16 ms) followed by the SCD300 (778 ± 28 ms) and SCD0 condition (942 ± 27 ms). All conditions differed from each other (P < 0.001). There was an interaction “condition × group” (F(2,72) = 3.99; P = 0.023; η 2 = 0.095), but no main effect group (F(1,36) = 2.90; P = 0.12). Bonferroni‐corrected two samples t tests revealed that APTs did not differ from controls in the GO1 condition (APTs: 514 ± 22 ms; controls: 519 ± 24 ms; t 36 = −0.14; P = 0.442) and in the SCD300 condition (APTs: 744 ± 55 ms; controls: 799 ± 44 ms; t 36 = −1.18; P = 0.122). However, in the SCD0 condition APTs revealed faster RTs (870 ± 35 ms) than controls (1,013 ± 46 ms) (t 36 = −2.84; P < 0.009). The slope of the SCD‐RT2 function was hence flatter in APTs than in controls (t 36 = −2.32; P = 0.011). The stop signal reaction time (SSRT) did not differ between APTs and controls (P > 0.5). Similarly, the mean stop‐change delay (SSD) was not different between APTs and controls (P > 0.4). With respect to the accuracy, APTs and controls did not differ in their error rates on SCD trials, neither in the SCD0 nor in the SCD300 condition (P > 0.6).
Electrophysiological Data
Auditory P1 and N1 effects
The first step was analysis of auditory and visual attentional selection processes and quantification of the auditory P1 and N1 and the visual P1 and N1. The corresponding ERP plots are shown in Figure 2.
Figure 2.

(A) The auditory P1 at electrodes TP9 and TP10 for the SCD 0 and SCD 300 condition in APTs and controls. Time point 0 denotes the time point of stop‐signal presentation. Colors of the ERP traces denote the data of APTs and controls in the different experimental conditions. The scalp topography maps denote the auditory P1 in the SCD 0 condition. (B) The auditory N1 at electrodes C5 and C6 for the SCD 0 and SCD 300 condition in APTs and controls. Time point 0 denotes the time point of stop‐signal presentation. Colors of the ERP traces denote the same conditions as in figure part (A). The scalp topography maps denote the auditory N1 in the SCD 0 condition. [Color figure can be viewed in the online issue, which is available at wileyonlinelibrary.com.]
For the auditory P1 (electrodes TP9 and TP10) the ERPs are shown in Figure 2A. There was a main effect “SCD interval” (F(1,36) = 15.64; P < 0.001; η 2 = 0.292) showing that the P1 was larger in the SCD0 (25.37 ± 1.85 µV m−2), compared to the SCD300 (17.13 ± 1.43 µV m−2) condition. There was also a main effect group (F(1,36) = 4.65; P = 0.037; η 2 = 0.109) showing that the P1 was larger in APTs (25.28 ± 1.65 µV m−2) than in controls (15.39 ± 1.54 µV m−2). Importantly, there was an interaction “SCD interval × group” (F(1,36) = 16.11; P < 0.001; η 2 = 0.298). Bonferroni‐corrected independent samples t tests revealed that APTs showed a larger P1 (30.11 ± 2.33 µV m−2) than controls (19.23 ± 2.64 µV m−2) in the SCD0 condition (t 36 = 3.87; P < 0.001, but not in the SCD300 condition (APTs: 17.44 ± 2.55 µV m−2; controls: 15.89 ± 2.85 µV m−2; P > 0.4). There were no latency effects (all F < 0.51; P > 0.3). A correlation analysis using the slope of the SCD‐RT2 functions and the auditory P1 amplitude revealed a substantial correlation between these variables across the entire cohort (r = 0.691; R 2 = 0.47; P < 0.001).
The auditory N1 revealed a different topography and is shown in Figure 2B. For the N1 there was a main effect “SCD interval” (F(1,36) = 7.94; P = 0.008; η 2 = 0.173) showing that the N1 was less negative in the SCD0 (−11.08 ± 3.1 µV m−2), compared to the SCD300 condition (−20.28 ± 2.16 µV m−2). There was also a main effect “group” showing that the N1 was larger in controls (−20.81 ± 2.89 µV m−2) than in APTs (−10.55 ± 2.75 µV m−2) (F(1,36) = 6.28; P = 0.017; η 2 = 0.142). In addition there was an interaction “SCD interval × group” (F(1,36) = 20.01; P < 0.001; η 2 = 0.345) and the N1 differed between APTs and controls in the SCD0 condition (P = 0.01), but not in the SCD300 condition (P > 0.3). As with the P1, there were also no latency effects for the N1 (all F < 0.3; P > 0.6).
Visual P1 and N1 effects
For the visual P1 amplitude, there were no main effects of “electrode,” “group,” and “SCD interval” or any interaction between these factors as well as no latency effects (all F < 0.4; P > 0.4). For the visual N1 there was only a main effect “electrode” (F(1,36) = 31.94; P < 0.001; η 2 = 0.457) showing that the N1 was smaller at electrode P7 (−24.02 ± 2.35 µV m−2), compared to P8 (−33.95 ± 2.77 µV m−2). All other main or interaction effects were not significant (all F < 0.6; P > 0.3). There were also no effects for the visual N1 latency (all F < 0.7; P > 0.3). The visual P1 and N1 are shown in Figure 3.
Figure 3.
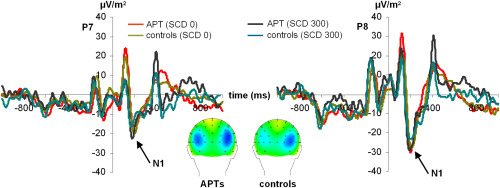
The visual P1 and N1 in the SCD0 and SCD 300 condition at electrodes P7 and P8. Time point 0 denotes the time point of stop‐signal presentation. Colors of the ERP traces denote the data of APTs and controls in the different experimental conditions. The scalp topography plots denote the N1 in the SCD 0 condition. [Color figure can be viewed in the online issue, which is available at wileyonlinelibrary.com.]
P3 effects
The P3 at electrode Cz is shown in Figure 4.
Figure 4.

The P3 at electrode Cz in the SCD 0 and SCD 300 condition. Time point 0 denotes the time point of stop‐signal presentation. Colors of the ERP traces denote the data of APTs and controls in the different experimental conditions. The scalp topography plots denote the P3 in the SCD 0 condition. [Color figure can be viewed in the online issue, which is available at wileyonlinelibrary.com.]
The mixed effects ANOVA revealed a main effect “SCD interval” (F(1,36) = 13.99; P < 0.001; η 2 = 0.233), with the P3 being larger in the SCD0 condition, compared to the SCD300 condition. No other main or interaction effects were significant (all F < 0.4; P > 0.5).
MR spectroscopy and regression analyses
A representative MRS short‐TE PRESS spectrum and MEGA‐PRESS GABA spectrum acquired from a striatal VOI (Fig. 5A) are shown in Fig. 5B,C, respectively. The concentrations of the different metabolites are given in Table 1.
Figure 5.

(A) Illustration of the placement of the volume of interest for the left striatum. In the right striatum the volume was placed similar. (B) Representative example of a PRESS spectrum showing the concentrations of mI, tCho, tCr, Glx and NAA. (C) Representative example of the MEGA‐PRESS edited GABA spectrum showing the peaks of GABA+, NAA, and lipids. [Color figure can be viewed in the online issue, which is available at wileyonlinelibrary.com.]
Table 1.
Striatal metabolite concentrations (mean ± SD) in APTs and controls averaged over the left and right striatal voxels. tCR is given in institutional units (i.u)
| Metabolite | Airplane pilot trainees (APTs) | Controls | Significance |
|---|---|---|---|
| GABA/tCr | 0.22 (0.08) | 0.39 (0.15) | ns |
| NAA/tCr | 0.92 (0.09) | 0.90 (0.11) | ns |
| Glu/tCr | 1.02 (0.11) | 1.01 (0.08) | ns |
| Glx/tCr | 1.59 (0.11) | 1.57 (0.09) | ns |
| mI/tCr | 0.57 (0.08) | 0.57 (0.10) | ns |
| GPC+PCH/tCr | 0.27 (0.01) | 0.27 (0.08) | ns |
| tCr (i.u) | 6.12 (0.42) | 6.11 (0.21) | ns |
tCr was found to be stable across the test groups and could thus be used as reference concentration. As can be seen in Table 1, striatal GABA+/tCr concentrations did not differ between APTs and controls. Similar results were obtained for the other MRS metabolites like NAA/tCr, Glx/tCr, mI/tCr and tCho/tCr.
However, the behavioral data revealed a flatter slope of the SCD‐RT2 function suggesting for a more serial mode action cascading in APTs, compared to controls. Similarly, the auditory P1 was larger in APTs. To integrate the model‐based behavioral and electrophysiological data with the neurochemical (MRS) data regression analyses were used. In the regression analyses the slope of the SCD‐RT2 function or the amplitude of the auditory P1 in the SCD0 conditions were the dependent variables. The striatal GABA+/tCr ratio and the factor “group” (APTs vs. controls) and the Glx/tCr ratio were used as independent variables in separate regression analyses. The results of the regression analyses are shown in Figure 6.
Figure 6.

Scatterplots denoting the results of the regression analyses. Plots in column (A) show the correlation between the slope of the SCD‐RT2 function and GABA+/tCr (top) as well as the correlation between the auditory P1 amplitude and GABA+/tCr (bottom). Plots in column (B) show the correlations of the SCD‐RT2 function and Glx/tCr (top) as well as the correlation between the auditory P1 amplitude and Glx/tCr (bottom). Open circles denote APTs and black dots denote controls.
GABA+/tCr
For the slope of the SCD‐RT2 function the regression model was significant (F(2,35) = 12.38; P < 0.001). Within the model, both, the GABA+/tCr (β = 0.471; t = 3.62; P = 0.001) and the factor group were significant (β = 0.489; t = 3.76; P = 0.001). For the APTs there was a correlation between SCT‐RT2 and GABA/tCr (r = 0.736; R 2 = 0.53; P < 0.001). The same was evident for the controls (r = 0.438; R 2 = 0.17; P = 0.021). However, as can be seen in Figure 6A the slope of the regression line relating SCD‐RT2 with GABA+/tCr was steeper in APTs than in controls.
For the amplitude of the auditory P1 in the SCD0 condition the regression model was also significant (F(2,35) = 25.46; P < 0.001). Within the model, both, the GABA+/tCr (β = 0.378; t = 3.48; P = 0.001) and the factor group were significant (β = 0.710; t = 6.54; P < 0.001). There was a correlation between SCT‐RT2 and GABA+/tCr for the APTs (r = 0.588; R 2 = 0.33; P = 0.003) as well as for the controls (r = 0.485; R 2 = 0.23; P = 0.021). However, to control whether the correlations obtained were driven by creatine (tCr) and not by GABA, we used the tCr concentration (i.u.) as obtained from the MEGA‐PRESS spectra as additional regressor in the analyses. These analyses revealed no effect of tCr on the neurophysiological and the behavioral parameter (all β < 0.123; t < 0.94; P > 0.4). To control further for a possible influence of GM, WM and CSF fraction we also used these fractions in other separate regression models. All these models revealed that neither, GM, nor WM, nor CSF explained further variance in the models (all β < 0.139; t < 0.99; P > 0.4). Independent samples t tests showed that APTs and control did not differ in their GM ratio (APT: 0.34 ± 0.02; controls: 0.34 ± 0.01; t 38 = 0.22; P > 0.8), WM ratio (APT: 0.58 ± 0.04; controls: 0.57 ± 0.03; t 38 = 0.62; P > 0.5) and CSF ratio (APT: 0.06 ± 0.02; controls: 0.07 ± 0.01; t 38 = −1.01; P > 0.3). Also, when using raw GABA (i.u.) and Cr (i.u.) values corrected for tissue content (i.e., raw GABA and Cr values multiplied by 1‐CSF) in other regression analyses using the “enter” method there was still a correlation for GABA in APTs (r = 0.504; R 2 = 0.25; P = 0.003) and controls (r = 0.444; R 2 = 0.19; P = 0.029), but none for Cr (all r < 0.102; P > 0.5) with the P1 amplitude. The same was evident for SCT‐RT2 parameter, where correlations with GABA were (r = 0.703; R 2 = 0.49; P< 0.001) for APTs and (r = 0.422; R 2 = 0.17; P = 0.026) for the controls. There were no correlations with Cr (all r < 0.09; P > 0.6).
Glx/tCr
The scatterplots correlating the slope of the SCD‐RT2 function and the amplitude of the auditory P1 with the Glx/tCr ratio are shown in Figure 6B. Using the Glx/tCr ratio, the above analyses were repeated. Using the slope of the SCD‐RT2 function there was a significant model (F(2,35) = 10.22; P < 0.001) in which both, the Glx/tCr (β = 0.455; t = 3.44; P = 0.001) and the factor group were significant (β = 0.432; t = 3.33; P = 0.001). For the APTs there was a correlation between SCT‐RT2 and Glx/tCr (r = 0.673; R 2 = 0.44; P < 0.001). The same was evident for the controls (r = 0.401; R 2 = 0.16; P = 0.021).
The regression model was significant for the amplitude of the auditory P1 in the SCD0 condition (F(2,35) = 20.22; P < 0.001). Within the model, both, the Glx/tCr (β = 0.388; t = 3.55; P = 0.001) and the factor group were significant (β = 0.670; t = 6.34; P < 0.001). Again there was a correlation between SCT‐RT2 and Glx/tCr for the APTs (r = 0.621; R 2 = 0.38; P = 0.001) and for the controls (r = 0.431; R 2 = 0.18; P = 0.025). To control whether the correlations obtained were driven by creatine (tCr) and not by Glx, we used the tCr concentration (i.u.) as obtained from the PRESS spectra as additional regressor in the analyses. These analyses revealed no effect of tCr on the neurophysiological and the behavioral parameter (all β < 0.088; t < 0.77; P > 0.5). To control further for a possible influence of GM, WM, and CSF fraction we also used these fractions in other separate regression models. All these models revealed that neither, GM, nor WM, nor CSF explained further variance in the models (all β < 0.095; t < 0.84; P > 0.5). As with the GABA parameter, we used raw Glx (i.u.) and Cr (i.u.) values corrected for tissue content in regression analyses using the “enter” method. There was no correlation with Cr in APTs and controls for the P1 and the SCD‐RT2 parameter (all r < 0.133; P > 0.5). Yet, there were still correlations with the P1 parameter in APTs (r = 0.599; R 2 = 0.34; P = 0.001) and controls (r = 0.401; R 2 = 0.16; P = 0.029), as well as for the SCD‐RT2 parameter in APTs (r = 0.623; R 2 = 0.38; P < 0.001) and controls (r = 0.391; R 2 = 0.15; P = 0.031).
DISCUSSION
We studied APTs as a possible model to examine which electrophysiological and neurobiochemical processes may underlie superior performance in action selection. Currently neuroscientific research heavily investigates declines in performance, but little is known about the mechanisms mediating superior performance in action control.
To this end, we integrated MRS data with electrophysiological data (ERP data) recorded in a stop‐change paradigm that allows an estimation of the efficiency of action cascading using mathematical constraints. The behavioral data suggest that APTs use a more efficient mode during action cascading, compared to controls. The slope of the SCD‐RT2 function in controls is comparable to other studies in healthy young subjects [see, Mückschel et al., 2013; Stock et al., 2014]. Changes in the slope of the SCD‐RT2 functions were driven by the SCD0 condition, where APTs showed faster response times than controls. In the SCD300 condition, there was no difference between APTs and controls. Because SCD0 is the only condition in which participants can cascade their actions according to their “preferred” processing strategy (see Methods section), this allows for the interpretation that the effects were confined to specific variations in response selection/action cascading processes with respect to efficiency of action cascading. However, the P3 data was not different between controls and APTs, suggesting that processes related to the mapping of a stimulus onto the appropriate response, as reflected by P3 [Falkenstein et al., 1994a,b; Polich, 2007; Verleger et al., 2005], do not contribute to the more efficient unfolding of behavioral control observed in APTs. With respect to other studies using the same paradigm [e.g., Mückschel et al., 2013; Stock et al., 2014] the results suggest that the efficiency of action cascading is not necessarily dependent on processes mapping the stimuli onto the response. The effects observed at the behavioral level can therefore not unequivocally be attributed to serial‐parallel differences in the response selection mode. It cannot be excluded that APTs exhibit faster parallel processing capabilities then controls. It is possible that APTs use other mechanisms to achieve efficient unfolding of action cascading. In this regard it seems to be an altered perceptual/attentional processing that may be of relevance. In line with this, the electrophysiological data showed that the P1 on the auditory change signal in the SCD0 condition was stronger in APTs, compared to controls. The auditory N1 was also larger in APTs, however, this may reflect a simple aftereffect of the enlarged auditory P1 and is therefore hard to interpret. In the SCD300 condition, no differences between APTs and controls were evident in the auditory P1 and N1. The visual P1 and N1, as well as the P3 were not different between APTs and controls. Further evidence corroborating the assumption that efficient action control in APTs is related to attentional processing comes from the regression analysis showing that the amplitude of the auditory P1 was predictive for the steepness of the slope of the SCD‐RT2 function. These results support a role for attentional gating in response selection, with higher response to the auditory stimulus predicting faster processing in the task where STOP and CHANGE signals simultaneously demand processing resources. Perhaps this implies that better cross‐modal interaction between stimulus response systems is the driver for faster processing.
Integrating the ERP and behavioral data with the MRS‐data revealed that the GABA+/tCr level in the striatum was predictive for the modulation of these attentional gating functions probably underlying efficient action cascading processes in APTs. These results are unbiased with respect to the concentration of creatine and the GM, WM and CSF fractions in the voxel. Because this allows for the conclusion that it is indeed the GABA+ concentration and not the tCr that drives any associations, we will further speak about GABA+ concentrations in the discussion. The same is true for results on Glx/tCr. A stronger auditory P1 and a smaller (less negative) SCD‐RT2 parameter were related to higher striatal GABA concentrations. Similar results were found for Glx (i.e., glutamate + glutamine). These results suggest that striatal structures are involved in processing of the change stimulus, a result that is plausible against other findings reporting auditory sensory neurons in the striatum [Kropotov et al., 2000; Nagy et al., 2006; Saft et al., 2008; Znamenskiy and Zador, 2013].
The results further suggest that superior performance in action cascading depends at least on two neurobiochemical factors related to the glutamatergic and GABA‐ergic system. While correlations between GABA+ concentrations, Glx concentrations and the auditory P1 amplitude as well as the slope of the SCD‐RT2 function in controls and APTs where evident in APTs and controls, the regression analyses showed that the slope of the regression lines were steeper in APTs, compared to controls. Hence, similar increases in GABA+ and Glx ‐levels led to stronger increases in the auditory P1 and a more efficient processing in action cascading in APTs, compared to controls. This suggests that the neurobiochemical‐electrophysiological and neurobiochemical‐behavioral coupling is stronger in APTs than in controls. It is likely that this stronger neurobiochemical‐electrophysiological and behavioral coupling partly underlies the more efficient unfolding of action cascading processes, besides the more intense attentional gating in APTs as evidenced by the stronger auditory P1.
In striatal structures GABA is abundant and constitutes the key element in the functioning of medium spiny neurons (MSNs) [e.g., Bolam et al., 2000]. These neuron types have recently been shown to affect action cascading processes and it has been found that dysgenesis of striatal MSNs is associated with a more parallel and hence inefficient mode of action cascading [Beste and Saft, 2013]. The current MRS results showing that higher GABA+ concentrations are related to a more efficient processing mode nicely complement these findings. Striatal MSNs have been suggested to form a winner‐takes‐all network [WTA; Gurney et al., 2004; Plenz, 2003; Redgrave et al., 1999], i.e., meaning that the network of inhibitory connections between MSNs is assumed to inhibit neighboring neurons. As a consequence competing actions are suppressed and the network converges to a single winner [Bar‐Gad et al., 2003]. It is possible that higher striatal GABA concentrations lead to a sharper WTA and hence a stronger suppression of alternative actions in striatal structures. As alternative actions may hence not be evident in these structures, a strong WTA mechanism entails a more efficient processing mode in action cascading processes and leads to faster reaction times during changing to another task. In addition to the putatively sharper WTA mechanism the input to the striatal network, mediated by glutamatergic system, is also more efficient in APTs, as suggested by the slope of the regression line interrelating striatal Glx concentrations with behavioral performance and P1 amplitude. The fact that this was the case despite GABA+ and Glx concentrations did not differ between the groups suggests that there may be a third factor influencing the relation between GABA+/Glx with behavioral performance and neurophysiological processes. This third factor may be related to a possible altered strength of structural white matter connectivity between cortical and basal ganglia structures as well as factors related to the NMDA and GABA receptor sensitivities. This may be subject to future studies.
In summary, the current study shows that high performance in action cascading and multicomponent behavior, as exemplified in airplane pilot trainees, cannot only be driven by altered processes mapping stimuli onto the response [Mückschel et al., 2013; Yildiz et al., 2014], but also by intensified attentional processes. The results show that the efficiency of action cascading and hence the speed of responding as well as attentional gating functions seem to depend on striatal GABA+ and Glx concentrations with higher striatal concentrations being related to a more efficient mode of action cascading and stronger attentional gating. The results suggest that the strength of neurobiochemical‐behavioral and ‐electrophysiological coupling is important for superior action control in situations requiring a cascading of actions and hence differentiates between “high performer” and “normal performer.”
Footnotes
One limitation to this interpretation remains: According to Verbruggen et al. [2008], it is impossible to distinguish between the behavioral effects (RT slope values) of nondeterministic serial processing and parallel processing based on the RT slope value [c.f., Verbruggen et al., 2008 for a detailed discussion on this issue].
REFERENCES
- Bar‐Gad I, Morris G, Bergman H (2003): Information processing, dimensionality reduction and reinforcement learning in the basal ganglia. Prog Neurobiol 71:439–473. [DOI] [PubMed] [Google Scholar]
- Beste C, Saft C (2013): Action selection in a possible model of striatal medium spiny neuron dysfunction: behavioural and EEG data in a patient with benign hereditary chorea. Brain Struct Funct. doi: 10.1007/s00429-013-0649-9. [DOI] [PubMed] [Google Scholar]
- Bolam JP, Hanley JJ, Booth PA, Bevan MD (2000): Synaptic organization of the basal ganglia. J Anat 196:527–542. [DOI] [PMC free article] [PubMed] [Google Scholar]
- Borghini G, Astolfi L, Vechiato G, Mattia D, Babiloni F (2012): Measuring neurophysiological signals in aircraft pilots and car drivers for the assessment of mental workload, fatigue and drowsiness. Neurosci Biobehav Rev. doi:10.1016/j.neubiorev.2012.10.003. [DOI] [PubMed] [Google Scholar]
- Brisson B, Jolicoeur P (2007): Cross‐modal multitasking processing deficits prior to the central bottleneck revealed by event‐related potentials. Neuropsychologia 45:3038–3053. [DOI] [PubMed] [Google Scholar]
- Duncan J (2013): The structure of cognition: Attentional episodes in mind and brain. Neuron 80:35–50. [DOI] [PMC free article] [PubMed] [Google Scholar]
- Duncan J (2010): The multiple‐demand (MD) system of the primate brain: Mental programs for intelligent behaviour. Trends Cogn Sci 14:172–179. [DOI] [PubMed] [Google Scholar]
- Edden RAE, Barker PB (2007): Spatial effects in the detection of γ‐aminobutyric acid: Improved sensitivity at high fields using inner volume saturation. Magnc Reson Med 58:1276–1282. [DOI] [PubMed] [Google Scholar]
- Falkenstein M, Hohnsbein J, Hoormann J (1994a): Effects of choice complexity on different subcomponents of the late positive complex of the event‐related potential. Electroencephalogr Clin Neurophysiol 92:148–160. [DOI] [PubMed] [Google Scholar]
- Falkenstein M, Hohnsbein J, Hoormann J (1994b): Time pressure effect on late components of the event‐related potential (ERP). J Psychophysiol 8:22–30. [Google Scholar]
- Gurney K, Prescott TJ, Wickens JR, Redgrave P (2004): Computational models of the basal ganglia: From robots to membranes. Trends Neurosci 27:453–459. [DOI] [PubMed] [Google Scholar]
- Herrmann CS, Knight RT (2001): Mechanisms of human attention: Event‐related potentials and oscillations. Neurosci Biobehav Rev 25:465–476. [DOI] [PubMed] [Google Scholar]
- Kropotov JD, Alho K, Näätänen R, Ponomarev VA, Kropotova OV, Anichkov AD, Nechaev VB (2000): Human auditory‐cortex mechanisms of preattentive sound discrimination. Neurosci Lett 280:87–90. [DOI] [PubMed] [Google Scholar]
- Mescher M, Merkle H, Kirsch J, Garwood M, Gruetter R (1998): Simultaneous in vivo spectral editing and water suppression. NMR Biomed 11:266–272. [DOI] [PubMed] [Google Scholar]
- Meyer DE, Kieras DE (1997): A computational theory of executive cognitive processes and multiple‐task performance: Part 1. Basic mechanisms. Psychol Rev 104:3–65. [DOI] [PubMed] [Google Scholar]
- Miller J, Ulrich R, Rolke B (2009): On the optimality of serial and parallel processing in the psychological refractory period paradigm: Effects of the distribution of stimulus onset asynchronies. Cogn Psychol 58:273–310. [DOI] [PubMed] [Google Scholar]
- Mückschel M, Stock AK, Beste C (2013): Psychophysiological mechanisms of interindividual differences in goal activation modes during action cascading. Cereb Cortex. doi:10.1093/cercor/bht066. [DOI] [PubMed] [Google Scholar]
- Nagy A, Eördegh G, Paroczy Z, Markus Z, Benedek G (2006): Multisensory integration in the basal ganglia. Eur J Neurosci 24:917–924. [DOI] [PubMed] [Google Scholar]
- Ness V, Beste C (2013): The role of the striatum in goal activation of cascaded actions. Neuro Psychol 51:2562–2571. [DOI] [PubMed] [Google Scholar]
- Oberauer K, Kliegl R (2004): Simultaneous cognitive operations in working memory after dual‐task practice. J Exp Psychol Hum Percep Perform 30:689–707. [DOI] [PubMed] [Google Scholar]
- Plenz D (2003): When inhibition goes incognito: Feedback interaction between spiny projection neurons in striatal function. Trends Neurosci 26:436–443. [DOI] [PubMed] [Google Scholar]
- Polich J (2007): Updating P300: An integrative theory of P3a and P3b. Clin Neurophysiol 118:2128–2148. [DOI] [PMC free article] [PubMed] [Google Scholar]
- Provencher SW (1993): Estimation of metabolite concentrations from localized in vivo proton NMR spectra. Magn Reson Med 30:672–679. [DOI] [PubMed] [Google Scholar]
- Redgrave P, Gurney K (2006): The short‐latency dopamine signal: A role in discovering novel actions? Nat Rev Neurosci 7:967–975. [DOI] [PubMed] [Google Scholar]
- Redgrave P, Prescott TJ, Gurney K (1999): The basal ganglia: A vertebrate solution to the selection problem? Neuroscience 89:1009–1023. [DOI] [PubMed] [Google Scholar]
- Saft C, Schüttke A, Beste C, Andrich J, Heindel W, Pfleiderer B (2008): fMRI reveals altered auditory processing in manifest and premanifest Huntington's disease. Neuropsychologia 46:1290–1297. [DOI] [PubMed] [Google Scholar]
- Stock A‐K, Blaszkewicz M, Beste C (2014): Effects of binge drinking on action cascading processes: An EEG study. Arch Toxicol 88:475–488. [DOI] [PubMed] [Google Scholar]
- Verbruggen F, Schneider DW, Logan GD (2008): How to stop and change a response: The role of goal activation in multitasking. J Exp Psychol Hum Percept Perform 34:1212–1228. [DOI] [PubMed] [Google Scholar]
- Verleger R, Jaskowski P, Wascher E (2005): Evidence for an integrative role of P3b in linking reaction to perception. J Psychophysiol 19:165–181. [Google Scholar]
- Wiu C, Liu Y (2008): Queing network modeling of the psychological refractory period (PRP). Psychol Rev 115:913–954. [DOI] [PubMed] [Google Scholar]
- Yildiz A, Wolf OT, Beste C (2014): Stress intesifies demands on response selection during action cascading processes. Psychoneuroendocrinology 42:178–187. [DOI] [PubMed] [Google Scholar]
- Znamenskiy P, Zador AM (2013): Corticostriatal neurons in auditory cortex drive decision during auditory discrimination. Nature 497:482–485. [DOI] [PMC free article] [PubMed] [Google Scholar]