Abstract
Assessment of treatment efficacy in metastatic castration-resistant prostate cancer (mCRPC) is limited by frequent nonmeasurable bone metastases. The count of circulating tumor cells (CTCs) is a promising surrogate marker that may replace the widely used prostate-specific antigen (PSA). The purpose of this study was to quantify the dynamic relationships between the longitudinal kinetics of these markers during treatment in patients with mCRPC. Data from 223 patients with mCRPC treated by chemotherapy and/or hormonotherapy were analyzed for up to 6 months of treatment. A semimechanistic model was built, combining the following several pharmacometric advanced features: (1) Kinetic-Pharmacodynamic (K-PD) compartments for treatments (chemotherapy and hormonotherapy); (2) a latent variable linking both marker kinetics; (3) modeling of CTC kinetics with a cell lifespan model; and (4) a negative binomial distribution for the CTC random sampling. Linked with survival, this model would potentially be useful for predicting treatment efficacy during drug development or for therapeutic adjustment in treated patients.
Study Highlights.
WHAT IS THE CURRENT KNOWLEDGE ON THE TOPIC? ☑ Assessment of treatment efficacy in metastatic castrationresistant prostate cancer (mCRPC) is limited by the frequent development of nonmeasurable bone metastases. The count of circulating tumor cells (CTCs) is emerging as a promising surrogate marker, which could replace the widely used prostate-specific antigen (PSA). • WHAT QUESTION DID THIS STUDY ADDRESS? ☑ CTC kinetic monitoring during treatment could be used to predict treatment efficacy in patients with mCRPC. However, relationships between the kinetics of CTCs and PSA have never been assessed. We built a semimechanistic population model of CTC and PSA kinetics during treatment. • WHAT THIS STUDY ADDS TO OUR KNOWLEDGE ☑ The proposed semimechanistic model is the first to quantify the dynamic relationships between the kinetics of PSA and CTC count in treated patients with mCRPC. It combines several advanced features in pharmacometrics, accounting for the major challenges in CTC analysis. • HOW THIS MIGHT CHANGE CLINICAL PHARMACOLOGY AND THERAPEUTICS ☑ Linked with survival, this model might provide a useful tool for predicting treatment efficacy during drug development or for adjusting therapeutic strategy in patients with mCRPC.
Prostate cancer is the most common cancer and the third leading cause of death from cancer among men in developed countries.1 The development of metastases signals the distant spread of prostate cancer cells and the need for systemic treatments, including androgen-deprivation drugs. The natural history of prostate cancer with bone metastasis development, accounting for up to 90% of patients, induces a bias in the assessment of treatment efficacy, because most of these lesions are poorly assessable with morphological imaging techniques and Response Evaluation Criteria In Solid Tumors (RECIST) criteria.2 As a consequence, other indicators of treatment effects have been developed.
The prostate-specific antigen (PSA) is the most widely used serum tumor marker in evaluating treatment effect in prostate cancer.3,4 However, its validity as a surrogate marker of treatment efficacy is controversial, and the 50% decline rate recognized by the Prostate Cancer Clinical Trials working group was recently questioned.5,6 Consequently, new markers are emerging, such as the count of circulating tumor cells (CTCs), defined by the US Food and Drug Administration (FDA) as the number of EpCAM-positive epithelial nucleated cells >4 µm in diameter in a 7.5 mL blood sample.7,8 CTCs were first described by Ashworth8 in 1869, who observed “a case of cancer in which cells similar to those in the tumor were seen in the blood after death.” These cells correspond to tumor cells that have been released into the blood and potentially lead to the development of new metastases. CTCs are estimated to represent less than one in a billion of the circulating mononuclear cells in the blood9; this rarity has required the development of sensitive and robust detection and enumeration methods to implement CTC analysis for widespread use in the clinic.9 Several methods have been reported for CTC detection,10 but the CellSearch System (Veridex, Raritan, NJ) is the only FDA-approved method for enumeration in metastatic breast, prostate, and colorectal cancers.11–13 The major complication in CTC analysis is that the number of CTCs obtained in the aliquot may not reflect the actual number in the whole blood.9 For instance, Tibbe et al.9 identified three major sources of variation in CTC counting: (1) the Poisson-distributed sampling error of the number of CTCs in a blood sample; (2) the variability in enrichment efficiency; and (3) the intrareader and interreader variabilities.
Despite these limitations, CTC research has progressed rapidly in recent years in the effort to demonstrate the potential application of CTCs as a prognostic or predictive biomarker in oncology. In patients with metastatic castration-resistant prostate cancer (mCRPC) receiving chemotherapy or hormone-based treatments, both baseline CTC count (<5 vs. ≥ 5) and CTC changes (rise or decrease between baseline and another time point) during treatment were more closely associated with patient survival than were PSA changes.13–15 This finding led to the FDA approval of the use of CTC counts in the evaluation of patients with mCRPC. Although dichotomization is frequently used for CTC analyses (<5 or ≥ 5 per aliquot), it has some limitations, first and foremost the loss of statistical power.5,16,17
Monitoring the kinetics of CTCs using modeling is particularly relevant for several reasons. First, it is a highly sensitive clinical test based on shedding of tumor cells that, in theory, will provide information about the evolution of the total tumor burden, including the primary tumor and the metastases in an individual patient. Second, it represents a new tool for evaluating treatment response in large clinical trials. Finally, there is a need for improved serum biomarkers in mCRPC. However, the longitudinal kinetics of CTC counts, along with their relationships with other markers, such as PSA and tumor burden, needs to be addressed. The main purpose of the present study was to quantify the dynamic relationships between the longitudinal kinetics of PSA and CTC counts during treatment in patients with mCRPC. To achieve this goal, a semimechanistic model was built, combining several advanced features in pharmacometrics.
MATERIALS AND METHODS
Data
The data from 223 patients enrolled in the IMMC38 trial, meant to assess the relationships between categorized CTC count (<5 or ≥ 5 per aliquot) and survival in patients with mCRPC, were used.13 Patients were treated by chemotherapy and/or hormonotherapy; the administration dates were collected, but no treatment doses or pharmacokinetic outcomes were available. CTC counts per aliquot and PSA concentrations were measured at different timepoints along treatment. Characteristics of patients are described in Table 1. A median of four CTC values and four PSA titers was available per subject until six months after treatment initiation. The median CTC count was 2 CTC/7.5 mL, with a range of 0–6,437 CTC/7.5 mL, and the median PSA concentration was 116 ng.mL−1 with a range of <0.1–17,800 ng.mL−1. A large proportion of CTC counts equal to 0 was observed (40%). The limit of quantification for PSA concentration was 0.1 ng.mL−1.18 PSA observations below limit of quantification, representing 0.1% of the observed values, were fixed at limit of quantification/2 in the dataset.19
Table 1.
Patient characteristics
| Patient characteristics | Data |
|---|---|
| No. of patients | 223 |
| Total number of CTC observations | 919 |
| CTC count value | 2 (0–6,437) |
| Baseline CTC count | 7 (0–5,925) |
| Number of CTC count = 0 | 365 (40%) |
| Number of CTC observations per patient | 4 (2–6) |
| Total number of PSA observations | 928 |
| PSA concentration (ng.mL−1) | 116 (LOQ–17,800) |
| Baseline PSA concentration (ng.mL−1) | 130 (2–17,800) |
| Number of BLQ values for PSA | 1 (0.11%) |
| Number of PSA observation per patient | 4 (1–6) |
| Follow-up time, (day) | 124 (21–177) |
| Number of treatment cycles | 5 (2–10) |
BLQ, below limit of quantification; CTC, circulating tumor cell; LOQ, limit of quantification; PSA, prostate-specific antigen.
Data are presented as median (min–max).
Seventy percent of the patients discontinued the study at 180 days. Since the time-to-dropout seemed to be independent of PSA and CTC counts (visual inspection), the probability of dropout was not taken into account in the model, but the model-based analysis was limited to a six-month treatment duration to reduce potential statistical biases.
Individual kinetic profiles were heterogeneous, as illustrated in Supplementary Figure S1a,b. Different types of profiles were observed: some with parallel PSA and CTC kinetics, others with divergent evolutions.
Model development
A semimechanistic model was built to quantify the dynamic relationships between the kinetics of CTC counts and PSA concentrations during treatment in patients with mCRPC. Because of the characteristics of the data, the model combined different levels of complexity, as follows.
Drug effect kinetics
At a given time, a patient can receive either an administration of chemotherapy or hormonotherapy, or both simultaneously. Therefore, the model had to take into account the kinetics of the effects of the three regimens: chemotherapy, hormonotherapy, or both. Moreover, because neither doses nor concentrations were available, an arbitrary amount (equal to 1) was set for the doses for each treatment cycle.
Models with a common Kinetic-Pharmacodynamic (K-PD) compartment gathering chemotherapy and hormonotherapy as well as models with two separate K-PD compartments for each treatment type were tested. Furthermore, identical and different kinetic and efficacy parameters for each treatment type were evaluated. Finally, an additional direct effect of treatment on CTCs was also assessed.
Dynamic relationships between PSA and CTC kinetics
PSA concentration and CTC count kinetics had no clear direct relationships (Supplementary Figure S1a,b). The treatment effects on both PSA and CTCs were assumed to be mediated through a common latent variable, defined as an underlying, nonobserved variable.
Interpreting the latent variable as a tumor burden, different models for its kinetics were tested: the exponential, Gompertz, and Logistic models.20,21
Joint modeling of two types of data
PSA concentrations are continuous data whereas CTC counts are count data produced by a discrete process. As a consequence, the simultaneous modeling of count and continuous data was necessary. The productions of both markers were stimulated by the common latent variable.
The PSA kinetics was described by an indirect model. The CTC kinetics in the total body blood was modeled by a cell lifespan model, commonly used for the modeling of lifespans and delays in pharmacokinetics-pharmacodynamics.22 The main assumption of the cell lifespan model is that the rate of CTC loss at time t is equal to the production rate at time t–lifespan.22 The implementation method of the cell lifespan model is detailed in Supplementary Figure S2. A model including a PSA production by CTCs was also tested.
Random sampling of CTCs
CTCs obtained from the cell lifespan may not reflect the observed cell population. For instance, a CTC observation of 0 does not imply that no CTCs are produced. Because the total blood volume (5 L) is much greater than the aliquot volume (7.5 mL) and the CTCs are considered to be relatively rare count data, the observed CTC count from a 7.5 mL aliquot of blood was interpreted as a random sample of the total CTC count. The sampling distribution of observed CTC count was considered to be of the Poisson law family. Different Poisson-related models were tested: basic Poisson, zero-inflated Poisson, and negative binomial and zero-inflated negative binomial models.23
Nonlinear mixed effects model
To take the interindividual variability into account, model development was performed using nonlinear mixed effects modeling, and the software NONMEM (version 7.3 by ICON Development Solutions, Ellicott City, MD) with the ADVAN 13 subroutine was used.24 Estimations were made by maximizing the likelihood of the data, using the stochastic approximation expectation maximization algorithm followed by importance sampling to obtain the objective function value for hypothesis testing.
The simultaneous modeling of continuous and count data was permitted in NONMEM by the indication variable F_FLAG.24 The delay, representing the CTC lifespan, was implemented in NONMEM with the Absorption LAG (ALAG) parameter and was calculated with the method of steps that allowed virtually solving a delay differential equations system by transforming it into an ordinary differential equations system.25 Gamma and factorial functions were calculated using the GAMLN function implemented in NONMEM 7.3.24 Finally, data handling and graphical representations were performed in R, using the PsN suite and the Xpose package.26–28
Model selection and evaluation
Selection and evaluation of the best model were achieved using criteria based on the likelihood, relative standard errors (RSEs), and shrinkage values, goodness-of-fit plots, and simulation-based diagnostics.29,30
The agreement between PSA observations and predictions was evaluated using classical goodness-of-fit plots, such as population predictions vs. observations, individual predictions vs. observations, and residual analysis. The ability of the model to predict PSA was assessed using a visual predictive check (VPC). A total of 100 PSA profiles were replicated using the population parameters estimated from the model. The observed values were compared with the simulated fifth, median, and 95th percentiles with their confidence intervals (95%).
Different evaluation methods were used to evaluate the model predictive capacity on CTC count kinetics. For this kind of data, the probability of having a given number of CTCs was estimated. Simulation-based graphics were performed: categorical VPCs and overdispersion plot. Categorical VPCs were obtained from 100 simulated replicates of the data. Then, the median simulated probability of having a given number of CTCs and its 95% confidence interval was compared to the observed probability. To obtain an overdispersion plot, 500 replicates of the data under the model were simulated. Mean and variance were calculated for each simulated patient using their longitudinal CTC measurements. Then, the median of the variance and its 95% predicted confidence interval was computed for each bin of mean. Finally, the simulated overdispersion was compared to the observed one.
Sensitivity of simulated PSA and CTC kinetics
The model and its parameters were used to simulate individual kinetic profiles of CTCs, PSA, and latent variable.
The model was also used to simulate three typical regimens with population parameter estimates: (1) a patient receiving six cycles of chemotherapy following a classical design over 180 days; (2) a patient receiving six cycles of hormonotherapy following a classical design over 180 days; and (3) a patient receiving simultaneously six cycles of chemotherapy and hormonotherapy over 180 days.
Finally, an instantaneous increase (doubling) of the latent variable was simulated with a Heaviside function, and simulated PSA and CTC profiles were compared. The time to reach 90% of the steady-state level for both markers was assessed. A total of 500 individual simulated profiles, taking into account the interindividual variability, were also explored.
RESULTS
Model characteristics
The structure of the proposed model is described in Figure 1. It required consideration of four levels of complexity, as follows.
Figure 1.
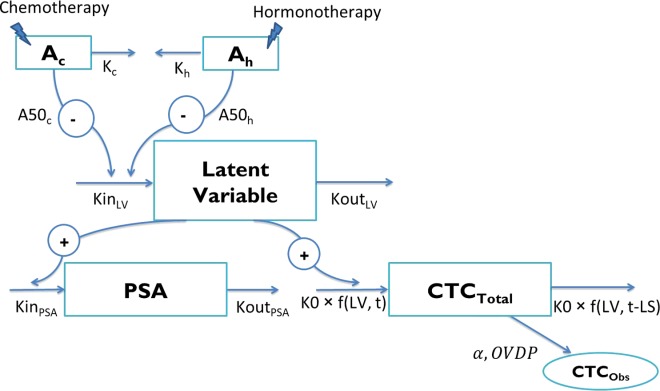
Structure of the model. Ac and Ah represent drug amounts in the chemotherapy and hormonotherapy compartments, respectively (arbitrary unit (AU)). Kc and Kh are the chemotherapy and hormonotherapy kinetic rate constants, respectively (day−1). A50c and A50h are the amounts of each treatment producing 50% of the maximum effect (AU), respectively. KinLV and KoutLV are the latent variable production and elimination rate constants (AU.day−1 and day−1), respectively. KinPSA and KoutPSA correspond to the prostate-specific antigen (PSA) production and elimination rate constants (ng.mL−1.day−1.AU−1 and day−1), respectively. K0 is the circulating tumor cells (CTC) production rate (CTC.day−1.AU−1). CTCTotal and CTCObs are the CTC counts in the total body blood and in the aliquot, respectively. α corresponds to the scaling factor and OVDP to the overdispersion parameter. LV, latent variable.
Drug effect kinetics
Because no drug concentration data were available, a K-PD approach was applied to model the kinetics of the drug actions.31 Two different K-PD compartments were used to describe the drug effect kinetics for chemotherapy and hormonotherapy administrations, thus allowing the estimations of different kinetics and efficacy parameters for each treatment.
Dynamic relationships between PSA and CTC kinetics
PSA and CTCs kinetics were assumed to be triggered by a common unobserved latent variable. The latent variable kinetics was described by a non-steady-state indirect model, with zero-order production and first-order elimination rates.32 Each treatment acted as an inhibitor of the latent variable production, following a saturable (Emax) process.
To allow the latent variable to increase, the baseline latent variable (LV0) was constrained to be less than the steady-state condition, defined as follows:
where SFLV could have a positive or negative value. Because no information was available concerning the latent variable, LV0 was fixed to 1; thus, LV corresponded to the fractional change in the latent variable from baseline. As a consequence, the inverse-logit function was applied on
Joint modeling of two types of data
The latent variable was supposed to enhance the production of PSA and CTCs. The PSA concentration kinetics (continuous data) was described by a non-steady-state model with zero-order production and first-order elimination rates.32 The discrete processes for CTC kinetics (count data) in the total body blood were characterized by a cell lifespan model.22
Random sampling of CTCs
The observed CTC count was considered as a random sampling from a Poisson law family. The best model was the negative binomial distribution with a mean of λ and a variance of . This model allowed taking into account the overdispersion, characterized by a variance greater than the mean of the observed CTC counts.
Model formalization
Structural model
The proposed model, shown in Figure 1, was defined by the following equations:
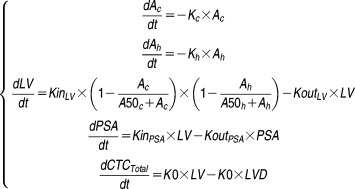 |
Ac and Ah represent drug amounts in the chemotherapy and the hormonotherapy K-PD compartments, respectively (arbitrary unit (AU)). Kc and Kh are the chemotherapy and hormonotherapy kinetics rate constants (day−1), respectively. A50c and A50h are the amounts of each treatment producing 50% of the maximum effect (AU). LV corresponds to the latent variable (AU), and KinLV and KoutLV are their production rate and elimination rate constants (AU.day−1 and day−1), respectively. LVD corresponds to the latent variable delayed by the lifespan (AU) (detailed in Supplementary Figure S2). KinPSA and KoutPSA are the PSA production and elimination rate constants (ng.mL−1.day−1.AU−1 and day−1), respectively. K0 is the CTC production rate (CTC.day−1.AU−1).
The initial conditions of the model at time 0 were as follows:
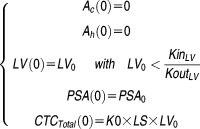 |
LV0 and PSA0 are the initial latent variable value (AU) and the initial PSA concentration (ng.mL−1), respectively. LS corresponds to the CTC lifespan (day).
Individual parameter distributions in the population
The individual parameters were assumed to be normally distributed for K0 and LS parameters and log-normally distributed for all other parameters, allowing for the estimation of correlations between parameters.
Observation model for PSA and CTCs
Unexplained residual variability for PSA kinetics was modeled using an exponential residual error model, written as an additive model for the log-transformed PSA observations and predictions (log-transformation both sides).
Assuming a homogeneous distribution of CTCs, the expected number of CTCs (λ) was scaled by the total CTC count obtained with the cell lifespan model:
where
Finally, the observed CTC count was a random sampling from a negative binomial distribution with a mean of λ. The probability of observing a number of CTCs equal to n was calculated as:
where Γ and n! are the gamma and factorial functions, respectively. OVDP is the overdispersion parameter, allowing for estimating a variance greater than the mean.
The NONMEM code implementing this model is presented in Supplementary Material 3.
Model evaluation
According to goodness-of-fit plots presented in Figure 2, PSA kinetics in treated patients with mCRPC was properly fit over the six-month period, and VPC showed good agreement between the distributions of observed and simulated values.
Figure 2.
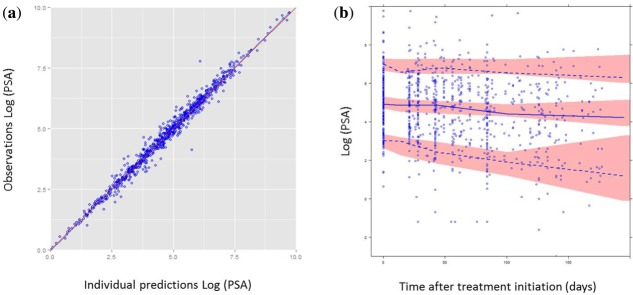
Evaluation of the model capacity to predict prostate-specific antigen (PSA). (a) Observed logarithms of PSA are plotted vs. individual transformed predictions. Red line is the identity line. (b) Visual predictive check (VPC): log-transformed PSA values are plotted vs. time. Red areas represent the 95% confidence intervals of the 5th, 95th, and 50th percentiles of simulated data. Blue dots are the observed values. Blue lines represent the median (solid line), and the 5th and 95th percentiles (dashed lines) of the observations.
The predictive performance for the CTC counts was assessed with simulation-based diagnostics: categorical VPCs and overdispersion plot. These graphics are presented in Figure 3 and show that both the probability for a given number of CTCs and the overdispersion were described well by the model simulations. It also shows the consistency between the observed proportion of CTCs equal to 0 and the simulated ones. Finally, a categorical VPC for the frequently used dichotomized CTC count (<5 vs. ≥ 5) was performed and confirmed the acceptable predictive performance of the model (Supplementary Figure S3).
Figure 3.
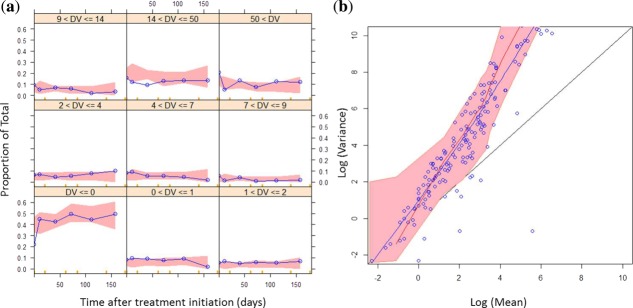
Evaluation of the model capacity to predict circulating tumor cell (CTC) counts. (a) Categorical visual predictive checks (VPCs): the probability of having a number of CTCs for different CTC count categories was plotted vs. time. Red areas are the 95% confidence intervals of the simulated median probabilities. Blue lines are the observed probabilities. (b) Overdispersion plot: the logarithms of variance were plotted vs. the logarithms of mean. Black line is the identity line. Blue dots are the observations, and the blue line a lowess of the observations. Red line corresponds to the median of simulated data, and the red area to its 95% predicted interval.
Parameter interpretation
Parameter estimates are reported in Table 2. RSEs of typical mean parameters and interindividual variability, representative of estimation precision, were all <20%. Because of the heterogeneity of the data, interindividual variability values were large, but supported by satisfactory RSE and shrinkage values. Correlations between interindividual variability parameters were estimated; for instance, K0 was highly correlated with LS (correlation = 0.99) and KinPSA highly correlated with PSA0 (correlation = 0.92).
Table 2.
Parameter estimates
| Parameter (unit) | Estimate | RSE estimate (%) | IIV (CV %) | RSE IIV (%) | Shrinkage (%) |
|---|---|---|---|---|---|
| Kc (day−1) | 0.248 | 4 | 85 | 3 | 63 |
| Kh (day−1) | 0.449 | 5 | 135 | 3 | 51 |
| A50c (AU) | 0.0003 | 17 | 218 | 8 | 27 |
| A50h (AU) | 0.004 | 12 | 168 | 1 | 29 |
| LV0 (AU) | 1 FIX | – | 0 FIX | – | – |
| KoutLV (day−1) | 0.00513 | 20 | 450 | 13 | 36 |
| SFLV (AU.day−1) | 6.33 | 1 | 89 | 6 | 27 |
| KinPSA (ng.mL−1.day−1.AU−1) | 1.40 | 9 | 161 | 5 | 6 |
| KoutPSA (day−1) | 0.00813 | 9 | 124 | 4 | 21 |
| PSA0 (ng.mL−1) | 153 | 8 | 155 | 2 | 1.4 |
| K0 (CTC.day−1.AU−1) | 308 | 1 | 12 | 2 | 59 |
| LS (day) | 58 | 1 | 14 | 2 | 59 |
| OVDP (AU) | 4.9 | 4 | 150 | 1 | 17 |
| PSA res error | 0.3 | 1 | 0 FIX | – | – |
RSE, relative standard error; IIV, interindividual variability; CV, coefficient of variation; FIX, fixed value (not estimated); AU, arbitrary unit; CTC, circulating tumor cell; PSA, prostate-specific antigen; LV, latent variable; Kc, chemotherapy kinetic rate constant; Kh, hormonotherapy kinetic rate constant; A50c, amount of chemotherapy producing 50% of the maximum effect; A50h, amount of hormonotherapy producing 50% of the maximum effect; LV0, baseline LV; KoutLV, LV elimination rate constant; SFLV, scaling factor for LV production constant; KinPSA, PSA production constant; KoutPSA, PSA elimination rate constant; PSA0, baseline PSA; K0, CTC production rate; LS, lifespan; OVDP, overdispersion parameter.
Parameter estimates showed that chemotherapy had a greater inhibiting potency than hormonotherapy, as expected (A50c=0.0003; A50h=0.004; A50h=13*A50c). The CTC lifespan (LS) was estimated at 58 days, and its production rate (K0) at 308 CTC.day−1.AU−1. The PSA half-life (computed as ) was estimated at 85 days, and its production rate (KinPSA) at 1.4 ng.mL−1.day−1.AU−1. The ratio of production rates (
 ) was equal to 0.004 ng.mL−1.CTC−1.
Sensitivity of simulated PSA and CTC kinetics
Thanks to the interindividual variability, the model allowed simulations of different types of individual kinetic profiles, similar to those observed, as illustrated in Supplementary Figure S1c.
Furthermore, simulations using the model and population parameters were performed under different treatment types. Three kinetic profiles of a typical patient were assessed until 300 days (Figure 4): (1) receiving chemotherapy alone; (2) receiving hormonotherapy alone; and (3) receiving both simultaneously. A larger inhibition effect of chemotherapy compared to hormonotherapy was observed. The model allowed regrowth of both biomarkers after stopping treatment. The magnitude and rate of changes were more important for CTCs than for PSA.
Figure 4.
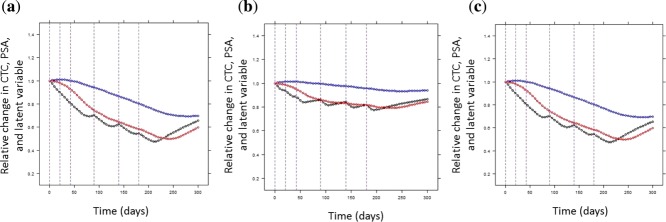
Simulations under different treatment regimens. The circulating tumor cell (CTC), prostate-specific antigen (PSA), and the latent variables, all normalized by their baseline values, were plotted vs. time. Different typical patients were represented: (a) receiving chemotherapy alone, (b) hormonotherapy alone, or (c) both simultaneously. Blue curves represent the PSA kinetics, red curves the CTC kinetics, and black curves the latent variable kinetics. Vertical lines represent the treatment cycles.
Finally, simulations were used to explore the sensitivity of PSA and CTC kinetics to changes in the latent variable values. Simulated PSA and CTC kinetics were compared after doubling the latent variable. According to Figure 5, CTCs reached 90% of steady-state at 195 days, whereas PSA reached it at 355 days; accounting for interindividual variability, 91% of simulated patients showed a faster variation in CTC than PSA after latent variable increase. Therefore, the CTC kinetics seemed to be more sensitive to variations of the latent variable in most of the patients. Similar results were obtained when halving the latent variable (not shown).
Figure 5.
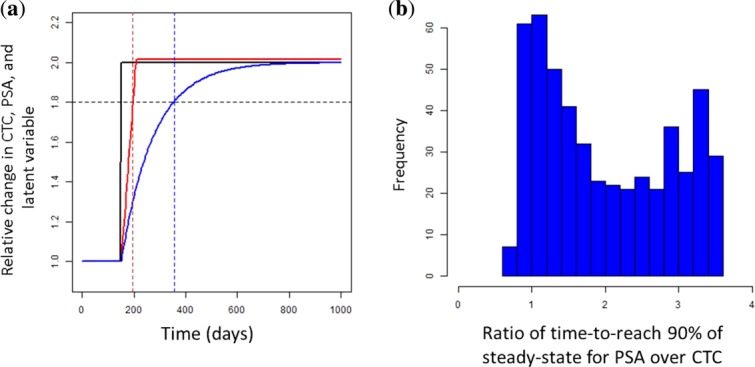
(a) Simulations of prostate-specific antigen (PSA) and circulating tumor cell (CTC) kinetics under latent variable changes. CTCs, PSA, and the latent variables, all normalized by their baseline values, were plotted vs. time. Black curves represent the latent variable kinetics, red curves the CTC kinetics, and blue curves the PSA kinetics. Blue and red vertical dashed lines correspond to the time at which the PSA and CTC reached 90% of steady-state. Black horizontal dashed line is the 90% steady-states. (b) Distribution of the ratio of time-to-reach 90% of steady-state for PSA over CTC, in a simulated population of 500 patients.
DISCUSSION
Assessment of treatment efficacy in patients with mCRPC is a critical medical issue because of the inefficiency of morphological imaging tests for monitoring clinical response. The PSA is the most widely used serum tumor marker, but its surrogacy value is questioned.5,6 PSA may soon be replaced by CTC counting, which seems to be a promising prognostic and predictive marker of survival and treatment efficacy.13–15
The semimechanistic model reported here is the first to quantify the joint dynamic relationships between the kinetics of PSA and CTC count in patients with mCRPC. This atypical model combines several advanced features in pharmacometrics: K-PD modeling, joint modeling of count and continuous data, both driven by a common latent variable, and the discrete processes for CTCs, modeled by a cell lifespan model combined with random sampling statistics. To simplify, the latent variable might be interpreted as the nonmeasured tumor burden producing CTCs and PSA. This model allowed taking into account the major challenges for CTC detection and enumeration: (1) the discrete process; (2) the Poisson-distributed sampling error; (3) the overdispersion; and (4) the high number of CTC counts equal to 0. This report represents the first use of a cell lifespan model to describe CTC kinetics. Moreover, although the Poisson process was already used to take into account the sampling of blood collection for CTC, this article describes the first application of negative binomial distribution to model the overdispersion in this context.9 Failure to address such phenomena may lead to underestimation of standard errors.23
Internal evaluation, based on goodness-of-fit plots and simulation-based diagnostics, demonstrated the good predictive ability of the model for the kinetics of PSA and CTC count. The model enabled estimations of important kinetic parameters, such as PSA and CTC production, CTC lifespan, and their respective interindividual variabilities. The estimated PSA half-life of 85 days was in agreement with literature data.33 The CTC lifespan was estimated at 58 days; obtaining an experimental estimate of CTC lifespan is difficult, because of the high rate of null counts and the time-varying production rate, scientific literature on this topic is conflicting.34,35
The second main finding of the present study is the ability to generate by simulations the PSA, CTC, and latent variable kinetic profiles under different treatments, including chemotherapy and/or hormonotherapy agents. The model was also used to simulate PSA and CTC kinetics under different types of latent variable changes. According to these simulations, CTC count seems to be more sensitive to the variation of the latent variable and seems to be an earlier biomarker compared to PSA. Although CTC and PSA are causally related to the same process, differences in their practical impact may arise from different kinetics and sensitivity (in the sense of magnitude of the biomarker variation in response to a given variation of the latent variable time to reach the equilibrium). The higher sensitivity of CTC counts over PSA concentration is consistent with the shorter half-life of CTC. These observations support the previous results showing the greater prediction potency of CTC compared to PSA.13–15 Moreover, both biomarkers are causally related to the tumor burden and, hence, both should be used and fitted together to improve the prediction of the tumor size.
Nevertheless, some limitations may reduce the impact of the outcomes presented here. The use of an indirectly measurable latent variable with uncertain physiological meaning is confusing and debatable for nonmodelers. Integration of longitudinal tumor burden observations with a tumor growth inhibition model could improve the model and its interpretation. The present semimechanistic model undoubtedly simplifies the reality of actual biological processes. For instance, Kim et al.36 recently showed that CTCs can also reseed the organ of origin via the circulatory system and express factors leading to accelerated tumor growth and angiogenesis. This process, called “tumor self-seeding,” was not taken into account in our model. Because of these limitations, the results of the present model need to be confirmed. External validation of the CTC kinetic model is planned using another mCRPC database.
Nevertheless, this model is the first to quantify the dynamic links between the kinetics of PSA and CTC count during treatment in patients with mCRPC. It could serve as a general framework that could be applied to other cancer types in order to compare the properties of CTCs. Application of the CTC kinetic model in patients treated with other drugs is also under consideration. Finally, the mixed effect model allows identifying covariates and quantifying their impact on CTC kinetics. In particular, pharmacogenomic data could be tested to identify patients for whom CTC counting is the most sensitive.
In the future, the present model will be challenged to establish a link between a CTC kinetic parameter and survival and to compare the sensitivity and specificity of PSA and CTC count for predicting treatment efficacy. A link between the latent variable and survival will also be tested. If relationships between a CTC kinetic parameter and efficacy outcomes are confirmed and found to be more predictive than those of PSA, longitudinal CTC kinetics modeling may have several applications. In drug development, monitoring CTC kinetics may be used to identify the best drug candidates and reduce the timeline required for clinical trials.37 CTC kinetic parameters may also be used to predict future treatment efficacy or risk of early progression and the potential need for early treatment adjustment.
Acknowledgments
Emilie Hénin was funded by Fondation Synergie Lyon Cancer and La Ligue Nationale contre le Cancer.
Conflict of Interest
The authors report no conflicts of interest.
Author Contributions
M.W., M.T., G.F., B.Y., and E.H. wrote the manuscript. J.B., B.Y., and E.H. designed the research. M.W., J.B., D.L., J.M., B.Y., and E.H. performed the research. M.W., M.T., B.Y., and E.H. analyzed the data.
Supporting Information
Additional Supporting Information may be found in the online version of this article.
Supporting Information
References
- Jemal A, Bray F, Center MM, Ferlay J, Ward E. Forman D. Global cancer statistics. CA Cancer J. Clin. 2011;61:69–90. doi: 10.3322/caac.20107. [DOI] [PubMed] [Google Scholar]
- Bubendorf L, et al. Metastatic patterns of prostate cancer: an autopsy study of 1,589 patients. Hum. Pathol. 2000;31:578–583. doi: 10.1053/hp.2000.6698. [DOI] [PubMed] [Google Scholar]
- Scher HI, et al. Design and end points of clinical trials for patients with progressive prostate cancer and castrate levels of testosterone: recommendations of the Prostate Cancer Clinical Trials Working Group. J. Clin. Oncol. 2008;26:1148–1159. doi: 10.1200/JCO.2007.12.4487. [DOI] [PMC free article] [PubMed] [Google Scholar]
- Wang MC, Valenzuela LA, Murphy GP. Chu TM. Purification of a human prostate specific antigen. Invest. Urol. 1979;17:159–163. [PubMed] [Google Scholar]
- Almufti R, et al. A critical review of the analytical approaches for circulating tumor biomarker kinetics during treatment. Ann. Oncol. 2014;25:41–56. doi: 10.1093/annonc/mdt382. [DOI] [PubMed] [Google Scholar]
- Petrylak DP, et al. Evaluation of prostate-specific antigen declines for surrogacy in patients treated on SWOG 99-16. J. Natl. Cancer Inst. 2006;98:516–521. doi: 10.1093/jnci/djj129. [DOI] [PubMed] [Google Scholar]
- Allard WJ, et al. Tumor cells circulate in the peripheral blood of all major carcinomas but not in healthy subjects or patients with nonmalignant diseases. Clin. Cancer Res. 2004;10:6897–6904. doi: 10.1158/1078-0432.CCR-04-0378. [DOI] [PubMed] [Google Scholar]
- Ashworth TR. A case of cancer in which cells similar to those in the tumours were seen in the blood after death. Med. J. Aust. 1869;14:146–147. [Google Scholar]
- Tibbe AG, Miller MC. Terstappen LW. Statistical considerations for enumeration of circulating tumor cells. Cytometry A. 2007;71:154–162. doi: 10.1002/cyto.a.20369. [DOI] [PubMed] [Google Scholar]
- Liberko M, Kolostova K. Bobek V. Essentials of circulating tumor cells for clinical research and practice. Crit. Rev. Oncol. Hematol. 2013;88:338–356. doi: 10.1016/j.critrevonc.2013.05.002. [DOI] [PubMed] [Google Scholar]
- Cohen SJ, et al. Relationship of circulating tumor cells to tumor response, progression-free survival, and overall survival in patients with metastatic colorectal cancer. J. Clin. Oncol. 2008;26:3213–3221. doi: 10.1200/JCO.2007.15.8923. [DOI] [PubMed] [Google Scholar]
- Cristofanilli M, et al. Circulating tumor cells, disease progression, and survival in metastatic breast cancer. N. Engl. J. Med. 2004;351:781–791. doi: 10.1056/NEJMoa040766. [DOI] [PubMed] [Google Scholar]
- de Bono JS, et al. Circulating tumor cells predict survival benefit from treatment in metastatic castration-resistant prostate cancer. Clin. Cancer Res. 2008;14:6302–6309. doi: 10.1158/1078-0432.CCR-08-0872. [DOI] [PubMed] [Google Scholar]
- Goldkorn A, et al. Circulating tumor cell counts are prognostic of overall survival in SWOG S0421: a phase III trial of docetaxel with or without atrasentan for metastatic castration-resistant prostate cancer. J. Clin. Oncol. 2014;32:1136–1142. doi: 10.1200/JCO.2013.51.7417. [DOI] [PMC free article] [PubMed] [Google Scholar]
- Scher HI, et al. Evaluation of circulating tumor cell (CTC) enumeration as an efficacy response biomarker of overall survival (OS) in metastatic castration-resistant prostate cancer (mCRPC): planned final analysis (FA) of COU-AA-301, a randomized double-blind, placebo-controlled phase III study of abiraterone acetate (AA) plus low-dose prednisone (P) post docetaxel. J. Clin. Oncol. 2011;29(suppl; abstract LBA4517):293s. [Google Scholar]
- Coumans FA, Ligthart ST. Terstappen LW. Interpretation of changes in circulating tumor cell counts. Transl. Oncol. 2012;5:486–491. doi: 10.1593/tlo.12247. [DOI] [PMC free article] [PubMed] [Google Scholar]
- Scher HI, et al. Circulating tumour cells as prognostic markers in progressive, castration-resistant prostate cancer: a reanalysis of IMMC38 trial data. Lancet Oncol. 2009;10:233–239. doi: 10.1016/S1470-2045(08)70340-1. [DOI] [PMC free article] [PubMed] [Google Scholar]
- Bock JL. Klee GG. How sensitive is a prostate-specific antigen measurement? How sensitive does it need to be? Arch. Pathol. Lab. Med. 2004;128:341–343. doi: 10.5858/2004-128-341-HSIAPA. [DOI] [PubMed] [Google Scholar]
- Beal SL. Ways to fit a PK model with some data below the quantification limit. J. Pharmacokinet. Pharmacodyn. 2001;28:481–504. doi: 10.1023/a:1012299115260. [DOI] [PubMed] [Google Scholar]
- Bonate PL. Suttle AB. Modeling tumor growth kinetics after treatment with pazopanib or placebo in patients with renal cell carcinoma. Cancer Chemother. Pharmacol. 2013;72:231–240. doi: 10.1007/s00280-013-2191-0. [DOI] [PubMed] [Google Scholar]
- Ribba B, et al. A review of mixed-effects models of tumor growth and effects of anticancer drug treatment used in population analysis. CPT Pharmacometrics Syst. Pharmacol. 2014;3:e113. doi: 10.1038/psp.2014.12. [DOI] [PMC free article] [PubMed] [Google Scholar]
- Krzyzanski W. Perez Ruixo JJ. Lifespan based indirect response models. J. Pharmacokinet. Pharmacodyn. 2012;39:109–123. doi: 10.1007/s10928-011-9236-y. [DOI] [PMC free article] [PubMed] [Google Scholar]
- Plan EL, Maloney A, Trocóniz IF. Karlsson MO. Performance in population models for count data, part I: maximum likelihood approximations. J. Pharmacokinet. Pharmacodyn. 2009;36:353–366. doi: 10.1007/s10928-009-9126-8. [DOI] [PubMed] [Google Scholar]
- Beal SL, Sheiner LB, Boeckmann A. Bauer RJ. NONMEM user's guides (1989–2009) Ellicott City, MD: Icon Development Solutions; 2009. [Google Scholar]
- Perez-Ruixo JJ, Kimko HC, Chow AT, Piotrovsky V, Krzyzanski W. Jusko WJ. Population cell life span models for effects of drugs following indirect mechanisms of action. J. Pharmacokinet. Pharmacodyn. 2005;32:767–793. doi: 10.1007/s10928-005-0019-1. [DOI] [PubMed] [Google Scholar]
- Jonsson EN. Karlsson MO. Xpose–an S-PLUS based population pharmacokinetic/pharmacodynamic model building aid for NONMEM. Comput. Methods Programs Biomed. 1999;58:51–64. doi: 10.1016/s0169-2607(98)00067-4. [DOI] [PubMed] [Google Scholar]
- Lindbom L, Ribbing J. Jonsson EN. Perl-speaks-NONMEM (PsN)–a Perl module for NONMEM related programming. Comput. Methods Programs Biomed. 2004;75:85–94. doi: 10.1016/j.cmpb.2003.11.003. [DOI] [PubMed] [Google Scholar]
- R Development Core Team. R: a language and environment for statistical computing. (Vienna, Austria, R Foundation for Statistical Computing, 2010)
- [No authors listed] Guidance for industry on population pharmacokinetics; availability. Food and Drug Administration, HHS. Notice. Fed. Regist. 1999;64:6663–6664. [PubMed] [Google Scholar]
- Yano Y, Beal SL. Sheiner LB. Evaluating pharmacokinetic/pharmacodynamic models using the posterior predictive check. J. Pharmacokinet. Pharmacodyn. 2001;28:171–192. doi: 10.1023/a:1011555016423. [DOI] [PubMed] [Google Scholar]
- Jacqmin P, et al. Modelling response time profiles in the absence of drug concentrations: definition and performance evaluation of the K-PD model. J. Pharmacokinet. Pharmacodyn. 2007;34:57–85. doi: 10.1007/s10928-006-9035-z. [DOI] [PubMed] [Google Scholar]
- Dayneka NL, Garg V. Jusko WJ. Comparison of four basic models of indirect pharmacodynamic responses. J. Pharmacokinet. Biopharm. 1993;21:457–478. doi: 10.1007/BF01061691. [DOI] [PMC free article] [PubMed] [Google Scholar]
- Emmenegger U. Ko YJ. PSA-based treatment response criteria in castration-resistant prostate cancer: promises and limitations. Can. Urol. Assoc. J. 2009;3:375–376. doi: 10.5489/cuaj.1146. [DOI] [PMC free article] [PubMed] [Google Scholar]
- Meng S, et al. Circulating tumor cells in patients with breast cancer dormancy. Clin. Cancer Res. 2004;10:8152–8162. doi: 10.1158/1078-0432.CCR-04-1110. [DOI] [PubMed] [Google Scholar]
- Stott SL, et al. Isolation and characterization of circulating tumor cells from patients with localized and metastatic prostate cancer. Sci. Transl. Med. 2010;2:25ra23. doi: 10.1126/scitranslmed.3000403. [DOI] [PMC free article] [PubMed] [Google Scholar]
- Kim MY, et al. Tumor self-seeding by circulating cancer cells. Cell. 2009;139:1315–1326. doi: 10.1016/j.cell.2009.11.025. [DOI] [PMC free article] [PubMed] [Google Scholar]
- Kola I. Landis J. Can the pharmaceutical industry reduce attrition rates? Nat. Rev. Drug Discov. 2004;3:711–715. doi: 10.1038/nrd1470. [DOI] [PubMed] [Google Scholar]
Associated Data
This section collects any data citations, data availability statements, or supplementary materials included in this article.
Supplementary Materials
Supporting Information


