Abstract
Adenocarcinoma is a histologic diagnosis based on subjective findings. Transcriptional profiles have been used to differentiate normal tissue from disease and could provide a means of identifying malignancy. The goal of this study was to generate and test transcriptomic profiles that differentiate normal from adenocarcinomatous rectum. Comparisons were made between cDNA microarrays derived from normal epithelium and rectal adenocarcinoma. Results were filtered according to standard deviation to retain only highly dysregulated genes. Genes differentially expressed between cancer and normal tissue on two-groups t test (P < 0.05, Bonferroni P value adjustment) were further analyzed. Genes were rank ordered in terms of descending fold change. For each comparison (tumor versus normal epithelium), those 5 genes with the greatest positive fold change were grouped in a classifier. Five separate tests were applied to evaluate the discriminatory capacity of each classifier. Genetic classifiers derived comparing normal epithelium with malignant rectal epithelium from pooled stages had a mean sensitivity and specificity of 99.6% and 98.2%, respectively. The classifiers derived from comparing normal and stage I cancer had comparable mean sensitivities and specificities (97% and 98%, respectively). Areas under the summary receiver-operator characteristic curves for each classifier were 0.981 and 0.972, respectively. One gene was common to both classifiers. Classifiers were tested in an independent Gene Expression Omnibus–derived dataset. Both classifiers retained their predictive properties. Transcriptomic profiles comprising as few as 5 genes are highly accurate in differentiating normal from adenocarcinomatous rectal epithelium, including early-stage disease.
Key words: Rectal cancer, Transcriptomic profiles, Classifier, Diagnostic accuracy
Traditionally, malignancy is identified based on a set of histologic features. Identification of these features requires review by a histopathologist and is frequently the subject of debate. It is not uncommon, in the surgical context, to obtain reports such as “at least invasive adenocarcinoma” or “suspicious for adenocarcinoma,” indicating that the identification of malignancy could be prone to subjective interpretation. There are several additional circumstances in which diagnostic error may occur when relying on histopathologic review. For example, heterogeneity of distribution of tissue within a polyp or villous adenoma reduces the sensitivity of a biopsy and often necessitates definitive surgical removal for diagnosis.1,2 Given the above, definitive histologic reports can sometimes take several weeks to generate. An objective mechanism for identifying malignancy in epithelial samples could help address some of these issues.
In transcriptomics, classifiers derived from gene expression profiles may help characterize cell states in an objective manner.3,4 They have been broadly applied in colon and rectal cancer, both separately and in combination.4–6 This group has previously shown that high-throughput arrays identify distinct genetic profiles associated with lymph node involvement in rectal cancer.7 Transcriptomic classifiers are derived from differences in gene expression, which in turn are based on objective measurements of expression. Thus, they are not subject to interindividual variation. Variation may be associated with platform type and stringency of the bioinformatic workflow process.8,9 This, however, is obviated in standardized approaches.10 Thus, transcriptomic classifiers derived using a standardized bioinformatics workflow may offer an objective means of determining disease state.
To date, no study has examined the potential differences in transcriptomic profiles between normal and adenocarcinomatous rectal epithelium. This is surprising, because such differences could provide key insights into the neoplastic process within the rectum.11,12 Transcriptomic profiles derived from normal rectal epithelium have been compared with those from adenomatous polyps and colon cancer only.13–15 Given the above, we aimed to apply a transcriptomic approach to identifying differences between normal and adenocarcinomatous rectal epithelium. The aim was to generate classifiers that could in turn enable the objective discrimination of normal from neoplastic epithelium within the rectum. Such classifiers (being composed of differentially expressed genes) would be informative in relation to disease process, but would also provide a clear-cut means of identifying malignancy.
Materials and Methods
Following ethics approval and informed consent, samples of neoplastic and normal rectal epithelium were retrieved from a prospectively collected colorectal cancer biobank at the Cleveland Clinic (Cleveland, Ohio). This biobank was populated with rectal cancer tissue (obtained from surgical resection specimens) and normal rectal tissue. Normal rectal mucosa, and stage I, stage II, and stage III rectal cancers were included in the analysis. Cases were staged according to the American Joint Committee on Cancer 7th edition. Tissue was snap frozen and maintained at −80°C. In order to eliminate a confounding influence of radiation effect on tissues, cases receiving neoadjuvant treatment were excluded from the study population.
Tissue preparation
As previously described by this group,7 total RNA was extracted form fresh frozen tissue using an RNAqueous kit (Ambion, Austin, Texas). Tissue blocks were macrodissected to minimize normal tissue. Tissue was sectioned on a cryostat into 12 × 10 μm–thick shavings. The tissue was suspended in 800 μL of lysis/binding solution and homogenized by passing through an 18-guage needle and syringe 10 times. The RNA was treated with DNase using TURBO DNA-free (Ambion). Spectrophotometry using optical density readings 260/280 was used to quantify RNA samples.
Each specimen was run on a 1% agarose gel to ensure a lack of degradation prior to hybridization. The RNA was assayed for whole-genome gene expression using 48,701 transcript-specific sequences on the Illumina Human-6 Expression v2 Beadchip (Illumina, San Diego, California). RNA was amplified using an in vitro transcription amplification kit (Ambion) and hybridized to the platform using commercially available kits. Illumina Beadstation 500 software was used for imaging and normalization of data.
Microarray analysis
Data were generated on the Illumina Human-6 v2 single-colored bead chip microarray platform containing 48,701 transcripts. Expression data were compiled using Beadstudio (version 2). Data were imported to Chipster for bioinformatics appraisal. Quality control was on all quintile-normalized data. The Illumina Human-6 v2 is a single-color bead chip with probes derived from the National Center for Biotechnology Information Reference Sequence database. Quality control was conducted using nonmetric multidimensional scaling, preprocessing, and filtration.
Statistical analysis
Genes failing to display differential expression were filtered according to SD. Only genes distributed greater than 3 SDs from the mean were retained, excluding 99.7% of genes. Two-groups t test was used to identify genes differentially expressed between normal and neoplastic rectal tissue. A P value <0.05 was considered statistically significant. Bonferroni P value adjustment was applied to cater for multiple comparisons. The resultant list was further filtered according to fold change to create classifiers. The top 5 genes with the greatest fold change (in rectal adenocarcinoma with respect to normal epithelium) were retained and used as a classifier.
The validity of the classifier was characterized by internal cross-validation. Five separate classification techniques were applied: k nearest neighbor (knn), linear discriminant analysis (lda), quadratic discriminant analysis (qda), rpart, and support vector machine (svm), using R packages limma and local pooled error. This yielded 5 confusion matrices displaying true-positive, true-negative, false-positive, and false-negative results. Results are also displayed as sensitivity, specificity, and false-positive/false-negative rates. Summary receiver-operator characteristic curves (sROCs) were generated using the package “SROC” in R version 2.15. The area under the curve (AUC) represents the diagnostic accuracy of the classifier. This workflow was applied to: normal versus all stages of rectal adenocarcinoma (stages I–III) and normal versus stage I rectal adenocarcinoma. To determine the independent discriminatory properties of each classifier derived from the above comparisons, both classifiers were tested in an external dataset derived from Gene Expression Omnibus (GEO). GSE 41258 is a GEO sample series comprising expression data from 390 Affymetrix Human Genome U133A microarrays (65 of which were relevant to the current study). Raw data in relation to GSE 41258 were directly imported into Chipster and normalized. The search by gene name function was used to extract expression data of classifiers from the GSE 41258, and svm classification was applied to determine the accuracy of the classifier in distinguishing normal epithelium form rectal adenocarcinoma.
Both classifiers containing HUGO Gene Nomenclature Committee gene identifiers were imported into Ingenuity (ILP) (Redwood City, California) for functional annotation. Each identifier was mapped to a corresponding object in Ingenuity's Knowledge Base, and outputs (termed network eligible molecules) were overlaid onto a global molecular network. A “Core analysis” was conducted on all datasets, establishing the top-most associated diseases, molecular functions, canonical pathways, and transcription factors. The strengths of associations were established using a right-tailed Fisher exact test to calculate a P value, which determined the probability that each parameter (e.g., biologic function and/or disease) was associated because of chance alone (Ingenuity Systems). A canonical pathway analysis was conducted on the datasets. The significance of associations between datasets and canonical pathways was measured in two manners: (1) a ratio of the number of molecules from the dataset that map to the pathway divided by the total number of molecules that map to the canonical pathway is displayed, and (2) Fisher exact test was used to calculate a P value determining the probability that the association between the genes and the canonical pathway is explained by chance alone.
Results
Normal versus rectal adenocarcinoma stages I to III
Samples were derived from a cohort of 152 patients (27 normal epithelium and 125 rectal adenocarcinoma). Distribution of rectal cancers between stages was as follows: 49 (39.2%) stage I, 55 (44.0%) stage II, and 21 (16.8%) stage III. Preprocessing and filtering (according to SD) yielded 147 top differentially expressed genes between normal tissue and rectal cancer (all stages included). Of these genes, only those significantly differentially expressed (P < 0.05) on Empirical Bayes two-groups t test (with Bonferroni P value adjustment) were retained for further analysis. This yielded 123 genes. Results from the t test were further refined according to fold change. Genes were rank ordered according to descending fold change, and the top 5 were exported to a separate file (Table 1). This was termed a classifier. The classifiers were then subjected to 5 separate classification evaluations, yielding confusion matrices for each. Classification generated 2 separate output groups (knn, lvq, lda, and svm outputs were identical, whereas rpart separately produced a different classification output). The mean positive predictive value of the classifier was 99.6%, ranging from 99.2% to 100%. Mean negative predictive value was 98.2%, ranging from 96.3% to 100%. Mean sensitivity was 99.6%, ranging from 99.1% to 100%. Mean specificity was 98.2%, ranging from 96.3% to 100%. Mean false-positive rate was 1.9%, ranging from 0% to 3.7%. Mean false-negative rate was 0.4%, ranging from 0% to 0.8%. The predictive properties of the classifier were further assessed through the generation of an sROC. The AUC was 0.981 (Fig. 1).
Table 1.
List and description of the 5 genes with the greatest fold change in rectal adenocarcinoma (stages I–III) compared with normal rectal epithelium
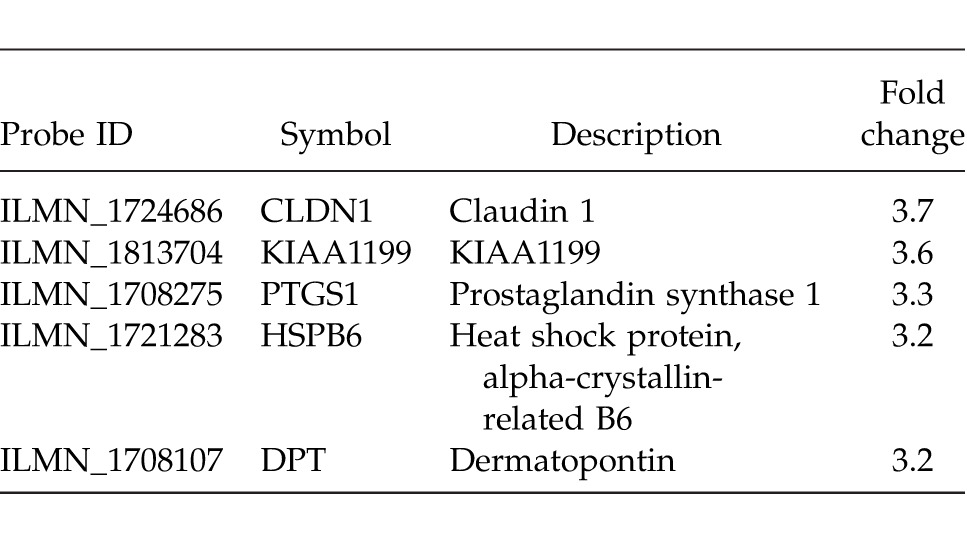
Fig. 1.
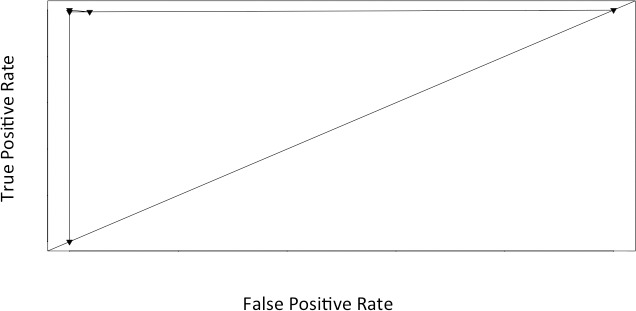
An sROC line graph displaying true- and false-positive rates (TPR and FPR, respectively) for normal versus rectal cancer stages I–III. The AUC (0.981) represents the accuracy of the classifier in discriminating normal epithelium and rectal adenocarcinoma stages I to III.
Sample clustering was represented in dendrogram format, demonstrating a clear-cut separation between normal and adenocarcinomatous rectal epithelium (Fig. 2). In Fig. 2, individual samples are arranged along the x-axis. Sample clusters are joined at nodes. The distance of the common node from the x-axis represents the relatedness of one cluster to another. The shorter the distance from the x-axis, the greater the degree of expression correlation between clusters. Samples within clusters are closely related, which is seen in Fig. 2. There is also a clear demarcation of clustering, with normal samples to the left and neoplastic samples to the right.
Fig. 2.
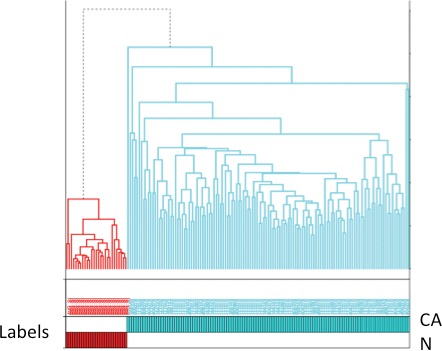
Dendrogram displaying the pattern of clustering of normal and rectal cancer specimens (stages I–III). Samples are arranged along the x-axis. Relatedness of clusters is represented by the distance from the x-axis. Normal rectum epithelial specimens are red, and rectal adenocarcinoma specimens are blue. N, normal epithelium; CA, rectal cancer.
Clustering was also represented in heat map form in which clustering according to sample association and gene expression was combined (Fig. 3). Probes representing KIAA1199 and claudin 1 were overexpressed in malignant tissue when compared with normal. The converse was true of the remaining probes (dermatopontin, heat shock protein alpha-crystallin-related B6). The pattern of expression of the 5 probes was fully reversed when comparing samples in the normal group with adenocarcinomatous epithelium (Fig. 3). Accuracy of probe clustering was demonstrated through resampling (bootstrapping). In Fig. 4, the green figure at the point of bifurcation of the probes indicates the degree to which clustering was supported. A figure greater than 90 indicates strong support for clustering. Results of bootstrapping were 100 between each probe, indicating strong support for clustering.
Fig. 3.
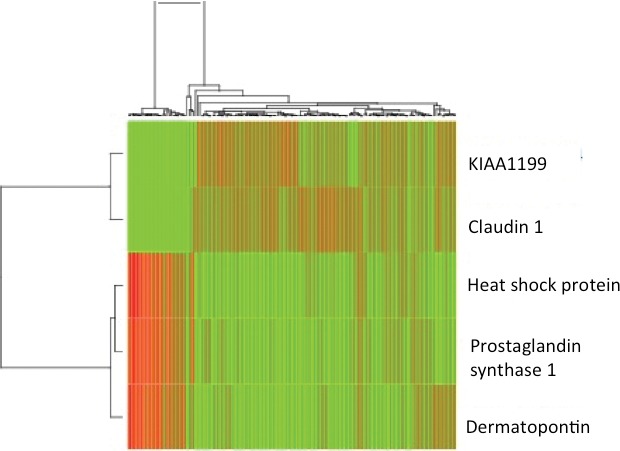
Heat map representing clustering according to sample association and gene expression combined (normal versus rectal cancer stages I–III combined). Genes displayed in the heat map are as follows: KIAA1199, claudin 1, Heat shock protein alpha-crystallin-related B6, and dermatopontin.
Fig. 4.
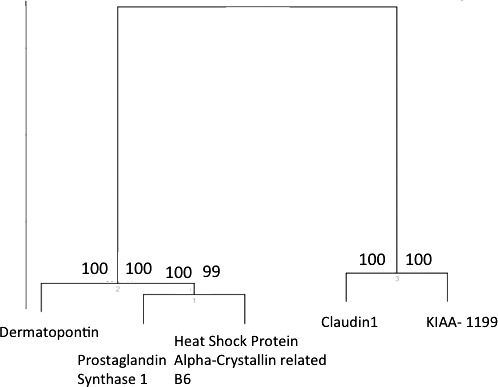
Results of bootstrapping derived from a comparison of normal epithelium and rectal adenocarcinoma (stages I–III).
Normal versus stage I rectal adenocarcinoma
After filtering according to SD and applying a t test with Bonferroni P value adjustment, 127 genes were differentially expressed. Genes with the greatest fold change (in rectal adenocarcinoma with respect to normal epithelium) are displayed in Table 2. Classification yielded 3 separate output groups (knn, lvq, and lda outputs were identical, whereas rpart and svm separately produced differing classification outputs). The mean positive predictive value was 99.3%, ranging from 97.7% to 100%. The mean negative predictive value was 96.5%, ranging from 93.1% to 100%. The mean sensitivity was 98.0%, ranging from 95.9% to 100%. The mean specificity was 98.8%, ranging from 96.3% to 100%. The mean false-positive rate was 1.2%, ranging from 0% to 3.7%. The mean false-negative rate was 2.0%, ranging from 0% to 4.1%. The predictive properties of the classifier were further assessed through the generation of an sROC curve for which the AUC was 0.972 (Fig. 5).
Table 2.
List and description of the 5 genes with the greatest fold change in rectal adenocarcinoma (stage I) compared with normal rectal epithelium
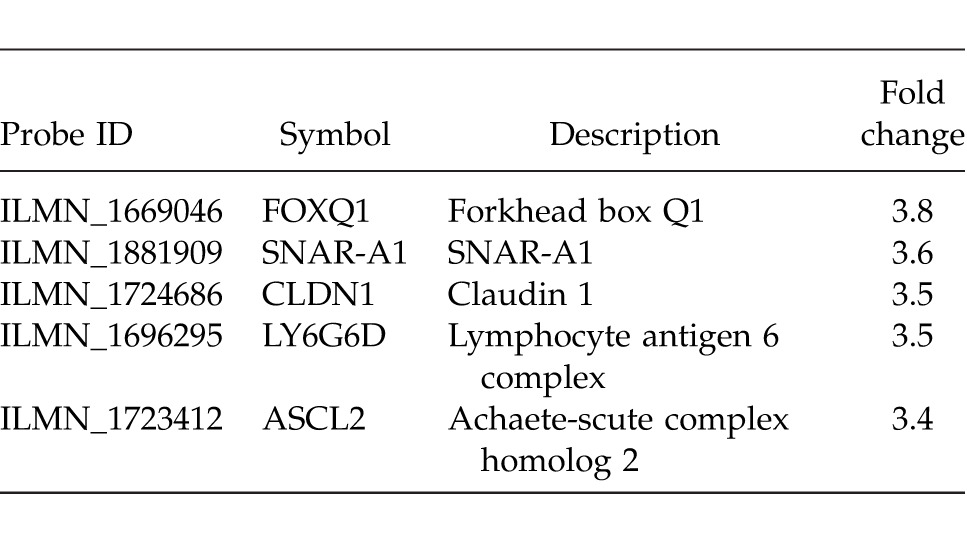
Fig. 5.
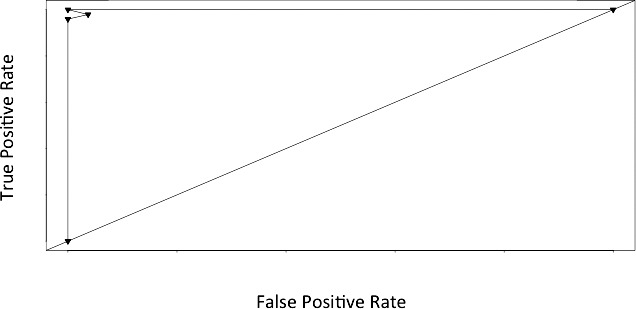
An sROC line graph displaying true- and false-positive rates (TPR and FPR, respectively) for normal versus rectal cancer stage I. The AUC (0.972) represents the accuracy of the classifier in discriminating normal epithelium and rectal adenocarcinoma stages I to III.
Clustering was again examined using dendrograms and heat mapping. Samples mixed to a greater degree than was observed above; however, clustering was still evident (Fig. 6). The node joining malignant and normal samples was 0.022 from the x-axis. On heat map inspection, separation according to tissue status (i.e., normal versus adenocarcinoma) was not as clear-cut but was apparent (Fig. 7). Accuracy of probe clustering was again assessed through bootstrapping (Fig. 8). All nodes except node three had a corresponding figure of greater than 90, indicating strong support for clustering.
Fig. 6.
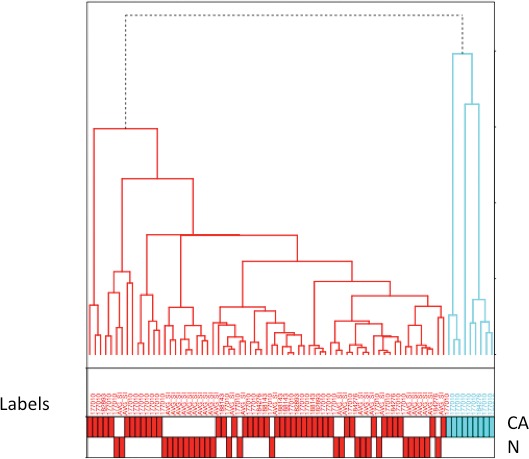
Dendrogram displaying the pattern of clustering of normal and rectal cancer specimens (stage I). Samples are arranged along the x-axis. Relatedness of clusters is represented by the distance from the x-axis. Normal rectum epithelial specimens are red, and rectal adenocarcinoma specimens are blue. N, normal epithelium; CA, rectal cancer.
Fig. 7.
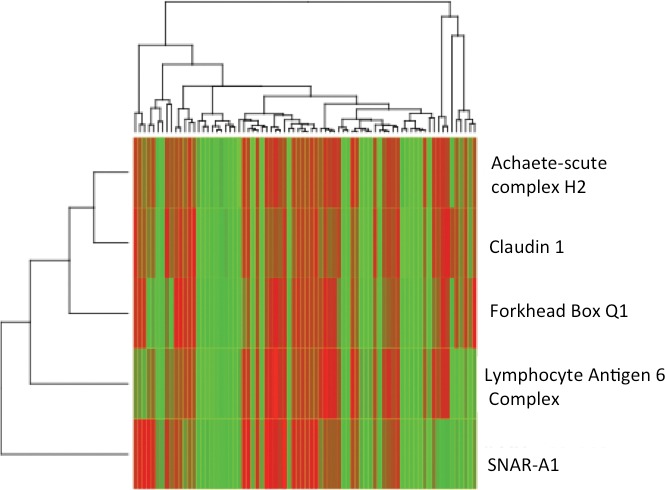
Heat map representing clustering according to sample association and gene expression combined (normal versus rectal cancer stage I).
Fig. 8.
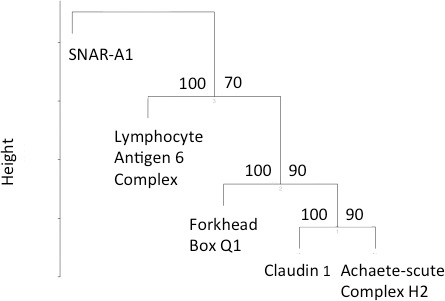
Results of bootstrapping derived from a comparison of normal epithelium and rectal adenocarcinoma (stage I).
Independent evaluation
GEO was searched for samples comparing rectal adenocarcinoma and normal rectal epithelium. GSE 41258 is a GEO sample series comprising expression data from 390 Affymetrix Human Genome U133A microarrays (65 of which were relevant to the current study).
The discriminatory properties of the 5 genes derived from a comparison of normal and rectal adenocarcinoma (stages I–III) were evaluated in GSE 41258. Using the “search by gene name” function, the 5 genes and their associated expression data were extracted from 65 relevant microarrays (13 rectal adenocarcinoma and 52 normal epithelium). The confusion matrix derived using svm classification demonstrated that of 13 rectal adenocarcinomas, none were misclassified as normal. Of 52 normal samples, 2 were misclassified as rectal adenocarcinoma. The classifier retained its predictive properties in this dataset: sensitivity (100%), specificity (98.7%), accuracy (98.2%), false-positive rate (0%), and false-negative rate (1.9%).
Next, the discriminatory properties of the classifier derived from a comparison of rectal adenocarcinoma stage I and normal rectal epithelium were tested in GSE 41258. The confusion matrix derived from classification (svm) demonstrated that of 4 stage I rectal adenocarcinomas, none were misclassified as normal. Of 52 normal samples, 1 was misclassified as rectal adenocarcinoma stage I. The classifier retained its predictive properties in GSE 41258: sensitivity (100%), specificity (96.2%), accuracy (96.9%), false-positive rate (0%), and false-negative rate (1.9%).
Intraclassifier and interclassifier comparison
Each classifier contained five genes. Claudin 1 occurred in each of the two classifiers and was overexpressed in neoplastic epithelium (i.e., relatively underexpressed in normal epithelium) in each case. The remaining 8 genes occurred in one classifier only, and thus no overlap between classifiers was observed for these.
Hypergeometric network linage analysis
A core analysis was conducted on both classifiers generated in the above bioinformatic process. Classifiers were characterized in terms of associated networks, molecular and physiologic functions, disease, and canonical pathways. The top biologic functions associated with the classifier derived from a comparison of normal epithelium and rectal adenocarcinoma (stages I–III) were as follows: cell-to-cell signaling and interaction, cellular assembly and organization, cellular function and maintenance, cell morphology, and drug metabolism. This classifier (particularly claudin) was strongly associated with tight junction reassembly. A weaker association occurred with transepithelial electrical resistance in colon cancer cell lines. A canonical pathway analysis conducted based on the classifier dataset returned 7 pathways (Fig. 9). The only association that reached statistical significance was related to prostanoid biosynthesis.
Fig. 9.
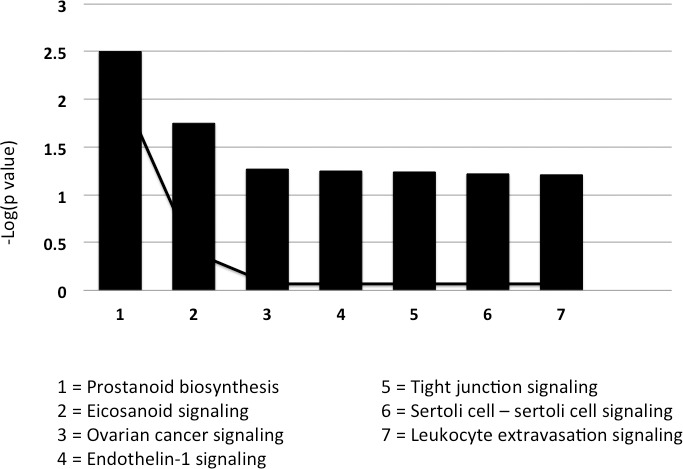
A canonical pathway analysis was conducted on the classifier dataset derived from a comparison of normal epithelium and rectal adenocarcinoma stages I to III. The significance of association between the classifier dataset and canonical pathway was measured using a Fisher exact test and a ratio of the number of molecules from the dataset that map to the pathway divided by the total number of molecules that map to the canonical pathway.
The top biologic functions associated with the classifier derived from a comparison of normal epithelium and stage I rectal adenocarcinoma were (1) cell-to-cell signaling and interaction, (2) cellular assembly and organization, (3) cellular function and maintenance, and (4) cell morphology. This classifier was also strongly associated with tight junction reassembly (in particular claudin) and had a weaker association with transepithelial electrical resistance in colon cancer cells. A canonical pathway analysis conducted based on this classifier returned the same pathways as the previous classifier (Fig. 10).
Fig. 10.
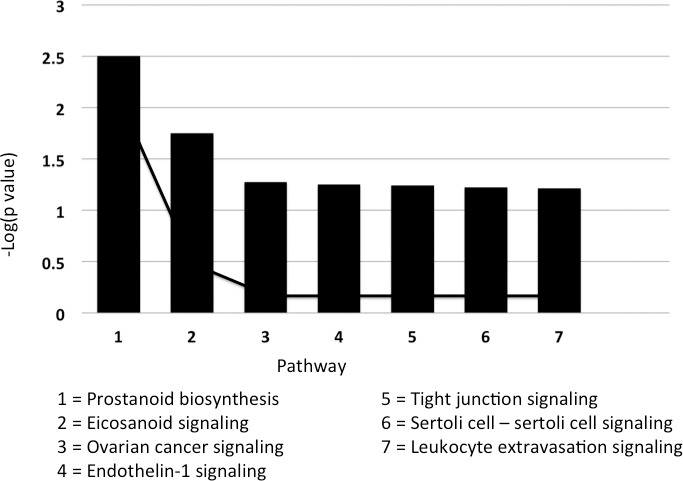
A canonical pathway analysis was conducted on the classifier dataset derived from a comparison of normal epithelium and stage I rectal adenocarcinoma. The significance of association between the classifier dataset and canonical pathway was measured using a Fisher exact test and a ratio of the number of molecules from the dataset that map to the pathway divided by the total number of molecules that map to the canonical pathway.
Discussion
The study was prompted by the subjectivity sometimes involved in the histopathologic identification of malignancy in rectal cancer. Classifiers derived from transcriptomic profiles could, in theory, obviate diagnostic subjectivity. Accordingly, the study aimed to compare transcriptomic profiles between normal and malignant rectal epithelium to determine whether both epithelial states could be differentiated. In applying a stringent bioinformatics workflow in a standardized manner, classifiers were generated that predicted epithelial state with near certainty. These classifiers comprise 5 probes, making them ideally suited to the clinical context (i.e., identifying rectal malignancy) wherein high-throughput processing requires appropriate economies of scale.
Financial constraints, specialist instrumentation, access, and a lack of validated classifiers have restricted the use of microarray technology to research domains.16,17 Hospital/clinical laboratories lack the utilities to characterize transcriptional profiles, which typically consist of large numbers of genes, and this (with other factors) has prohibited the direct incorporation of molecular profiling in clinical practice.18–21 The current situation prompts the identification of mechanisms by which transcriptomic classifiers may be practically introduced into the clinical setting (for example, the generation of small-set classifiers compromising minimal probe numbers).
Classifiers such as those generated in the current study (i.e., containing 5 genes only) could facilitate the application of transcriptomics in the identification of rectal malignancy. The current study demonstrated that small-set classifiers (generated using a stringent and standardized bioinformatics workflow) discriminate between normal and malignant epithelium with a high degree of accuracy. Classifiers derived from normal versus rectal adenocarcinoma stages I to III and normal versus stage I rectal adenocarcinoma had similar predictive accuracy (in differentiating normal from adenocarcinomatous epithelium). However, differences emerged when classifiers derived from each test were compared. The best performing classifier was derived from a comparison of normal versus rectal cancer stages I to III combined (mean sensitivity, 99.6%; mean specificity, 98.2%). Classifiers derived from a comparison of normal versus stage I rectal adenocarcinoma (mean sensitivity, 97.9%; mean specificity, 98.8%) were slightly less accurate, but they still demonstrated a nearly perfect performance, suggesting the changes occur in early cancer formation. Notwithstanding these minor differences, the accuracy of both classifiers was reflected in AUCs of 0.981 and 0.972, respectively. Classifiers derived from the above comparisons were robust. External validation using an Affymetrix-based dataset demonstrated similar accuracy in distinguishing between rectal adenocarcinoma (stages I–III) and normal epithelium (sensitivity, 100%; specificity, 98.7%) and between rectal adenocarcinoma (stage I) and normal epithelium (sensitivity, 100%; specificity, 96.2%).
When classifier datasets were imported into Ingenuity (ILP), using the most current iteration of the human genome, both datasets were strongly associated with cell-to-cell signaling, and cell function organization and morphology. Claudin 1 was the only gene common to both classifiers. Claudin 1 is known to be overexpressed in colorectal cancer in general and is associated with a putative central role in gastrointestinal tumorigenesis.22,23 Forkhead box Q1 is overexpressed in colorectal cancer, enhancing tumorigenicity through its angiogenic and antiapoptotic effects.24 The KIAA1199 transcript functions in Wnt pathway signaling and is upregulated in colorectal cancer with respect to normal mucosa.25–27 Lymphocyte antigen 6 complex is overexpressed in non–small cell lung cancer and esophageal squamous cell carcinoma, and its inhibition has been shown to suppress tumor growth.28
In conclusion, classifiers derived from transcriptomic profiles distinguish malignant and normal rectal epithelium with near certainty. These findings could potentially be used in diagnostic dilemmas and will guide future studies of individual genes in rectal oncogenesis.
Acknowledgments
Dr. Kalady is the Krause-Lieberman Endowed Chair in Colorectal Surgery, Cleveland Clinic. A portion of this work was supported by the American Society of Colon and Rectal Surgeons Career Development Award (M.F.K.). Dr. Kalady is a consultant and speaker for Precision Therapeutics.
References
- 1.Heldwein W, Dollhopf M, Rosch T, Meining A, Schmidtsdorff G, Hasford J, et al. The Munich polypectomy study (MUPS): prospective analysis of complications and risk factors in 4000 colonic snare polypectomies. Endoscopy. 2005;37(11):1116–1122. doi: 10.1055/s-2005-870512. [DOI] [PubMed] [Google Scholar]
- 2.Levin TR, Zhao W, Connell C, Seef LC, Manninen DL, Shapiro JA, et al. Complications of colonoscopy in an integrated health care delivery system. Ann Intern Med. 2006;145(12):880–886. doi: 10.7326/0003-4819-145-12-200612190-00004. [DOI] [PubMed] [Google Scholar]
- 3.Hogan J, Burke J, Samaha G, Condon E, Waldron D, Coffey JC. Overall survival is improved in mucinous adenocarcinoma of the colon. Int J Colorectal Dis. 2014;29(5):563–569. doi: 10.1007/s00384-013-1826-2. [DOI] [PubMed] [Google Scholar]
- 4.Hogan J, Judge J, O'Callaghan M, Aziz A, Burke J, Dunne C, et al. Introducing a novel and robust technique for determining lymph node status in colorectal cancer. Ann Surg. 2013;260(1):94–102. doi: 10.1097/SLA.0000000000000289. [DOI] [PubMed] [Google Scholar]
- 5.Kitahara O, Furukawa Y, Tanaka T, Kihara C, Yanagawa R, Nita ME, et al. Alterations of gene expression during colorectal carcinogenesis revealed by cDNA microarrays after laser-capture microdissection of tumor tissues and normal epithelia. Cancer Res. 2001;61(9):3544–3549. [PubMed] [Google Scholar]
- 6.Azzoni C, Bottarelli L, Campanini N, Di Cola G, Bader G, Mazzeo A, et al. Distinct molecular patterns based on proximal and distal sporadic colorectal cancer: arguments for different mechanisms in the tumorigenesis. Int J Colorectal Dis. 2006;22(2):115–126. doi: 10.1007/s00384-006-0093-x. [DOI] [PubMed] [Google Scholar]
- 7.Kalady MF, Coffey J.C, DeJulius K, Jarrar A, Church JM. High throughput arrays identify distinct gene profiles associated with lymph node involvement in rectal cancer. Dis Colon Rectum. 2012;55(6):628–639. doi: 10.1097/DCR.0b013e3182507511. [DOI] [PubMed] [Google Scholar]
- 8.Ramalho-Santos M, Yoon S, Matsuzaki Y, Mulligan RC, Melton DA. “Stemness”: transcriptional profiling of embryonic and adult stem cells. Science. 2002;298(5593):597–600. doi: 10.1126/science.1072530. [DOI] [PubMed] [Google Scholar]
- 9.Ivanova NB, Dimos JT, Schaniel C, Hackney JA, Moore KA, Lemischka IR. A stem cell molecular signature. Science. 2002;298(5593):601–604. doi: 10.1126/science.1073823. [DOI] [PubMed] [Google Scholar]
- 10.Shi L, Jones W, Jensen R, Harris SC, Perkins RG, Goodsaid FM et al. The balance of reproducibility, sensitivity and specificity of lists of differentially expressed genes in microarray studies. Bioinformatics. 2008;12(9):S10. doi: 10.1186/1471-2105-9-S9-S10. [DOI] [PMC free article] [PubMed] [Google Scholar]
- 11.Mohr S, Leikauf GD, Keith G, Rihn BH. Microarrays as cancer keys: an array of opportunities. J Clin Oncol. 2002;20(14):3165–3175. doi: 10.1200/JCO.2002.12.073. [DOI] [PubMed] [Google Scholar]
- 12.Kononen J, Bubendorf L, Kallionimeni A, Barlund M, Schrami P, Leighton S, et al. Tissue microarrays for high-throughput molecular profiling of tumor specimens. Nat Med. 1998;4(7):844–847. doi: 10.1038/nm0798-844. [DOI] [PubMed] [Google Scholar]
- 13.Okuno K, Yasutomi M, Nishimura N, Arakawa T, Shiomi M, Hida J, et al. Gene expression analysis in colorectal cancer using practical DNA array filter. Dis Colon Rectum. 2001;44(2):296–299. doi: 10.1007/BF02234309. [DOI] [PubMed] [Google Scholar]
- 14.Lips EH, Van Eijk R, De Graaf EJ, Doomebosch PG, de Miranda NF, Oosting J, et al. Progression and tumor heterogeneity analysis in early rectal cancer. Clin Cancer Res. 2008;14(3):772–781. doi: 10.1158/1078-0432.CCR-07-2052. [DOI] [PubMed] [Google Scholar]
- 15.Kita H, Hikichi K, Tsuneyama K, Cui ZG, Osawa H, Mutoh H, et al. Differential gene expression between flat adenoma and normal mucosa in the colon in a microarray analysis. J Gastroenterol. 2006;41(11):1053–1063. doi: 10.1007/s00535-006-1894-y. [DOI] [PubMed] [Google Scholar]
- 16.Khan J, Bittner MJ, Chen Y, Meltzer PS, Trent JM. DNA microarray technology: the anticipated impact on the study of human disease. Biochim Biophys Acta. 1999;1423(2):17–28. doi: 10.1016/s0304-419x(99)00004-9. [DOI] [PubMed] [Google Scholar]
- 17.Boulesteix A.L, Strobl C, Augustin T, Daumer M. Evaluating microarray-based classifiers: an overview. Cancer Inform. 2008;6:77–97. doi: 10.4137/cin.s408. [DOI] [PMC free article] [PubMed] [Google Scholar]
- 18.Russo G, Zegar C, Advantages Giordano A. and limitations of microarray technology in human cancer. Oncogene. 2003;22(42):6497–6507. doi: 10.1038/sj.onc.1206865. [DOI] [PubMed] [Google Scholar]
- 19.Loannidis PA. Is molecular profiling ready for use in clinical decision-making? Oncologist. 2007;12(3):301–311. doi: 10.1634/theoncologist.12-3-301. [DOI] [PubMed] [Google Scholar]
- 20.Shi L, Tong W, Fang H, Scherf U, Han J, Puri RK, et al. Cross platform comparability of microarray technology: intra-platform consistency and appropriate data analysis procedures are essential. Bioinformatics. 2005;15(6, suppl 2):S12. doi: 10.1186/1471-2105-6-S2-S12. [DOI] [PMC free article] [PubMed] [Google Scholar]
- 21.Kaminski S. DNA microarrays – a methodological breakthrough in genetics. J Appl Genet. 2002;43(2):123–130. [PubMed] [Google Scholar]
- 22.Dhawan P, Singh A, Deane NG, No Y, Shiou SR, Schmidt C, et al. Claudin-1 regulates cellular transformation and metastatic behavior in colon cancer. J Clin Invest. 2005;115(7):1765–1776. doi: 10.1172/JCI24543. [DOI] [PMC free article] [PubMed] [Google Scholar]
- 23.Miwa N, Furuse M, Tsukita S, Nikawa N, Nakamura Y, Furukawa Y, et al. Involvement of claudin-1 in the beta-catenin/Tcf signaling pathway and its frequent up regulation in human colorectal cancers. Oncol Res. 2001;12(11–12):469–476. doi: 10.3727/096504001108747477. [DOI] [PubMed] [Google Scholar]
- 24.Kaneda H, Arao T, Tanaka K, Tamura D, Aomatsu K, Kudo K, et al. FOXQ1 is overexpressed in colorectal cancer and enhances tumorigenicity and tumor growth. Cancer Res. 2010;70(5):2053–2063. doi: 10.1158/0008-5472.CAN-09-2161. [DOI] [PubMed] [Google Scholar]
- 25.Birkenkamp-Demtroder K, Magnouj A, Mansilla F, Thorsen K, Andersen CL, Oster B, et al. Repression of KIAA1199 attenuates Wnt-signalling and decreases the proliferation of colon cancer cells. Br J Cancer. 2011;9(105):552–561. doi: 10.1038/bjc.2011.268. [DOI] [PMC free article] [PubMed] [Google Scholar]
- 26.Matsuzaki S, Tanaka F, Mimori K, Tahara K, Inoue H, Mori M. Clinicopathological significance of KIAA1199 overexpression in human gastric cancer. Ann Surg Oncol. 2009;16(7):2042–2051. doi: 10.1245/s10434-009-0469-6. [DOI] [PubMed] [Google Scholar]
- 27.Kuscu C, Evensen N, Kim D, Hu YJ, Zucker S, Cao J. Transcriptional and epigenetic regulation of KIAA1199 gene expression in human breast cancer. PLOS One. 2012;7(9):e44661. doi: 10.1371/journal.pone.0044661. [DOI] [PMC free article] [PubMed] [Google Scholar]
- 28.Ishikawa N, Takano A, Yasui W, Inai K, Nishimura H, Ito H, et al. Cancer-testis antigen lymphocyte antigen 6 complex locus K is a serologic biomarker and a therapeutic target for lung and esophageal carcinomas. Cancer Res. 2007;67(24):11601–11611. doi: 10.1158/0008-5472.CAN-07-3243. [DOI] [PubMed] [Google Scholar]


