

Abstract
Aims/hypothesis
Maternal obesity is associated with an increased risk of obesity and impaired glucose homeostasis in offspring. However, it is not known whether a gestational or pre-gestational exposure confers similar risks, and if so, what the underlying mechanisms are.
Methods
We used reciprocal two-cell embryo transfers between mice fed either a control or high-fat diet (HFD) starting at the time of weaning. Gene expression in placenta was assessed by microarray analyses.
Results
A pre-gestational exposure to a maternal HFD (HFD/control) impaired fetal and placental growth despite a normal gestational milieu. Expression of imprinted genes and genes regulating vasculogenesis and lipid metabolism was markedly altered in placenta of HFD/control. An exposure to an HFD (control/HFD) only during gestation also resulted in fetal growth restriction and decreased placental weight. Interestingly, only a gestational exposure to an HFD (control/HFD) resulted in obesity and impaired glucose tolerance in adulthood.
Conclusions/interpretation
An HFD during pregnancy has profound consequences for the offspring later in life. Our data demonstrate that the mechanism underlying this phenomenon is not related to placental dysfunction, intrauterine growth restriction or postnatal weight gain, but rather an inability of the progeny to adapt to the abnormal gestational milieu of an HFD. Thus, the ability to adapt to an adverse intrauterine environment is conferred prior to pregnancy and it is possible that the effects of a maternal HFD may be transmitted to subsequent generations.
Keywords: Fetal programming, Gestation, Glucose intolerance, Maternal obesity, Pregnancy
Introduction
Obesity in pregnancy is associated with an abnormal intrauterine metabolic milieu that can have long-lasting effects on offspring [1–23]. Maternal obesity in humans is associated with intrauterine growth restriction (IUGR) and large for gestational age (LGA) offspring, and both IUGR and LGA offspring of obese mothers have a high risk of developing obesity in later life [2–9]. We have recently shown that offspring of rats and mice fed a high-fat diet prior to and during pregnancy and lactation develop obesity later in life [12, 13].
Previous studies suggest that obesity has adverse effects on the oocyte and embryo [11, 13–20]. Thus, it is possible that exposure to an adverse metabolic milieu prior to pregnancy accounts for some of the adverse outcomes observed in offspring. In previous studies, we used a novel approach whereby we carried out a series of reciprocal early two-cell embryo transfers between mice fed a control or high-fat diet (HFD). Surprisingly, we found that pre-gestational exposure to obesity programs the brain reward system [24]. The purpose of the current study was to test the hypothesis that pre-gestational exposure to an HFD represents another critical window of exposure resulting in an abnormal metabolic phenotype in offspring.
Methods
Animals and diet
The animal model has been previously described [24]. In brief, female mice at 4 weeks were started on an HFD diet (Harlan TD06414 [Harlan Laboratories, Easton, MA, USA]: 18.4% kJ protein; 21.3% from carbohydrate [sucrose]; 60.3% from fat [lard and soybean oil]; 21.34 kJ/g) or a control diet (Lab Diet5015: 19.8% kJ from protein; 54.9% from carbohydrate [cornstarch]; 25.3% from fat [soybean oil]; 15.48 kJ/g). Food intake was measured weekly. Diets were continued for 10–12 weeks prior to mating. Control dams were mated to C57BL/6-Tg (UBC-GFP) 30Scha/J males (Jackson Labs, Bar Harbor, ME, USA), which carry a transgene that contains the green fluorescent protein coding region under control of the ubiquitin C promoter. Transfer of both HFD-derived embryos and control-derived embryos into the same recipient minimises effects of variability between recipients of the two donor groups (electronic supplementary material [ESM] Fig. 1).
Two-cell embryos were transferred into pseudopregnant females 24 h after detection of vaginal plugs. Ten HFD-derived and ten control-derived embryos were mixed together, and ten randomly selected embryos were transferred into each oviduct of recipients. Donors and recipients were age matched. Sex determination of embryos was performed by PCR amplification of male-specific Sry gene (primer sequences in ESM Table 1). Diets were continued through gestation and lactation and pups were placed on control chow diets at weaning (3 weeks).
These studies were approved by the Institutional Animal Care and Use Committee of the Children’s Hospital of Philadelphia and University of Pennsylvania.
Placenta analyses
Histology
Tissues were fixed overnight at 4°C, dehydrated, and bivalved in sagittal section through the mid placental plane. All tissues were placed in similar orientation prior to embedding in paraffin, and serial sagittal tissue sections, 4 μm thick, were cut through the mid placenta and stained with haematoxylin and eosin. Images were collected using a Leica (Leica Microsystems, Wetzlar, Germany) DMRBE upright microscope with ×2.5, ×5 and ×10 objectives, a 5.0 Mega-Pixel colour CCD camera, and iVision acquisition software (BioVision Technologies, Chester Springs, PA, USA). Micrographs were analysed with ImageJ v1.4.5 (National Institutes of Health, Bethesda, MD, USA). The total cross-sectional area of placenta was outlined from its base at the chorioallantois to the giant cell layer. The total cross-sectional area of labyrinth was outlined based on its characteristic morphological features. Ratios of area of labyrinth to placenta as well as maternal decidua to placenta were calculated [25].
DNA and RNA extraction
Genomic DNA and total RNA were extracted using Allprep DNA/RNA Mini Kit (Qiagen, Valencia, CA, USA). Concentrations were determined with NanoDrop (Thermo Fischer Scientific, Waltham, MA, USA), and RNA was bioanalysed for integrity (Agilent, Santa Clara, CA, USA) and samples with RNA integrity number scores less than 7.5 were excluded.
Real-time PCR
Real-time PCR was performed using TaqMan (Life Technologies, Grand Island, NY, USA) primers (ESM Table 1) [12, 13]. Gapdh expression (there were no differences in expression between the four study groups) was assayed for each sample in parallel with the gene of interest.
Microarray analysis
RNA was isolated from embryonic day (E)12.5 placentas and complementary DNA was generated using Ambion WT Expression Kits (Ambion, Austin, TX, USA) and labelled with GeneChip WT Terminal Labeling Kits (Affymetrix 900671, Santa Clara, CA, USA). Samples were hybridised to GeneChip Mouse Exon 1.0ST arrays (Affymetrix 901168) and scanned (GeneChip Scanner 3000 7G System, Affymetrix). Probe intensity data were normalised and summarised to transcript cluster ID level using RMA-Partek Genomics Suite (Partek, St Louis, MO, USA). Sample variation was visualised using principal components analysis. Pairwise comparisons were made between groups and false discovery rates (FDR) were calculated along with adjusted p values by the Benjamini and Hochberg step-up method. The results were filtered with FDR <0.15 and fold change >1.5. Ingenuity Pathway Analysis software (Qiagen, Redwood City, CA) was used to evaluate functional pathways.
Metabolic analyses
In dams at 13 weeks of age, glucose tolerance tests (GTTs) and body composition measurements (NMR-LF50, Bruker) were performed in a separate group of animals from those used for embryo transfer. In offspring at 13 weeks of age, GTTs and body composition measurements (NMR-LF50, Bruker, Billerica, MA, USA) were performed. Animals were fasted for 6–8 h, 2 g/kg of glucose was given i.p. and blood glucose was sequentially measured in tail vein blood via clipping of the distal tail (Freestyle Glucometer-Abbott, Princeton, NJ, USA). Fasting serum leptin (ELISA, Millipore, Billerica, MA, USA), insulin (RIA, Millipore) and NEFA (NEFA-HR kit, Wako Diagnostics, Richmond, VA, USA) were measured in dams and offspring. Liver was harvested at 13 weeks of age from offspring and snap frozen for triacylglycerol analyses using Cayman kits (Cayman Chemical, Ann Arbor, MI, USA).
Statistical analysis
Results are expressed as means±SEM. All data sets were analysed for normality. A two-tailed Student’s t test was performed for normally distributed data, and a Mann–Whitney U test performed on non-parametric data. A two-way ANOVA was used to determine if there was an interaction between embryo donor exposures and embryo recipient exposures. Statistical analysis was performed using Graphpad Prism 5.0 software (GraphPad Software, San Diego, CA, USA). A power calculation was performed prior to the study and a post-hoc power calculation was performed for fetal, placental and adult weights.
Results
HFD causes obesity and glucose intolerance in dams
Body weights of dams at initiation of diets (at 4 weeks of age) were not different between study groups (donors 18.2±1.1 g; recipients 20.1±0.9 g); however, at breeding, HFD dams were significantly heavier, had higher leptin and NEFA levels, and were glucose intolerant. Fasting blood glucose levels were not significantly different between groups (Table 1). Food intake (3–4 g per day) was also similar between groups, resulting in increased energy intake by HFD-fed dams.
Table 1.
Characteristics of the control and HFD dams
| Variable | Control (n=14) | HFD (n=37) | p value |
|---|---|---|---|
| Donors | |||
| Weight (g) | 20.56±0.24 | 36.42±0.86 | <0.0001 |
| 2 h GTT, AUC (mmol/l×min) (n=10 each group) | 785±31 | 1,262±70 | <0.0001 |
| Fasting blood glucose (mmol/l) (n=10 each group) | 5.47±0.12 | 5.33±0.18 | 0.5614 |
| Leptin (μg/l) (n=10 each group) | 2.68±0.25 | 57.14±5.35 | <0.0001 |
| Recipients | |||
| n | 21 | 25 | |
| Pre-pregnancy | |||
| Weight (g) | 27.04±0.75 | 43.37±0.77 | <0.0001 |
| 2 h GTT, AUC (mmol/l×min) (n=10 each group) | 747±13 | 1,198±104 | 0.0082 |
| Fasting blood glucose (mmol/l) (n=10 each group) | 4.88±0.26 | 4.37±0.33 | 0.3234 |
| Leptin (μg/l) (n=10 each group) | 4.47±1.18 | 19.65±3.19 | 0.0017 |
| E12.5 | |||
| Fasting blood glucose (mmol/l) (n=10 each group) | 5.74±0.28 | 7.09±0.01 | 0.0522 |
| Leptin (μg/l) (n=10 each group) | 8.99±1.77 | 33.34±9.63 | 0.0167 |
| E17.5 | |||
| Fasting blood glucose (mmol/l) (n=10 each group) | 6.41±0.65 | 6.07±0.41 | 0.6607 |
| Leptin (μg/l) (n=10 each group) | 9.01±0.75 | 41.9±7.91 | 0.0251 |
Data are presented as means±SEM
Similar to what has previously been shown [26], there was a significant decrease in the number of female progeny at E12.5 in HFD/control and HFD/HFD groups (Table 2). Interestingly, by postnatal day 14, there were no differences in female:male sex ratios between groups as there was increased mortality in male newborn pups compared with females. It is not clear why males have increased postnatal mortality, but postnatal mortality is generally increased in human males [27]. In addition, there were no differences in average litter size between groups.
Table 2.
Distribution of progeny and fraction of female fetuses across groups at E12.5
| Group | Males (n) | Females(n) | Female fraction of total |
|---|---|---|---|
| Control/control | 18 | 23 | 0.56 |
| HFD/control | 30 | 18 | 0.38** |
| Control/HFD | 30 | 32 | 0.52 |
| HFD/HFD | 30 | 14 | 0.32** |
p<0.01 vs control diet
Exposure to a maternal HFD causes fetal growth restriction and abnormal placentation
A pre-gestational and gestational exposure to a maternal HFD (HFD/control, control/HFD and HFD/HFD) similarly decreased male and female fetal weight at E12.5 and E17.5 (Fig. 1a, b). Furthermore, there were no significant differences between fetal weight in control/HFD and HFD/HFD groups. Thus, the effect of a maternal HFD on fetal weight was similar in both donor groups, and not exacerbated or mitigated by a pre-gestational HFD exposure (two-way ANOVA p=NS; Fig. 1a, b). However, HFD/control offspring displayed a greater increase (a nearly 11-fold increase in weight for both male and female offspring) in weight gain over the course of gestation as compared with control/control, control/HFD and HFD/HFD progeny (approximately 8–9-fold increase in all three groups; ESM Fig. 2a, b).
Fig. 1.

Female (a, c) and male (b, d) fetal (a, b) and placental (c, d) weight (black bars, E12.5; grey bars, E17.5) normalised to C/C and expressed as means±SEM. *p<0.05 vs C/C at E12.5; †p<0.05 vs C/C at E17.5. Six C and five HFD litters at each age. (e) Labyrinth/placenta ratios and (f) placenta/(placenta+decidua) ratios. n=6–8 placentas from each group. Data are expressed as means±SEM. *p<0.05 vs C/C. C, control
Consistent with what was observed for fetal weight, a pre-gestational and gestational exposure to a maternal HFD decreased placental weight at E12.5 in males ( p<0.05), with a trend toward significance in females (Fig. 1c, d). However, in contrast to fetal weights, by the end of gestation, placenta weights were increased in all HFD groups compared with control/control. Furthermore, this effect does not appear to be a result of an interaction between pre-gestational and gestational exposures, indicating that the gain in placental mass during gestation is solely a result of in utero exposure (two-way ANOVA p=NS). Finally, the change in placental weight over gestation was similarly increased in HFD/control, control/HFD and HFD/HFD compared with control/control (ESM Fig. 2c, d).
Neither a pre-gestational nor gestational exposure to maternal HFD impacted the relative proportion occupied of each layer of placenta at E12.5 (Fig. 1e). However, the depth of placenta as a proportion of the placenta/decidua unit was similarly decreased in all exposed groups as compared with control ( p<0.05; Fig. 1f; ESM Fig. 3).
Mismatch between the pre-gestational and gestational environments impairs placental function
Fetal:placental weight ratios can be a marker of placental function and an indicator of the ability of placenta to support the demands of fetal growth [28]. At E17.5, when fetal growth is primarily dependent on placental function, the fetal:placental weight ratio was decreased for female ( p<0.02) and male ( p<0.005) gestations in all exposed groups (Fig. 2a, b). This decrease was observed as early as E12.5 in control/HFD and HFD/HFD females ( p<0.03) and in HFD/control males ( p<0.04; Fig. 2a, b). This effect does not appear to be a result of an interaction between pre-gestation and gestational exposures, as a combination of the two exposures does not exacerbate or mitigate the observed effect (two-way ANOVA p=NS).
Fig. 2.
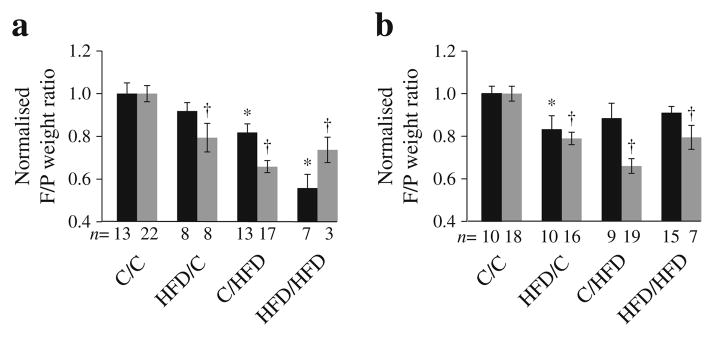
F:P weight ratios were calculated for female (a) and male (b) mice for each group (black bars, E12.5; grey bars, E17.5). *p<0.05 vs C/C at E12.5; †p<0.05 vs C/C at E17.5. Six C and five HFD litters at each age. C, control; F/P, fetal/placental
In utero exposure to maternal HFD increases weight and body fat content in adult offspring
While a pre-gestational exposure to an HFD resulted in growth-restricted fetuses and newborn pups (Fig. 3), there was no effect on adult weight (Fig. 4), and body fat content and serum leptin levels were similar between HFD/control and control/control offspring (Fig. 4). By contrast, a gestational exposure to a maternal HFD resulted in increased body fat and elevated leptin levels in male and female adult animals compared with control/control (Fig. 4). There was no interaction between pre-gestational and gestational exposures that would account for observed differences in body composition or serum leptin levels (two-way ANOVA p=NS).
Fig. 3.

Newborn weights. Six control and five HFD litters. Repeated measures were performed on individual animals from 2–13 weeks of age. (*p<0.05, **p<0.01, ****p<0.0001). The horizontal lines through the data points represent the mean
Fig. 4.

Adult weight and percentage body fat. Female (a) and male (b) offspring were weighed weekly. Repeated measures were performed on individual animals from 2– 13 weeks of age. Black circles, HFD/HFD; triangles, C/HFD; squares, HFD/C; diamonds, C/C. Percentage body fat (c, d) and leptin levels (e, f) of female (c, e) and male (d, f) progeny at 13 weeks of age. Data are expressed as means±SEM. *p<0.05 C/HFD vs C/C; †p<0.05 HFD/HFD vs C/C. C, control
A mismatch in pre-pregnancy and gestational nutritional environments impairs glucose tolerance
Surprisingly, exposure to a maternal HFD resulted in impaired glucose tolerance only in adult control/HFD offspring and these animals had a significant increase in AUCglucose compared with control/control offspring (females, p<0.01; males p<0.03; Fig. 5a–d). This effect was not observed in HFD/HFD offspring. Two-way ANOVA analysis showed that the AUCglucose was impacted by an interaction between a pre-gestational and gestational exposure ( p<0.05). Similarly, fasting plasma insulin levels and hepatic triacylglycerol levels were only significantly increased in control/HFD males and females (Fig. 5e–h). Fasting plasma NEFA levels and food consumption did not differ between groups ( p>0.05).
Fig. 5.

Metabolic abnormalities in 13-week-old offspring. 2 h glucose tolerance tests in females (a) and males (b). Black circles, HFD/HFD; triangles, C/HFD; squares, HFD/C; diamonds, C/C. AUCglucose in females (c) andmales (d). Fasting plasma insulin levels in females (e) and males (f). Fasting hepatic triacylglycerol levels in females (g) and males (h). Data are expressed as means±SEM. *p<0.05 vs C/C. C, control
Pre-gestational and gestational HFD alters placental gene expression
We performed gene expression profiling of E12.5 placentas to determine whether the transcriptome profile was associated with differences in adult phenotypes. Overall, exposure to a maternal HFD in utero had a more profound effect on gene expression in placenta than a pre-gestational exposure. A total of 1,026 genes (ESM Tables 2, 3, 4 and 5) were significantly enriched in the HFD recipients compared with controls (FDR <0.05, p<0.05). By contrast, far fewer genes were significantly enriched as a result of a pre-gestational exposure to a maternal HFD (177 genes, FDR <0.05, p<0.01).
Expression profiles of HFD/control were compared with control/control revealing enrichment of functional annotations including genes involved in solute transport, steroid biosynthesis, lipid metabolism, tissue development and vascularisation (Table 3, ESM Table 2). Interestingly, expression of a number of imprinted genes was significantly decreased in HFD/control including Slc22a3 and Slc22a18, which encode organic ion and solute carriers; Dio3 (iodothyronine deiodinase), which encodes a protein that plays an essential role in regulation of thyroid hormone inactivation during embryological development; and Cts6 (cathepsin 6), which is within the H19/Igf2 imprinted region. Also of note, was the finding that expression of Cyp17a1 was markedly increased. Cyp 17a1 encodes a key biosynthesis enzyme of oestrogen, which is critical in regulating adipogenesis and adipocyte development and is a candidate gene for obesity susceptibility in humans [29, 30]. Expression of Maoa (monoamine oxidase A) was reduced by 1.54-fold ( p<0.01).Monoamine oxidase A regulates maternal monoamine neurotransmitter transfer across the placenta to the fetus, and decreased expression may contribute to the changes in the reward circuitry that we observed in brains of adult offspring of HFD/control animals [24]. Despite relatively high FDR values in the array data, when expression of Cyp17a1, Maoa, Dio3, and Cts6 were validated using quantitative PCR, we found significant changes in expression (2–3-fold vs control/control [p<0.01]; ESM Table 6).
Table 3.
Results of ingenuity functional annotation clustering of genes enriched in each treatment groupa
| Treatment group | Functional annotation | p value | Genes |
|---|---|---|---|
| HFD/C vs C/Cb | Lipid metabolism | 2.70×10⁻⁴ | 2 |
| Steroid metabolism | 9.00×10⁻⁴ | 2 | |
| Tissue development | 4.19×10⁻⁴ | 3 | |
| Growth failure | 8.89×10⁻³ | 4 | |
| C/HFD vs C/Cc | Cellular development | 1.06×10⁻⁶ | 34 |
| Protein degradation | 5.29×10⁻⁶ | 10 | |
| DNA degradation | 7.94×10⁻⁶ | 9 | |
| Vasculogenesis | 4.39×10⁻⁵ | 15 | |
| HFD/HFD vs HFD/Cd | Tissue development | 1.12×10⁻⁶ | 57 |
| Immune response | 3.57×10⁻⁶ | 38 | |
| Vasculogenesis | 7.82×10⁻⁵ | 18 | |
| HFD/HFD vs C/Ce | Inflammatory response | 9.24×10⁻¹⁰ | 67 |
| Cell death | 8.79×10⁻⁴ | 110 | |
| Vasculogenesis | 1.31×10⁻⁶ | 30 |
Based on the most meaningful terms
Filtering based on FDR <0.40, fold change >1.5
Filtering based on FDR <0.15, fold change >1.5
Filtering based on FDR <0.40, fold change >1.5
Filtering based on FDR <0.15, fold change >1.5
C, Control
Many more genes were differentially expressed in HFD/HFD than in control/HFD vs control/control, suggesting that a pre-gestational and gestational exposure to HFD is more consequential. However pathways that were affected were very similar between the two groups (Table 3, ESM Tables 3, 4 and 5). Genes whose expression was decreased have functions in biological processes that regulate angiogenesis (Fbln7, members of the carcinoembryonic antigen gene family and Flt3), trophoblast invasion (genes that encode cathepsins and matrix metalloproteinases) and fetal well-being (Psg18, Psg19, Psg27 and Psg29). Low levels of pregnancy-specific glycoproteins are associated with spontaneous abortion [31], intrauterine growth retardation and preeclampsia [32].
By far the largest group of genes with increased expression only in the HFD/HFD placenta have roles in inflammation and include Aim2, C2, Ccl8, Cd3g, Clec2d, Dusp14, Gpnmb, Il2ra, Lbp, Masp1, Pik3cg, Serping1 and Tnfsf9 (ESM Table 5). Interestingly, several genes regulating production of ceramide and sphingosine metabolism were also significantly upregulated only in HFD/HFD placenta (including A4galt, Degs2, Ppp2r5a and, S1pr1). Ceramide and sphingosine are lipid signalling molecules with diverse functions such as cell death and lipid homeostasis [33]. These data suggest that a pre-gestational and gestational exposure magnifies inflammation and lipid abnormalities in placenta.
While gene expression profiles were very similar between control/HFD and HFD/HFD, a number of interesting genes were only dysregulated in control/HFD placenta, some of which may play a role in the difference in phenotypes between these two groups. These include Meg3, Lpar4 and Rsad2. Expression of Meg3, a long non-coding RNA and imprinted gene is decreased in islets from patients with type 2 diabetes [34]. Lpar4 encodes the receptor for lysophosphatidic acid, a glycerophospholipid that has been linked to insulin resistance [35]. Rsad2 regulates adipocyte differentiation and decreased levels are found in adipose tissue of diet-induced obese mice [36].
To gain a better understanding of the common factors that were associated with fetal growth restriction in the three exposure groups, we identified genes that were differentially expressed in all three treatment groups compared with control/control. Expression of transporters (Slc22a18 and Slc5a3), genes involved in placental invasion, extracellular matrix degradation and vascular remodelling (Mmp12, Amot, Cts6 and Mgp) were all similarly downregulated in placenta from the three IUGR groups. Interestingly, several of these have been identified as being dysregulated in pre-eclampsia, which is often associated with maternal obesity in humans that is characterised by poor placental invasion and abnormal vascular remodelling [37].
Of significance was our finding that expression of 11β-Hsd2 (also known as Hsd11b2), which encodes 11β-hydroxysteroid dehydrogenase, was substantially reduced in placenta of all three groups. 11β-hydroxysteroid dehydrogenase inactivates cortisol to cortisone and protects the developing fetus from the deleterious effects of circulating maternal glucocorticoids. Levels are significantly reduced in placentas of IUGR pregnancies in humans [38] and in animal models of uteroplacental insufficiency [38].
A targeted approach was taken to determine whether maternal HFD alters expression of genes regulating fetal and placental growth, nutrient detection and transport. Insulin-like growth factor (IGF)-1 and IGF-2 are important regulators of fetal and placental development [39]. There were no significant differences in Igf1 expression between the four groups at either age (Fig. 6). By contrast, gestational exposure to an HFD (control/HFD and HFD/HFD) resulted in a two-fold increase in Igf1r expression at E12.5, whereas a pre-gestational or gestational exposure to an HFD was associated with decreased expression of Igf2 and Igf2r (two-way ANOVA analysis showed a significant interaction between pre-gestational and gestational exposures [ p=0.04]; Fig. 6). This is surprising as Igf1r and Igf2 are usually coordinately regulated. Thus, the biological significance of these findings is unclear. At E17.5, expression of Igf2 and Igf2r remained decreased in all three HFD exposed groups, but the interaction was lost and the two-way ANOVA was not significant. Expression of Igf1r normalised and was similar between all four groups (Fig. 6).
Fig. 6.

Placental gene expression patterns. Gene expression was measured by quantitative PCR in placenta at E12.5 (black bars) and E17.5 (grey bars). n=7–11. Fold change values for each time point are relative to C/C and normalised to Gapdh. *p<0.05 vs C/C at each age. C, control
Pre-gestational or gestational exposure to maternal HFD resulted in decreased expression of different classes of placental nutrient transporters. At E12.5, expression of Mtor, Slc38a1 (an Na+-dependent system A neutral amino acid transporter), Glut1 (also known as Slca1) and Cd36 (a long-chain fatty acid translocase), were modestly reduced in placenta compared with control/control; however, there was no interaction between exposure groups (two-way ANOVA NS; Fig. 6). Mtor and Slc38a1 expression had normalised by day 17.5 in placenta in all groups. By contrast, Cd36 expression was persistently decreased in pre-gestational HFD exposure groups. Thus, these data suggest that changes in nutrient transport are not responsible for differences in metabolic phenotype between groups. It remains to be determined if these changes in expression reflect changes in nutrient transport.
Discussion
It has been well described that obesity in pregnancy results in multiple phenotypic consequences for offspring, including obesity, diabetes and cardiovascular disease [2–13, 40, 41]. However, the window of exposure to a maternal HFD that is responsible for conferring these effects has not been well defined. Using reciprocal embryo transfers, we have been able to separate a pre-gestational exposure to a maternal HFD from the effects of an in utero exposure.
The first novel observation is that a pre-gestational exposure to maternal HFD restricts fetal and placental growth during gestation. The fetus remains growth restricted and surprisingly, so does the newborn pup. Thus, even in the face of a normal gestational milieu, a pre-pregnancy exposure to a maternal HFD impairs fetal and placental growth. These findings continue to broaden the window of susceptibility to the adverse effects of maternal HFD to include the oocyte and its pre-conception environment. These data suggest that it is possible that effects of maternal obesity may be transmitted through the germline to subsequent generations and this has profound implications for human health. The effects of maternal obesity can also be transmitted to future generations through gestational exposure. Female offspring of obese dams may develop insulin resistance and glucose intolerance during pregnancy, thus affecting the F2 generation and inducing a vicious cycle.
Despite being growth restricted and displaying catch-up growth after birth, HFD/control offspring do not display glucose intolerance. It is possible that with age or diet or other stressors, glucose tolerance will become impaired in this group as well. Interestingly, in our previous studies a pre-gestational exposure to obesity also programs the reward system in adult offspring [24]. While food intake was not increased during adulthood, food preferences may be affected later in life, as other investigators have found [42, 43]. It is also possible that there are other metabolic and phenotypic abnormalities such as impaired beta-cell function, energy expenditure, physical activity or behaviour changes that characterise these offspring, and additional phenotypic characterisation will be carried out in the future.
One of the most interesting findings in the HFD/control group was differential expression of several imprinted genes in placenta. This suggests that an HFD prior to pregnancy may re-program imprinted marks during oocyte and early embryonic development. The acquired imprint instability may be carried into the next generation and increase the risk of chronic diseases in adulthood. Further, altered expression of several imprinted genes has been associated with human obesity and in animal models of obesity [44].
The second novel observation is that exposure to a maternal HFD solely during gestation has consequences during gestation and into adulthood. The findings of previous studies using different paradigms have suggested that an abnormal metabolic phenotype in the adult results from fetal programming as a result of IUGR, postnatal programming as a result of accelerated catch-up growth in the newborn period, or is secondary to obesity in adulthood [10, 45]. Our data would suggest that these are not primary factors contributing to the impaired glucose tolerance of adult (13 weeks old) control/HFD animals. In our model, both control/HFD and HFD/HFD animals (sharing an identical uterine environment) display IUGR, have similar postnatal growth curves and an obese body composition as adults, but have discordant glucose tolerance. The difference between groups is that the control/HFD animals, derived from control-fed dams, lack the pre-gestational exposure. Consequently, these embryos have not co-adapted with their gestational exposure, and therefore are ill prepared for the antenatal stress of fetal life in a high-fat environment, which is consistent with the concept of predictive adaptive programming [46]. Predictive adaptive programming has usually been discussed in the context of limited maternal nutrient availability. However, our data suggest that this response also applies to maternal nutrient excess.
Surprisingly, HFD/HFD female offspring were not glucose intolerant in adulthood; however, they had significantly higher body fat content than control/control, which places them at high risk for later development of glucose intolerance. However, HFD/HFD males did have glucose intolerance, similar to what we have previously observed in male offspring of obese dams [13]. As ageing is known to affect adiposity and glucose homeostasis [47], it is possible that glucose intolerance will develop with age in females and worsen over time in males.
We observed few sex differences in metabolic and growth variables in adulthood between the groups except for weight (female gestational exposure to an HFD produced increased weight compared with a control gestational exposure). However, despite weight differences, body fat content was similarly increased in both sexes exposed to an HFD during gestation. It is possible that other metabolic or behavioural phenotypes may differ with age between sexes and this remains to be determined.
In conclusion, obesity during pregnancy has profound consequences for the offspring later in life. Our data demonstrate that the mechanism underlying this phenomenon is not related to placental dysfunction, IUGR or postnatal weight gain, but rather an inability of progeny to adapt to the abnormal gestational milieu of an HFD. Thus, the ability to adapt to an adverse intrauterine environment is conferred prior to pregnancy and it is possible that the effects of maternal obesity may be transmitted to subsequent generations.
Acknowledgments
Funding This study was supported by the National Institutes of Health (NIH) grant no. DK062965 (RAS) and by core services provided by the DERC at the University of Pennsylvania from a grant sponsored by NIH grant no. DK19525.
We are grateful to many people who supported this work, particularly A. Harmon, Technical Director of the Transgenic Core Facility at the Children’s Hospital of Philadelphia, for her expertise in surgical embryo transfer. We would also like to acknowledge T. Jiang of the Cancer Histology Core at the Perelman School of Medicine; the CDB Microscopy Core at the Perelman School of Medicine; and the services of H. Collins of the Radioimmunoassay and Bioassay Core at the Perelman School of Medicine and R. Dhir of the Mouse Phenotyping, Physiology and Metabolism Core at the Perelman School of Medicine. D. Baldwin and J. Tobias at the Molecular Profiling Facility and the Computational Biology and Research Informatics Core, respectively, provided support for the microarray analysis at the Perelman School of Medicine. We would also like to acknowledge M. Bartolomei and T. Reyes Perelman, both at the School of Medicine at the University of Pennsylvania, for their helpful editorial advice.
Abbreviations
- FDR
False discovery rate
- GTT
Glucose tolerance test
- HFD
High-fat diet
- IUGR
Intrauterine growth restriction
- LGA
Large for gestational age
Footnotes
Electronic supplementary material The online version of this article (doi: 10.1007/s00125-014-3466-7) contains peer-reviewed but unedited supplementary material, which is available to authorised users.
Duality of interest The authors declare that there is no duality of interest associated with this manuscript.
Contribution statement IES contributed to the conception and design of experiments, wrote the manuscript and researched data. APV contributed to the conception and design of experiments, wrote the manuscript and researched data. MAM contributed to the conception and design of experiments and reviewed/edited the manuscript. KHM contributed to the conception and design of experiments and reviewed/edited the manuscript. RAS was responsible for the conception and design of experiments and assisted in the writing of the manuscript. All authors have given final approval of the manuscript. RAS is the guarantor of this work and, as such, had full access to all the data in the study and takes responsibility for the integrity of the data and the accuracy of the data analysis.
Contributor Information
Isaac E. Sasson, Department of Obstetrics and Gynecology, Perelman School of Medicine at the University of Pennsylvania, Philadelphia, PA, USA
Alexa P. Vitins, Center for Research on Reproduction and Women’s Health, Biomedical Research Building II/III 1308, Perelman School of Medicine, University of Pennsylvania, 421 Curie Boulevard, Philadelphia, PA 19104, USA
Monica A. Mainigi, Department of Obstetrics and Gynecology, Perelman School of Medicine at the University of Pennsylvania, Philadelphia, PA, USA
Kelle H. Moley, Department of Obstetrics and Gynecology, Washington University in St Louis, St Louis, MO, USA
Rebecca A. Simmons, Email: rsimmons@mail.med.upenn.edu, Center for Research on Reproduction and Women’s Health, Biomedical Research Building II/III 1308, Perelman School of Medicine, University of Pennsylvania, 421 Curie Boulevard, Philadelphia, PA 19104, USA. Children’s Hospital of Philadelphia, Philadelphia, PA, USA
References
- 1.Dietz WH. Overweight in childhood and adolescence. N Engl J Med. 2004;350:855–857. doi: 10.1056/NEJMp048008. [DOI] [PubMed] [Google Scholar]
- 2.Bayol SA, Simbi BH, Stickland NC. A maternal cafeteria diet during gestation and lactation promotes adiposity and impairs skeletal muscle development and metabolism in rat offspring at weaning. J Physiol. 2005;567:951–961. doi: 10.1113/jphysiol.2005.088989. [DOI] [PMC free article] [PubMed] [Google Scholar]
- 3.Catalano PM. Obesity and pregnancy—the propagation of a viscous cycle? J Clin Endocrinol Metab. 2003;88:3505–3506. doi: 10.1210/jc.2003-031046. [DOI] [PubMed] [Google Scholar]
- 4.Levin BE, Dunn-Meynell AA. Maternal obesity alters adiposity and monoamine function in genetically predisposed offspring. Am J Physiol Regul Integr Comp Physiol. 2002;283:R1087–R1093. doi: 10.1152/ajpregu.00402.2002. [DOI] [PubMed] [Google Scholar]
- 5.Levin BE, Govek E. Gestational obesity accentuates obesity in obesity-prone progeny. Am J Physiol. 1998;275:R1374–R1379. doi: 10.1152/ajpregu.1998.275.4.R1374. [DOI] [PubMed] [Google Scholar]
- 6.Guo F, Jen KL. High-fat feeding during pregnancy and lactation affects offspring metabolism in rats. Physiol Behav. 1995;57:681–686. doi: 10.1016/0031-9384(94)00342-4. [DOI] [PubMed] [Google Scholar]
- 7.Reifsnyder PC, Churchill G, Leiter EH. Maternal environment and genotype interact to establish diabesity in mice. Genome Res. 2000;10:1568–1578. doi: 10.1101/gr.147000. [DOI] [PMC free article] [PubMed] [Google Scholar]
- 8.Masuyama H, Hiramatsu Y. Effects of a high-fat diet exposure in utero on the metabolic syndrome-like phenomenon in mouse offspring through epigenetic changes in adipocytokine gene expression. Endocrinology. 2012;153:2823–2830. doi: 10.1210/en.2011-2161. [DOI] [PubMed] [Google Scholar]
- 9.Dunn GA, Bale TL. Maternal high-fat diet promotes body length increases and insulin insensitivity in second-generation mice. Endocrinology. 2009;150:4999–5009. doi: 10.1210/en.2009-0500. [DOI] [PMC free article] [PubMed] [Google Scholar]
- 10.Taylor PD, Poston L. Developmental programming of obesity in mammals. Exp Physiol. 2007;92:287–298. doi: 10.1113/expphysiol.2005.032854. [DOI] [PubMed] [Google Scholar]
- 11.Simmons R. Perinatal programming of obesity. Semin Perinatol. 2008;32:371–374. doi: 10.1053/j.semperi.2008.08.004. [DOI] [PMC free article] [PubMed] [Google Scholar]
- 12.Sen S, Simmons RA. Maternal antioxidant supplementation prevents adiposity in the offspring of Western diet-fed rats. Diabetes. 2010;59:3058–3065. doi: 10.2337/db10-0301. [DOI] [PMC free article] [PubMed] [Google Scholar]
- 13.Jungheim ES, Schoeller EL, Marquard KL, Louden ED, Schaffer JE, Moley KH. Diet-induced obesity model: abnormal oocytes and persistent growth abnormalities in the offspring. Endocrinology. 2010;151:4039–4046. doi: 10.1210/en.2010-0098. [DOI] [PMC free article] [PubMed] [Google Scholar]
- 14.Purcell SH, Chi MM, Lanzendorf S, Moley KH. Insulin-stimulated glucose uptake occurs in specialized cells within the cumulus oocyte complex. Endocrinology. 2012;153:2444–2454. doi: 10.1210/en.2011-1974. [DOI] [PMC free article] [PubMed] [Google Scholar]
- 15.Jungheim ES, Louden ED, Chi MM, Frolova AI, Riley JK, Moley KH. Preimplantation exposure of mouse embryos to palmitic acid results in fetal growth restriction followed by catch-up growth in the offspring. Biol Reprod. 2011;85:678–683. doi: 10.1095/biolreprod.111.092148. [DOI] [PMC free article] [PubMed] [Google Scholar]
- 16.Marquard KL, Stephens SM, Jungheim ES, et al. Polycystic ovary syndrome and maternal obesity affect oocyte size in in vitro fertilization/intracytoplasmic sperm injection cycles. Fertil Steril. 2011;95:2146–2149. doi: 10.1016/j.fertnstert.2010.10.026. [DOI] [PMC free article] [PubMed] [Google Scholar]
- 17.Jungheim ES, Moley KH. Current knowledge of obesity’s effects in the pre- and periconceptional periods and avenues for future research. Am J Obstet Gynecol. 2010;203:525–530. doi: 10.1016/j.ajog.2010.06.043. [DOI] [PMC free article] [PubMed] [Google Scholar]
- 18.Eng GS, Sheridan RA, Wyman A, et al. AMP kinase activation increases glucose uptake, decreases apoptosis, and improves pregnancy outcome in embryos exposed to high IGF-I concentrations. Diabetes. 2007;56:2228–2234. doi: 10.2337/db07-0074. [DOI] [PubMed] [Google Scholar]
- 19.Shankar K, Zhong Y, Kang P, et al. Maternal obesity promotes a proinflammatory signature in rat uterus and blastocyst. Endocrinology. 2011;152:4158–4170. doi: 10.1210/en.2010-1078. [DOI] [PMC free article] [PubMed] [Google Scholar]
- 20.Igosheva N, Abramov AY, Poston L, et al. Maternal diet-induced obesity alters mitochondrial activity and redox status in mouse oocytes and zygotes. PLoS One. 2010;5:e10074. doi: 10.1371/journal.pone.0010074. [DOI] [PMC free article] [PubMed] [Google Scholar]
- 21.Ojha S, Saroha V, Symonds ME, Budge H. Excess nutrient supply in early life and its later metabolic consequences. Clin Exp Pharmacol Physiol. 2013;40:817–823. doi: 10.1111/1440-1681.12061. [DOI] [PubMed] [Google Scholar]
- 22.Symonds ME, Sebert SP, Budge H. The impact of diet during early life and its contribution to later disease: critical checkpoints in development and their long-term consequences for metabolic health. Proc Nutr Soc. 2009;68:416–421. doi: 10.1017/S0029665109990152. [DOI] [PubMed] [Google Scholar]
- 23.Fleming TP, Lucas ES, Watkins AJ, Eckert JJ. Adaptive responses of the embryo to maternal diet and consequences for post-implantation development. Reprod Fertil Dev. 2011;24:35–44. doi: 10.1071/RD11905. [DOI] [PubMed] [Google Scholar]
- 24.Grissom NM, Lyde R, Christ L, et al. Obesity at conception programs the opioid system in the offspring brain. Neuropsychopharmacology. 2014;39:801–810. doi: 10.1038/npp.2013.193. [DOI] [PMC free article] [PubMed] [Google Scholar]
- 25.Dokras A, Hoffmann DS, Eastvold JS, et al. Severe feto-placental abnormalities precede the onset of hypertension and proteinuria in a mouse model of preeclampsia. Biol Reprod. 2006;75:899–907. doi: 10.1095/biolreprod.106.053603. [DOI] [PubMed] [Google Scholar]
- 26.Rosenfeld CS, Roberts RM. Maternal diet and other factors affecting offspring sex ratio: a review. Biol Reprod. 2004;71:1063–1070. doi: 10.1095/biolreprod.104.030890. [DOI] [PubMed] [Google Scholar]
- 27.Drevenstedt GL, Crimmins EM, Vasunilashorn S, Finch CE. The rise and fall of excess male infant mortality. Proc Natl Acad Sci. 2008;105:5016–5021. doi: 10.1073/pnas.0800221105. [DOI] [PMC free article] [PubMed] [Google Scholar]
- 28.Heinonen S, Taipale P, Saarikoski S. Weights of placentae from small-for-gestational age infants revisited. Placenta. 2001;22:399–404. doi: 10.1053/plac.2001.0630. [DOI] [PubMed] [Google Scholar]
- 29.Escobar JC, Patel SS, Beshay VE, et al. The human placenta expresses CYP17 and generates androgens de novo. J Clin Endocrinol Metab. 2011;96:1385–1392. doi: 10.1210/jc.2010-2504. [DOI] [PubMed] [Google Scholar]
- 30.Yan H, Guo Y, Yang TL, Zhao LJ, Deng HW. A family-based association study identified CYP17 as a candidate gene for obesity susceptibility in Caucasians. Genet Mol Res. 2012;11:1967–1974. doi: 10.4238/2012.May.22.1. [DOI] [PMC free article] [PubMed] [Google Scholar]
- 31.Masson GM, Anthony F, Wilson M. Value of Schwangerschaftsprotein 1 (SP1) and pregnancy-associated plasma protein- A (PAPP-A) in the clinical management of threatened abortion. Br J Obstet Gynaecol. 1983;90:146–149. doi: 10.1111/j.1471-0528.1983.tb08899.x. [DOI] [PubMed] [Google Scholar]
- 32.Silver RM, Heyborne KD, Leslie KK. Pregnancy specific beta 1 glycoprotein (SP-1) in maternal serum and amniotic fluid; pre-eclampsia, small for gestational age fetus and fetal distress. Placenta. 1993;14:583–589. doi: 10.1016/s0143-4004(05)80211-5. [DOI] [PubMed] [Google Scholar]
- 33.Maceyka M, Harikumar KB, Milstien S, Spiegel S. Sphingosine-1-phosphate signaling and its role in disease. Trends Cell Biol. 2012;22:50–60. doi: 10.1016/j.tcb.2011.09.003. [DOI] [PMC free article] [PubMed] [Google Scholar]
- 34.Kameswaran V, Bramswig NC, McKenna LB, et al. Epigenetic regulation of the DLK1-MEG3 microRNA cluster in human type 2 diabetic islets. Cell Metab. 2014;19:135–145. doi: 10.1016/j.cmet.2013.11.016. [DOI] [PMC free article] [PubMed] [Google Scholar]
- 35.Yung YC, Stoddard NC, Chun J. LPA receptor signaling: pharmacology, physiology, and pathophysiology. J Lipid Res. 2014;55:1192–1214. doi: 10.1194/jlr.R046458. [DOI] [PMC free article] [PubMed] [Google Scholar]
- 36.Dogan A, Lasch P, Neuschl C, et al. ATR-FTIR spectroscopy reveals genomic loci regulating the tissue response in high fat diet fed BXD recombinant inbred mouse strains. BMC Genomics. 2013;14:386. doi: 10.1186/1471-2164-14-386. [DOI] [PMC free article] [PubMed] [Google Scholar]
- 37.Kleinrouweler CE, van Uitert M, Moerland PD, Ris-Stalpers C, van der Post JA, Afink GB. Differentially expressed genes in the pre-eclamptic placenta: a systematic review and meta-analysis. PLoS One. 2013;8:e68991. doi: 10.1371/journal.pone.0068991. [DOI] [PMC free article] [PubMed] [Google Scholar]
- 38.Zambrano E, Guzmán C, Rodríguez-González GL, Durand-Carbajal M, Nathanielsz PW. Fetal programming of sexual development and reproductive function. Mol Cell Endocrinol. 2014;382:538–549. doi: 10.1016/j.mce.2013.09.008. [DOI] [PubMed] [Google Scholar]
- 39.Baker J, Liu JP, Robertson EJ, Efstratiadis A. Role of insulin-like growth factors in embryonic and postnatal growth. Cell. 1993;75:73–82. [PubMed] [Google Scholar]
- 40.Dyer JS, Rosenfeld CR. Metabolic imprinting by prenatal, perinatal, and postnatal overnutrition: a review. Semin Reprod Med. 2011;29:266–276. doi: 10.1055/s-0031-1275521. [DOI] [PubMed] [Google Scholar]
- 41.Poston L, Harthoorn LF, van Der Beek EM. Obesity in pregnancy: implications for the mother and lifelong health of the child. A consensus statement. Pediatr Res. 2011;69:175–180. doi: 10.1203/PDR.0b013e3182055ede. [DOI] [PubMed] [Google Scholar]
- 42.Vucetic Z, Kimmel J, Totoki K, Hollenbeck E, Reyes TM. Maternal high-fat diet alters methylation and gene expression of dopamine and opioid-related genes. Endocrinology. 2010;151:4756–4764. doi: 10.1210/en.2010-0505. [DOI] [PMC free article] [PubMed] [Google Scholar]
- 43.Bayol SA, Farrington SJ, Stickland NC. A maternal junk food diet in pregnancy and lactation promotes an exacerbated taste for junk food and a greater propensity for obesity in rat offspring. Br J Nutr. 2007;98:843–851. doi: 10.1017/S0007114507812037. [DOI] [PubMed] [Google Scholar]
- 44.Rankinen T, Zuberi A, Chagnon YC, et al. The human obesity gene map: the 2005 update. Obesity. 2006;14:529–644. doi: 10.1038/oby.2006.71. [DOI] [PubMed] [Google Scholar]
- 45.Oken E, Taveras EM, Kleinman KP, Rich-Edwards JW, Gillman MW. Gestational weight gain and child adiposity at age 3 years. Am J Obstet Gynecol. 2007;196:322.e1–8. doi: 10.1016/j.ajog.2006.11.027. [DOI] [PMC free article] [PubMed] [Google Scholar]
- 46.Gluckman PD, Hanson MA. The consequences of being born small-an adaptive perspective. Horm Res. 2006;65(Suppl 3):5–14. doi: 10.1159/000091500. [DOI] [PubMed] [Google Scholar]
- 47.Reaven G. Age and glucose intolerance: effect of fitness and fatness. Diabetes Care. 2003;26:539–540. doi: 10.2337/diacare.26.2.539. [DOI] [PubMed] [Google Scholar]