Abstract
Objective:
To evaluate the capacity of diffusion-weighted imaging (DWI) to determine the histological grade of small-sized hepatocellular carcinomas (HCCs) in liver cirrhosis in comparison with T2 weighted imaging.
Methods:
51 cirrhotic patients with 63 histologically proven HCCs ≤2 cm underwent abdominal MRI, including DWI (b-values 50, 400 and 800 s mm−2) and T2 weighted sequences. HCCs were classified into well-differentiated HCCs (n = 37) and moderately differentiated HCCs (n = 26). Relative contrast ratios (RCRs) between the lesions and the surrounding liver were performed and compared between the two groups for T2 weighted images, each b-value and apparent diffusion coefficients (ADCs). A receiver operating characteristic (ROC) analysis was performed to compare RCRs in T2 and diffusion-weighted images.
Results:
We found significant differences in RCRs between well-differentiated vs moderately differentiated HCCs for b = 50, 400 and 800 s mm−2 and T2 weighted images (1.35 ± 0.36 vs 1.86 ± 0.62; 1.35 ± 0.38 vs 1.82 ± 0.60; 1.27 ± 0.30 vs 1.74 ± 0.53; 1.14 ± 0.18 vs 1.43 ± 0.28, respectively; p < 0.001), whereas no significant differences were observed in ADC and ADC RCR (1.05 ± 0.19 vs 0.99 ± 0.15 and 1.1 ± 0.22 vs 1.09 ± 0.23; p = 0.16 and p = 0.82, respectively). No significant difference was found in the areas under the ROC curve for RCRs of T2 weighted images and every DWI b-value (p = 0.18).
Conclusion:
The RCR measurement performed in DWI 50, 400 and 800 b-values and T2 demonstrated a significant difference between well-differentiated and moderately differentiated small-sized HCCs. Furthermore, no difference was shown by using either ADC or ADC RCR.
Advances in knowledge:
DWI with RCR measurement may be a valuable tool for non-invasively predicting the histological grade of small HCCs.
Recent advances in liver imaging techniques and a better understanding of imaging findings have facilitated the detection of small nodules in cirrhotic livers. Nodular lesions ≤2 cm against a background of cirrhosis are diagnostically challenging in daily practice.1 The early and accurate diagnosis of hepatocellular carcinomas (HCCs) is of great importance because the best treatment results are obtained in patients with small and non-invasive HCCs.2,3 If small HCCs are not treated, they can grow aggressively and microscopic vascular invasion can occur before the 2-cm cut-off size for small HCCs.1 Fukuda et al4 reported that moderately and poorly differentiated HCCs ≤2 cm have a greater tendency towards microvascular invasion, meaning that the malignant potential of small HCCs should also be taken into account when selecting a treatment. Therefore, the accurate distinction of well-differentiated HCCs from less well-differentiated HCCs is also considered an important issue in planning of the therapeutic strategy, even if the tumour is small.5,6 Considering that histological confirmation of small suspicious hepatic nodules before treatment is often not possible owing to their location in the liver or the risks of track seeding, the role of a non-invasive pre-operative imaging technique for the discrimination of moderate to poorly differentiated HCCs from well-differentiated HCCs is important. Diffusion-weighted imaging (DWI) allows the characterization of microscopic proton displacement and has profoundly improved oncological imaging. Owing to the recent advances in MRI technology, DWI can be applied to liver imaging with improved image quality.7 Several clinical trials have demonstrated the benefit of DWI in the detection and characterization of focal liver lesions.8–11 There have been attempts to correlate DWI findings with the histological grading of HCCs using signal intensity (SI) and apparent diffusion coefficient (ADC) values, but no consensus in the results was obtained.12–18 To the best of our knowledge, the interplay between DWI and histopathological factors in a cohort of patients with exclusively small HCCs (<2 cm) has not been specifically investigated. The purpose of the present study was to investigate whether or not diffusion-weighted (DW) images and ADC could determine the histological grading of HCCs <2 cm in diameter.
METHODS AND MATERIALS
Patients
This study was conducted in agreement with the French law (4 March 2002)19 and the Declaration of Helsinki,20 and the requirement for informed consent was waived. Patients enrolled were a subset of a larger prospective cohort of patients presenting with small undetermined benign and malignant cirrhotic nodules. A qualitative analysis of the whole cohort has been previously published.21 Patients were included if they had HCC nodules <2 cm with pathological proof of the grade of HCC. HCCs <6 mm in size were excluded in order to avoid gross errors due to partial volume effects. We finally enrolled a total of 51 patients (43 males and 8 females; mean age, 64.5 years; age range, 45–88 years) with 63 definite histopathologically confirmed HCCs ≤2 cm. Of these, 41 patients had 1 HCC each, 8 had 2 HCCs and 2 had 3 HCCs. None of the nodules had been treated before MRI evaluation. All histopathologically proven HCCs were considered to be associated with liver cirrhosis according to the results of biopsy, ultrasonography, MRI and clinical findings. The following causes of liver cirrhosis were recorded: chronic hepatitis C (n = 17), hepatitis B (n = 4), alcohol abuse (n = 26), non-alcoholic steatohepatitis (n = 2) and unknown (n = 2). The clinical severity and progression of cirrhosis, which were evaluated using the Child–Pugh classification, were grade A in 44 patients and grade B in 7 patients.
Lesion confirmation
Pathological specimens were obtained from hepatic resection (n = 17), transplantation (n = 6) and percutaneous needle biopsy (n = 40, ≥2 core-biopsy specimens for each HCC). The median interval between MRI and surgery/biopsy was 22 days (range, 1–80 days). Gross and microscopic analyses of all specimens were performed by an experienced hepatobiliary pathologist (BB). These lesions were sampled at histological examination (haematoxylin and eosin staining). The HCCs were graded according to a modified version of the Edmonson and Steiner classification.22,23 Specifically, modified Edmondson and Steiner grades 1 and 2 were defined as well-differentiated, grade 3 as moderately differentiated and grade 4 as poorly differentiated. In tumours exhibiting several regions of differentiation, grading was established according to the highest grade observed. As a final result, the 63 small HCCs consisted of 37 well-differentiated HCCs and 26 moderately differentiated HCCs. Furthermore, 81% of the nodules (51) were found in the right lobe, with the remaining ones (12) in the left lobe.
MRI technique
The patients were examined on a 1.5-T clinical MR unit (MAGNETOM® Avanto; Siemens Healthcare, Erlangen, Germany) using one anterior torso phased-array coil with six channels and two posterior spine clusters with three channels each.
The routine MRI protocol included a transverse T1 weighted fast gradient-recalled dual-echo sequence [repetition time (TR)/echo time (TE)in-phase/TEout-of-phase, 126–149/4.76/2.38 ms; flip angle, 70°; field of view, 30–40 cm; matrix, 256 × 156 pixels; section thickness/gap, 6/0.6 mm; and signal average, one], a transverse respiratory-triggered T2 weighted fast spin-echo sequence with spectral fat saturation (TR/TE, 3095–8241/84 ms; flip angle, 150°; field of view, 30–40 cm; matrix, 384 × 207; section thickness/gap, 6/0.6 mm; and signal average, one) and a dynamic contrast-enhanced three-dimensional gradient-echo volumetric interpolated breath-hold examination (VIBE) sequence performed in the arterial, venous and delayed phases.
DW images were acquired in the transverse plane prior to gadolinium injection with three directional gradients using respiratory-triggered single-shot echo planar imaging with prospective acquisition correction and using spectral attenuated inversion recovery technique for fat suppression. The gradient factors (b-values) were 50, 400 and 800 s mm−2. The technical parameters were as follows: TR/TE, 2336–7216/79 ms; flip angle, 90°; field of view, 30–40 cm; matrix 192 × 115 pixels; slice width/gap, 6/0.6 mm; signal averages, two; receiver bandwidth, 1445 Hz per pixel; and total scan time, 3–4 min. Parallel imaging was performed using generalized autocalibrating partially parallel acquisitions with an acceleration factor of 2 as well as a partial 75% phase Fourier to reduce TE and minimize artefacts. The total slices of DW-MR images varied as a function of liver length, and 30 was the modal number of slices acquired. The gap and field of view were occasionally changed according to the size of the liver and the torso in each patient to ensure coverage of the whole liver.
Quantitative ADC maps were created on a voxel-by-voxel basis using the algorithms implemented within the Siemens MAGNETOM scanner software and using the three b-values of 50, 400 and 800 s mm−2.
Image analysis
Quantitative evaluation
Quantitative analysis was performed by two radiologists in consensus (AR and FLM) on a commercially available workstation (Leonardo; Siemens Healthcare). Each nodule was manually contoured [free-hand regions of interest (ROIs)] on DW images (on either b = 50, 400 and 800 s mm−2) depending upon the visual conspicuity and delineation of the tumour within these images at the maximum diameter of the lesion. The SI of each ROI was recorded. The ROIs for each lesion were carefully placed within the confines of the lesion in order to not exclude various components with different signal values. Subsequently, ROIs were copied and pasted on the same slices obtained at the other b-value DW and T2 images. When the lesion was not visualized well on the DW images, the T1 weighted images and the contrast-enhanced T1 weighted images were reviewed for the accurate placement of the ROI on the lesion by visual correlation of the image sets. Similarly, a circular ROI (100 pixels in average) was drawn in the adjacent hepatic parenchyma near the delineated lesion at the same slice position, avoiding visible vascular and biliary structures and artefacts. The relative contrast ratio (RCR) was calculated as follows: RCR = SIlesion/SIliver, where SIlesion was the SI of the lesion and SIliver was evaluated from hepatic tissue surrounding the lesion, as described by previous studies.24,25 Then, the ROIs were automatically propagated to the ADC map. The mean ADC values and the RCR of ADC of the nodules were obtained using the same ROIs established for the SI measurements. Finally, the exact size of each nodule was measured on the gadolinium-enhanced VIBE sequence on the most appropriated post-injection phase (arterial or portal).
Statistical analysis
Data were expressed as mean ± standard deviation. As all the analysed data were not following a normal distribution on Skewness and Kurtosis tests, Mann–Whitney U test was performed to compare the two histopathological groups for ADC and RCRs (calculated on b50, b400 and b800 DW images, T2 weighted images and ADC maps).
A ROC analysis was performed for RCR b50, b400, b800 DW images, T2 weighted images and ADC maps. Areas under the ROC curves were also compared.
In order to test the differences between RCRs for b50, b400 and b800 DWI values in the two histopathological groups, a Kruskal–Wallis test was performed on each group for these RCR values.
Differences were considered to be significant when the p-value was <0.05.
All statistical analyses were performed using Intercooled Stata® v. 10.0 (StataCorp LP, College Station, TX).
RESULTS
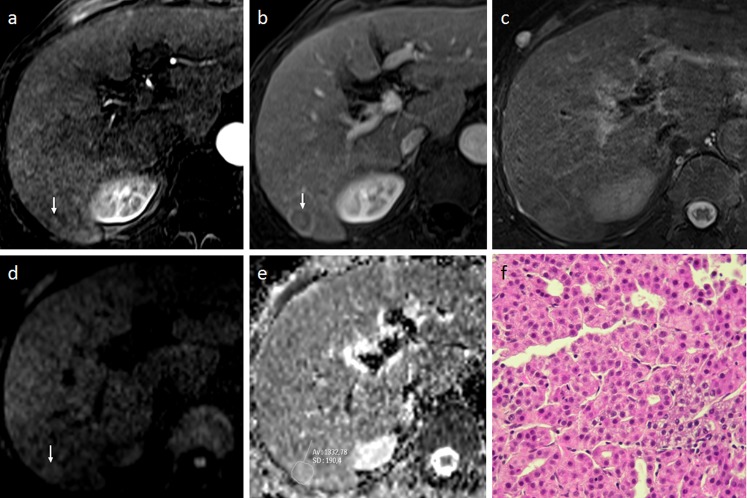
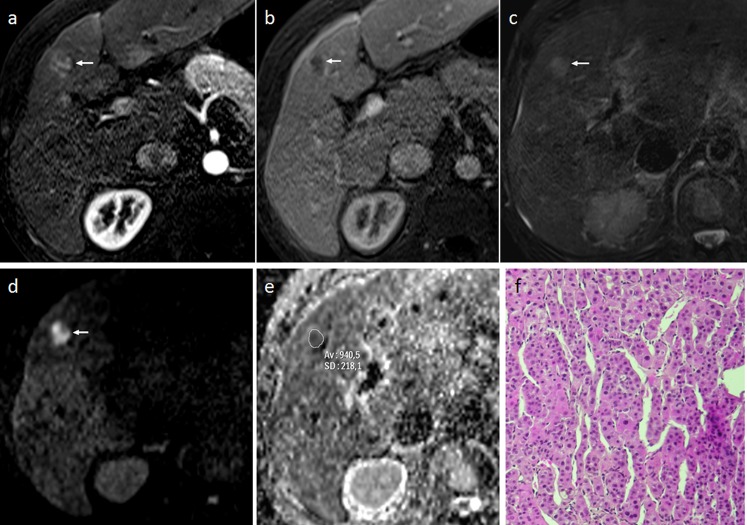
The whole MRI protocol was performed for all the 51 included patients. The mean diameter of the HCCs, measured on the gadolinium-enhanced VIBE sequences, was 14.2 ± 3.9 mm (range, 0.8–20 mm). Representative examples of well-differentiated HCCs and moderately differentiated HCCs are provided in Figures 1 and 2.
Figure 1.
A 78-year-old male with a well-differentiated hepatocellular carcinoma (HCC) in Segment VI (size, 15 mm). (a, b) Dynamic MRI shows a subtle enhanced nodule (arrow) in the arterial phase (a), followed by wash out with capsular enhancement (arrow) during the venous phase (b). (c) The nodule is not clearly distinguishable from the background liver on T2 weighted imaging. (d) diffusion-weighted MRI shows a slight hyperintensity relative to the surrounding liver at b800, correlating to a relative contrast ratio of 1.14. (e) The apparent diffusion coefficient of the tumour was 1.33 × 10⁻³ mm2 s−1. (f) Histopathology characterized the lesion as a well-differentiated HCC (haematoxylin and eosin staining). Av, average; SD, standard deviation.
Figure 2.
A 58-year-old male with moderately differentiated hepatocellular carcinoma (HCC) (size 14 mm) in Segment IV. (a, b) Dynamic MRI shows heterogeneous enhancement of the nodule (arrow) in the arterial phase (a), followed by wash-out (arrow) during the venous phase (b). (c) The nodule is slightly hyperintense (arrow) relative to the surrounding hepatic parenchyma on T2 weighted imaging. (d) Diffusion-weighted MRI shows strong hyperintensity (arrow) relative to the surrounding liver at b800, correlating to a relative contrast ratio of 2.78. (e) The apparent diffusion coefficient of the tumour was 0.94 × 10⁻³ mm2 s−1. (f) Histopathology characterized the lesion as a moderately differentiated HCC (haematoxylin and eosin staining). Av, average; SD, standard deviation.
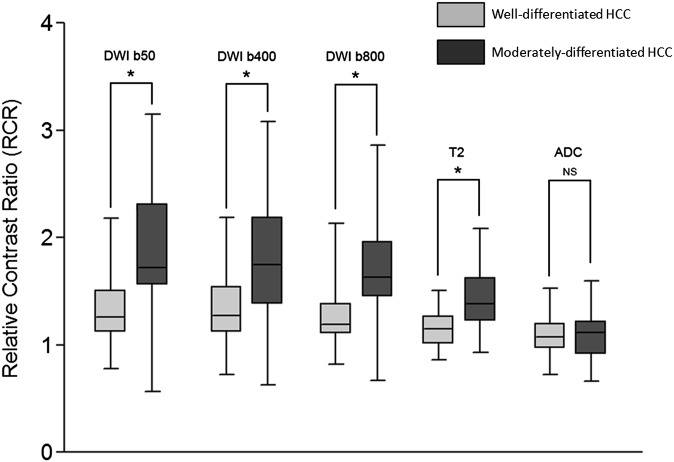
The mean RCR values for well-differentiated HCCs were 1.35 ± 0.36 (range, 0.69–2.46), 1.35 ± 0.38 (range, 0.68–2.35), 1.27 ± 0.30 (range, 0.81–2.17), 1.14 ± 0.18 (range, 0.85–1.65) and 1.09 ± 0.21 (range, 0.63–1.57) for, respectively, b = 50, 400 and 800 s mm−2 DW images, T2 weighted images and ADC map.
The mean RCR values for moderately differentiated HCCs were 1.86 ± 0.62 (range, 0.43–3.15), 1.82 ± 0.60 (range, 0.48–3.25), 1.74 ± 0.53 (range, 0.53–2.90), 1.43 ± 0.28 (range, 0.84–2.17) and 1.09 ± 0.23 (range, 0.63–1.68) for b = 50, 400 and 800 s mm−2 DW images, T2 weighted images and ADC map, respectively.
This lead to a significant difference between well-differentiated and moderately differentiated HCCs for b = 50, 400 and 800 s mm−2 DWI and T2 weighted images (p < 0.001). Conversely, no significant difference was found in RCRs for ADC map (p = 0.82) (Figure 3).
Figure 3.
Box and whisker plots of relative contrast ratios (RCRs) for b = 50, 400 and 800 s mm−2 diffusion-weighted imaging (DWI), T2 weighted and apparent diffusion coefficient (ADC) images. The boxes show the 25th and 75th percentile (interquartile) ranges. Median values are shown as a horizontal black bar within each box. The whiskers show levels outside the 5th and 95th percentiles. Significant differences are indicated by a star. HCC, hepatocellular carcinoma; NS, not significant.
No significant difference was found in ADC between the two groups: 1.05 ± 0.19 × 10⁻³ mm2 s−1 (range, 0.64–1.59 mm2 s−1) vs 0.99 ± 0.15 × 10⁻³ mm2 s−1 (range, 0.65–1.28 mm2 s−1) for well-differentiated and moderately differentiated HCCs (p = 0.16), respectively.
No significant differences were found between RCRs for b50, b400 and b800 DW images for the well-differentiated and moderately differentiated HCC groups (p = 0.54 and p = 0.57, respectively).
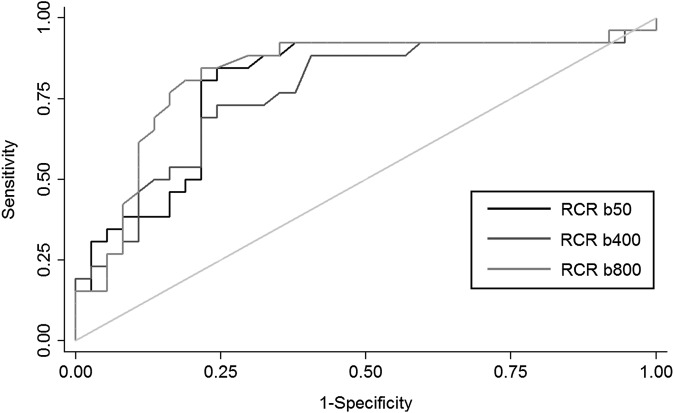
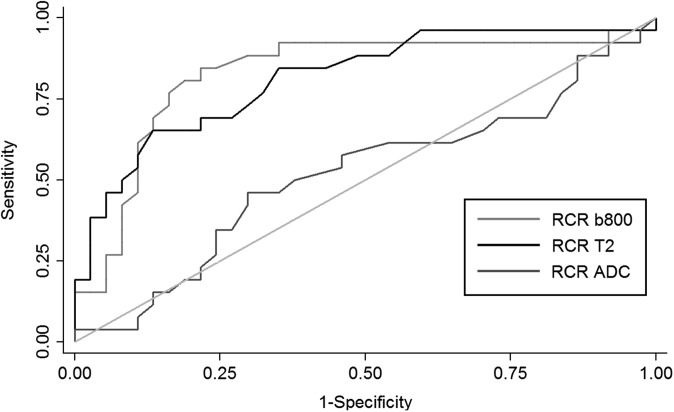
The ROC analysis (Figures 4 and 5) demonstrated a maximal accuracy for identifying well-differentiated vs moderately differentiated HCCs with a cut-off of 1.52 for RCRs for b50, 1.55 for b400 and 1.43 for b800 DW images (accuracy of 79%, 74% and 81%, respectively) and a cut-off of 1.35 for the RCR of T2 weighted images (accuracy of 77%). With these thresholds, the sensitivity and specificity were, respectively, 84% and 75% for b50, 73% and 75% for b400, 81% and 81% for b800 and 65% and 86% for T2 weighted images. No difference in the area under the ROC curve was found between RCRs of b50, b400 and b800 DWI and T2 weighted images (p = 0.17).
Figure 4.
Receiver operating characteristic curves for relative contrast ratio (RCR) of diffusion-weighted imaging sequence at b = 50, b = 400 and b = 800 s mm−2. The isoline is also provided.
Figure 5.
Receiver operating characteristic curves for relative contrast ratios (RCRs) of b = 800 s mm−2 diffusion-weighted imaging (copied from Figure 4), T2 weighted images and apparent diffusion coefficient (ADC). The isoline (reference) is also provided.
DISCUSSION
In this study, we evaluated the differences in RCRs between well-differentiated and moderately differentiated HCCs <2 cm on b = 50, 400 and 800 DW images, T2 weighted images and the ADC map. Regarding T2 weighted sequences, the RCR was significantly higher in moderately differentiated HCCs than in well-differentiated HCCs (mean, 1.43 vs 1.14). This is in accordance with previous studies that demonstrated that HCCs with moderate to poor differentiation showed greater hyperintensity on T2 weighted images in comparison with well-differentiated HCCs.26,27 This feature could be related to an increase of water content in the high-grade HCCs as well as an increased number of blood sinusoids with an increased amount of intratumoral blood volume.28
Similarly, RCR was significantly higher in moderately differentiated HCCs than in well-differentiated HCCs for b50, b400 and b800 DW images. Nevertheless, there were no significant differences in RCRs between these three b-values within each HCC group. In addition, the area under the ROC curve was not different between the RCRs calculated on the different b-values and on the T2 weighted images. These results suggest that T2 effect is certainly the main driver of differences in SI between well-differentiated and moderately differentiated small HCCs on DW images. This element is supported by the absence of differences in ADC values as well as in RCR ADC between the two groups of HCCs. Indeed, the evolution of the MR signal, when increasing b-value, mainly depends on the T2 component of the lesion and the diffusion of water within the lesion, assessed by the calculation of the ADC. Values of ADC in HCC lesions have been reported with variable results in the literature. Xu et al12 reported a considerable overlap between the ADC values (using b factors of 0–600 and 0–1000) of benign cirrhotic nodules, HCCs with different histological grades and the surrounding cirrhotic parenchyma in a rat model. Vandecaveye et al25 confirmed these findings and also showed similarities in the ADC values (using b factors of 0–1000) between benign and malignant nodules in the cirrhotic liver, although they did not compare them between the different histopathological grades of the HCCs. Nasu et al13 reported on the correlation between the histological grading and DWI findings in a series of 125 resected HCCs of various sizes (range, 0.8–15 cm); they found no correlation between tumour grades and ADC (using b factors of 0 and 500 s mm−2), although the DWI SI of the HCC nodules increased with tumour grade. Conversely, Muhi et al14 showed significant differences both in signal intensities and ADC values (using b factors of 500 and 1000 s mm−2) between various grades of 98 hepatocellular nodules (size range, 0.8–5.3 cm), although there was still considerable overlapping. More recently, Nishie et al16 demonstrated a relationship between ADC and the histological grade in HCCs classified in five histological groups, but the difference was significant only between the extreme groups of HCCs, i.e. between well-differentiated HCCs and HCCs with a poorly differentiated component.
These discrepancies may be owing to problems in computing ADC. Indeed, liver cirrhosis and benign cirrhotic nodular changes also reduce water diffusion and then decrease the ADC, making it difficult to distinguish them from the low ADC related to diffusivity restriction in malignancy.12,25 Then, microcapillary perfusion effects could have influenced our results. The ADC was monoexponentially assessed, and images with multiple small b-values in order to separately assess the effects of perfusion and diffusion were not obtained. Our choice of 50 s mm−2 as the lowest b-value for the ADC calculation might have resulted in residual perfusion effects.29 Then, cardiac motion-related artefacts in the left lobe and noise contamination both distort ADC values to a certain degree.30,31 Finally, the partial volume averaging effect with the surrounding liver, especially in the case of the very small ROIs in our study, may also have impaired the reliability of the ADC measurements.32 In this regard, an international consensus preconized a minimum 2-cm ROI diameter in order to avoid inaccuracies in ADC measurements.33 This might explain the results from Nishie et al16 who found a significant difference between low- and high-grade HCCs with large-sized lesions [3.6 ± 3.1 cm (range, 1–17 cm)]. This was not possible in our study since we included only HCCs <2 cm.
Nevertheless, the absence of difference in ADC between well-differentiated and moderately differentiated HCCs of small size in our population could simply reflect the fact that there is no significant difference in terms of water diffusion between the two groups. Indeed, ADC modifications are related to changes in cellularity, nuclei size, nuclear/cytoplasmic ratio34,35 and intracellular organelles. These changes might be too small between our two groups of HCC to be measurable. They might also vary across the different types of HCC, which would explain the discrepancy in the results from the literature.
Finally, as demonstrated by the ROC analysis, DWI allows a small increase in sensitivity in comparison with T2 weighted images to differentiate between well-differentiated and moderately differentiated HCCs. Indeed, we obtained a sensitivity value of 81% for DWI (at b = 800) and 65% for T2 weighted images at the best level of accuracy for the two methods with a comparable specificity (81% vs 86%). This finding might indicate that DWI is more suitable than T2 for small HCC grading classification.
The present study had several potential limitations. First, 63% (40/63) of the nodules were histologically diagnosed by biopsy. The accuracy of biopsy for small (≤2 cm) hepatic nodules is limited because of the difficulty in the histopathological diagnosis of borderline lesions, such as dysplastic nodules and well-differentiated HCCs in the early stage.36,37 Moreover, HCC may have different grades of differentiation within the tumour, and the biopsy sample may not be representative of the whole tumour.38 However, the size of the lesions in this study was very small, therefore, it was thought that there was less possibility of heterogeneity in the small HCCs. Values of ADC and signal on DWI are relative and difficult to compare from one patient to another. We attempted to limit this effect by using RCR instead of absolute signal values of the lesion but this method suffered from the fact that the surrounding liver is not healthy for all the patients and thus may not be a suitable baseline for comparison.
In conclusion, RCR on DWI and T2 weighted images allow differentiation between well-differentiated HCCs and moderately differentiated HCCs <2 cm with a better sensitivity for DWI than that of T2 weighted sequences. However, no significant difference was found in ADC between the two groups, suggesting that the T2 shine-though effect is the major determinant of the differences in DWI signal.
Acknowledgments
ACKNOWLEDGMENTS
We thank Nawele Boublay (Department of Medical Information and Research Evaluation, Hospices civils de Lyon) for statistical support.
REFERENCES
- 1.Willatt JM, Hussain HK, Adusumilli S, Marrero JA. MR imaging of hepatocellular carcinoma in the cirrhotic liver: challenges and controversies. Radiology 2008; 247: 311–30. [DOI] [PubMed] [Google Scholar]
- 2.Sala M, Llovet JM, Vilana R, Bianchi L, Solé M, Ayuso C, et al. Initial response to percutaneous ablation predicts survival in patients with hepatocellular carcinoma. Hepatology 2004; 40: 1352–60. [DOI] [PubMed] [Google Scholar]
- 3.Livraghi T, Meloni F, Di Stasi M, Rolle E, Solbiati L, Tinelli C, et al. Sustained complete response and complications rates after radiofrequency ablation of very early hepatocellular carcinoma in cirrhosis: is resection still the treatment of choice? Hepatology 2007; 47: 82–9. [DOI] [PubMed] [Google Scholar]
- 4.Fukuda S, Itamoto T, Nakahara H, Kohashi T, Ohdan H, Hino H, et al. Clinicopathologic features and prognostic factors of resected solitary small-sized hepatocellular carcinoma. Hepatogastroenterology 2005; 52: 1163–7. [PubMed] [Google Scholar]
- 5.Kim SH, Lim HK, Choi D, Lee WJ, Kim SH, Kim MJ, et al. Percutaneous radiofrequency ablation of hepatocellular carcinoma: effect of histologic grade on therapeutic results. AJR Am J Roentgenol 2006; 186: S327–33. [DOI] [PubMed] [Google Scholar]
- 6.Ikeda K, Seki T, Umehara H, Inokuchi R, Tamai T, Sakaida N, et al. Clinicopathologic study of small hepatocellular carcinoma with microscopic satellite nodules to determine the extent of tumor ablation by local therapy. Int J Oncol 2007; 31: 485–91. [PubMed] [Google Scholar]
- 7.Taouli B, Koh DM. Diffusion-weighted MR imaging of the liver. Radiology 2010; 254: 47–66. [DOI] [PubMed] [Google Scholar]
- 8.Taouli B, Vilgrain V, Dumont E, Daire JL, Fan B, Menu Y. Evaluation of liver diffusion isotropy and characterization of focal hepatic lesions with two single-shot echo-planar MR imaging sequences: prospective study in 66 patients. Radiology 2003; 226: 71–8. [DOI] [PubMed] [Google Scholar]
- 9.Parikh T, Drew SJ, Lee VS, Wong S, Hecht EM, Babb JS, et al. Focal liver lesion detection and characterization with diffusion-weighted MR imaging: comparison with standard breath-hold T2-weighted imaging. Radiology 2008; 246: 812–22. [DOI] [PubMed] [Google Scholar]
- 10.Bruegel M, Holzapfel K, Gaa J, Woertler K, Waldt S, Kiefer B, et al. Characterization of focal liver lesions by ADC measurements using a respiratory triggered diffusion-weighted single-shot echo-planar MR imaging technique. Eur Radiol 2008; 18: 477–85. [DOI] [PubMed] [Google Scholar]
- 11.Miller FH, Hammond N, Siddiqi AJ, Shroff S, Khatri G, Wang Y, et al. Utility of diffusion-weighted MRI in distinguishing benign and malignant hepatic lesions. J Magn Reson Imaging 2010; 32: 138–47. [DOI] [PubMed] [Google Scholar]
- 12.Xu H, Li X, Xie JX, Yang ZH, Wang B. Diffusion-weighted magnetic resonance imaging of focal hepatic nodules in an experimental hepatocellular carcinoma rat model. Acad Radiol 2007; 14: 279–86. [DOI] [PubMed] [Google Scholar]
- 13.Nasu K, Kuroki Y, Tsukamoto T, Nakajima H, Mori K, Minami M. Diffusion-weighted imaging of surgically resected hepatocellular carcinoma: imaging characteristics and relationship among signal intensity, apparent diffusion coefficient, and histopathologic grade. AJR Am J Roentgenol 2009; 193: 438–44. [DOI] [PubMed] [Google Scholar]
- 14.Muhi A, Ichikawa T, Motosugi U, Sano K, Matsuda M, Kitamura T, et al. High-b-value diffusion-weighted MR imaging of hepatocellular lesions: estimation of grade of malignancy of hepatocellular carcinoma. J Magn Reson Imaging 2009; 30: 1005–11. [DOI] [PubMed] [Google Scholar]
- 15.Heo SH, Jeong YY, Shin SS, Kim JW, Lim HS, Lee JH, et al. Apparent diffusion coefficient value of diffusion-weighted imaging for hepatocellular carcinoma: correlation with the histologic differentiation and the expression of vascular endothelial growth factor. Korean J Radiol 2010; 11: 295–303. [DOI] [PMC free article] [PubMed] [Google Scholar]
- 16.Nishie A, Tajima T, Asayama Y, Ishigami K, Kakihara D, Nakayama T, et al. Diagnostic performance of apparent diffusion coefficient for predicting histological grade of hepatocellular carcinoma. Eur J Radiol 2011; 80: e29–33. doi: 10.1016/j.ejrad.2010.06.019 [DOI] [PubMed] [Google Scholar]
- 17.Nakanishi M, Chuma M, Hige S, Omatsu T, Yokoo H, Nakanishi K, et al. Relationship between diffusion-weighted magnetic resonance imaging and histological tumor grading of hepatocellular carcinoma. Ann Surg Oncol 2012; 19: 1302–9. [DOI] [PubMed] [Google Scholar]
- 18.Suh YJ, Kim MJ, Choi JY, Park MS, Kim KW. Preoperative prediction of the microvascular invasion of hepatocellular carcinoma with diffusion-weighted imaging. Liver Transpl 2012; 18: 1171–8. [DOI] [PubMed] [Google Scholar]
- 19.France. Law no 2002-303 of March 4, 2002 on the rights of sick persons. JO Répub Franç no 54, 5 Mars 2002. p. 4118. Available from: www.legifrance.gouv.fr
- 20.World Medical Association. Review of the Declaration of Helsinki. Available from: http://www.wma.net
- 21.Le Moigne F, Durieux M, Bancel B, Boublay N, Boussel L, Ducerf C, et al. Impact of diffusion-weighted MR imaging on the characterization of small hepatocellular carcinoma in the cirrhotic liver. Magn Reson Imaging 2012; 30: 656–65. doi: 10.1016/j.mri.2012.01.002 [DOI] [PubMed] [Google Scholar]
- 22.Edmonson HA, Steiner PE. Primary carcinoma of the liver: a study of 100 cases among 48,900 necropsies. Cancer 1954; 7: 462–503. [DOI] [PubMed] [Google Scholar]
- 23.Nzeako UC, Goodman ZD, Ishak KG. Comparison of tumor pathology with duration of survival of North American patients with hepatocellular carcinoma. Cancer 1995; 76: 579–88. [DOI] [PubMed] [Google Scholar]
- 24.Koike N, Cho A, Nasu K, Seto K, Nagaya S, Ohshima Y, et al. Role of diffusion-weighted magnetic resonance imaging in the differential diagnosis of focal hepatic lesions. World J Gastroenterol 2009; 15: 5805–12. [DOI] [PMC free article] [PubMed] [Google Scholar]
- 25.Vandecaveye V, De Keyzer F, Verslype C, Op de Beeck K, Komuta M, Topal B, et al. Diffusion-weighted MRI provides additional value to conventional dynamic contrast-enhanced MRI for detection of hepatocellular carcinoma. Eur Radiol 2009; 19: 2456–66. [DOI] [PubMed] [Google Scholar]
- 26.Muramatsu Y, Nawano S, Takayasu K, Moriyama N, Yamada T, Yamasaki S, et al. Early hepatocellular carcinoma: MR imaging. Radiology 1991; 181: 209–13. [DOI] [PubMed] [Google Scholar]
- 27.Amano S, Ebara M, Yajima T, Fukuda H, Yoshikawa M, Sugiura N, et al. Assessment of cancer cell differentiation in small hepatocellular carcinoma by computed tomography and magnetic resonance imaging. J Gastroenterol Hepatol 2003; 18: 273–9. [DOI] [PubMed] [Google Scholar]
- 28.Shinmura R, Matsui O, Kobayashi S, Terayama N, Sanada J, Ueda K, et al. Cirrhotic nodules: association between MR imaging signal intensity and intranodular blood supply. Radiology 2005; 237: 512–19. [DOI] [PubMed] [Google Scholar]
- 29.Koh DM, Collins DJ. Diffusion-weighted MRI in the body: applications and challenges in oncology. AJR Am J Roentgenol 2007; 188: 1622–35. [DOI] [PubMed] [Google Scholar]
- 30.Kwee TC, Takahara T, Niwa T, Ivancevic MK, Herigault G, Van Cauteren M, et al. Influence of cardiac motion on diffusion-weighted magnetic resonance imaging of the liver. MAGMA 2009; 22: 319–25. [DOI] [PubMed] [Google Scholar]
- 31.Sandrasegaran K, Akisik FM, Lin C, Tahir B, Rajan J, Aisen AM. The value of diffusion-weighted imaging in characterizing focal liver masses. Acad Radiol 2009; 16: 1208–14. [DOI] [PubMed] [Google Scholar]
- 32.Kim SY, Lee SS, Byun JH, Park SH, Kim JK, Park B, et al. Malignant hepatic tumors: short-term reproducibility of apparent diffusion coefficients with breath-hold and respiratory-triggered diffusion-weighted MR imaging. Radiology 2010; 255: 815–23. [DOI] [PubMed] [Google Scholar]
- 33.Padhani AR, Liu G, Koh DM, Chenevert TL, Thoeny HC, Takahara T, et al. Diffusion-weighted magnetic resonance imaging as a cancer biomarker: consensus and recommendations. Neoplasia 2009; 11: 102–25. [DOI] [PMC free article] [PubMed] [Google Scholar]
- 34.Guo AC, Cummings TJ, Dash RC, Provenzale JM. Lymphomas and high-grade astrocytomas: comparison of water diffusibility and histologic characteristics. Radiology 2002; 224: 177–83. [DOI] [PubMed] [Google Scholar]
- 35.Nasu K, Kuroki Y, Kuroki S, Murakami K, Nawano S, Moriyama N. Diffusion-weighted single shot echo planar imaging of colorectal cancer using a sensitivity-encoding technique. Jpn J Clin Oncol 2004; 34: 620–6. [DOI] [PubMed] [Google Scholar]
- 36.Wanless IR. Liver biopsy in the diagnosis of hepatocellular carcinoma. Clin Liver Dis 2005; 9: 281–5. [DOI] [PubMed] [Google Scholar]
- 37.Kojiro M. Diagnostic discrepancy of early hepatocellular carcinoma between Japan and West. Hepatol Res 2007; 37: S121–4. [DOI] [PubMed] [Google Scholar]
- 38.Kojiro M. Focus on dysplastic nodules and early hepatocellular carcinoma: an Eastern point of view. Liver Transpl 2009; 10: S3–8. [DOI] [PubMed] [Google Scholar]


