

Abstract
Objective:
Through prior monoenergetic modelling, we have identified silver as a potential alternative to iodine in dual-energy (DE) X-ray breast imaging. The purpose of this study was to compare the performance of silver and iodine contrast agents in a commercially available DE imaging system through a quantitative analysis of signal difference-to-noise ratio (SDNR).
Methods:
A polyenergetic simulation algorithm was developed to model the signal intensity and noise. The model identified the influence of various technique parameters on SDNR. The model was also used to identify the optimal imaging techniques for silver and iodine, so that the two contrast materials could be objectively compared.
Results:
The major influences on the SDNR were the low-energy dose fraction and breast thickness. An increase in the value of either of these parameters resulted in a decrease in SDNR. The SDNR for silver was on average 43% higher than that for iodine when imaged at their respective optimal conditions, and 40% higher when both were imaged at the optimal conditions for iodine.
Conclusion:
A silver contrast agent should provide benefit over iodine, even when translated to the clinic without modification of imaging system or protocol. If the system were slightly modified to reflect the lower k-edge of silver, the difference in SDNR between the two materials would be increased.
Advances in knowledge:
These data are the first to demonstrate the suitability of silver as a contrast material in a clinical contrast-enhanced DE image acquisition system.
Contrast-enhanced (CE) dual-energy (DE) X-ray breast imaging provides quantitative functional information with high-resolution anatomical data in a single imaging procedure. DE images can be used to identify tumour neovasculature and morphology, and consequently aid in the detection and diagnosis of breast cancer.1–7 The most widely used approach for DE imaging is k-edge imaging. In this technique, two distinct energy spectra [low energy (LE) and high energy (HE)] are placed on either side of the k-edge of the contrast material. Through a weighted subtraction of the LE and HE images, it is possible to suppress the anatomical background signal and enhance the visualization of the contrast agent. The total dose of the two images is judiciously allocated so as to maximize the visibility of the contrast agent while providing an anatomical image of diagnostic quality. DE X-ray breast imaging has been shown to aid visualization of lesions that are otherwise mammographically occult as well as to provide functional blood flow information consistent with MRI—the current gold standard in functional breast imaging.1–3,7,8 This has led to the development of several DE imaging systems by Hologic® (Bedford, MA), General Electric (GE; Fairfield, CT) and Royal Philips (Amsterdam, Netherlands).7,9,10
Currently, CEDE breast imaging is performed with an iodinated contrast agent. These agents are typically small molecules consisting of tri-iodinated benzene rings with substitutions for improved solubility. They are extremely stable in the body and are excreted via urine without undergoing biochemical change. However, they are plagued by several limitations. Owing to their small size, these agents are rapidly filtered by the kidney and therefore necessitate immediate post-injection imaging.11 Filtration by the kidneys can lead to contrast-media-induced nephropathy in patients with pre-existing renal insufficiency, such as diabetes mellitus.12,13 The non-specific nature of the contrast agents results in random vascular permeation and low tumour-targeting potential. These limitations can be overcome with the use of a nanoparticle-based imaging agent. Nanoparticles can be targeted with surface ligands to attach to specific cell-surface antigens, increasing the amount of contrast material at the tumour.14–16 The nanoparticle surface can also be modified to prolong circulation times and thereby increase the dose delivered to the target site.14,17–19
We have previously developed a theoretical framework to identify new, candidate materials for DE X-ray breast imaging.20 The framework quantifies the DE signal difference-to-noise ratio (SDNR) as a function of atomic number (Z). The results demonstrated an optimal group of materials with Z from 42 to 63 in which the maximum SDNR varies by <15%. However, there are certain caveats to be considered before experimentally testing any of these materials. The theoretical model is based on a monoenergetic source of X-rays and demonstrated that as Z increases, the optimal X-ray energy for the HE image increases, while the allocation of dose to the LE image decreases. From a practical perspective, substantial filtration is necessary to obtain HE spectra with high mean energy. This results in infeasibly large tube current–time products (mAs) to ensure clinical image quality. In addition, LE images acquired with low doses will result in noisier anatomic images that will limit the effectiveness and applications of the imaging technique. Upon consideration of these constraints, contrast materials with lower atomic numbers are more suitable for testing. As iodine (I; Z = 53) is currently the standard in DE breast imaging and notably suffers from these limitations, it can be treated as the highest feasible atomic number for use as a contrast material.
Theoretical modelling and practical considerations have narrowed the list of potential DE contrast materials to those with atomic numbers ranging from 42 to 52. Silver (Ag; Z = 47) was chosen based on the following additional considerations. Ag represents a viable choice because of the large amount of literature already available on the development and manufacture of Ag nanoparticles.21–24 In addition, the prevalent use of silver filters in CEDE imaging means that the LE spectrum can be filtered to remove the energies above the k-edge of Ag contrast material. This is important because DE contrast can be only observed when the LE and HE spectra are predominantly on opposite sides of the k-edge of the imaging agent.
Nano-Ag represents the largest (25%) and fastest growing category of nanotechnology-based consumer products.25 Many of these applications make use of the broad-spectrum antimicrobial and optical scattering properties of Ag.21,26–32 For example, Kumar et al31 embedded Ag nanoparticles in household paint to develop an antimicrobial coating that can be directly applied to wood, glass and polymers. The surfaces coated with the Ag-embedded paint showed excellent antimicrobial effects on both Gram-positive and Gram-negative human pathogens. McFarland and Van Duyne32 used Ag nanoparticles in combination with dark-field microscopy for the quantitative sensing of streptavidin with a subpicomolar limit of detection. To our knowledge, there has been no work reported to date where the potential role of Ag nanoparticles as a radiographic agent is demonstrated.
In this work, we explore the feasibility of a Ag-based agent for DE X-ray breast imaging. The primary goal of this manuscript is to determine if a Ag agent could outperform an iodinated contrast agent on a commercially available imaging system with little or no modification to the existing system design. The imaging system investigated in this work is the commercial Hologic Dimensions™ CEDE X-ray acquisition system. The technique parameters, including LE and HE tube potential, filter material and mAs are pre-selected based on the thickness of the breast. These parameters were determined by Hologic using simulations and experimental validation using iodinated inserts in a Computerized Imaging Reference Systems phantom (CIRS Inc., Norfolk, VA). The total mean glandular dose (MGD) of the LE and HE image pair is set to equate roughly to a standard two-view mammographic examination.
For this article, a computational algorithm was developed in MATLAB® (MathWorks®, Natick, MA) to identify the set of image parameters, particular to this system, that optimize the SDNR for a Ag and I contrast agent. The algorithm was constrained by the values of HE and LE tube potential, filters and dose utilized by the imaging system. Thus, the findings presented here are not those of an optimization search, in the strictest sense. The algorithm was designed to test the performance of a Ag agent on an existing imaging system to determine the ease with which a potential agent could be transferred to the clinic. The algorithm was validated by comparing simulated metrics of DE SDNR with experimentally obtained values. The algorithm was then used to identify parameters with which to compare the performance of Ag and I using physical phantoms experimentally.
METHODS AND MATERIALS
Development of simulation algorithm
A simulation algorithm was developed in MATLAB to identify the set of clinically feasible technique factors and image processing parameters that maximized the SDNR for various imaging agents. The values of tube potential, filter materials and filter thicknesses chosen for the search reflect those that are available on the prototype Hologic CEDE Dimensions system (Table 1).
Table 1.
Values of parameters used in the simulation algorithm
| Parameter | Values |
|---|---|
| Target | Tungsten |
| LE | 23–35 kV |
| HE | 36–49 kV |
| Filter materials | LE: silver (50 µm), rhodium (50 µm) and aluminium (700 µm) HE: copper (300 µm) |
| Detector | Selenium, energy integrating, 200 µm |
| Breast thickness | 2–8 cm |
HE, high energy; LE, low energy.
Four constraints are placed on the simulation algorithm:
(1) The total MGD to the breast was calculated using the Dance model33,34 and set to match the Hologic system as a function of breast thickness.
(2) The allocation of the MGD between the LE and HE images (dose fraction) was allowed to vary from 10% (majority of the dose in HE) to 90% (majority of the dose in LE).
(3) The maximum mAs for each of the LE or HE image is 240. Techniques that produce LE or HE images above this value were eliminated from further study.
(4) A minimum signal threshold was required. Techniques that produced LE or HE images below the threshold were eliminated from further study.
The spectra (LE and HE) were generated using the interpolating polynomial method described by Boone et al.35 The spectra were then attenuated using the Beer–Lambert law through a combination of the filter material, air and 0.7 mm of beryllium. The source to image distance was 70 cm on the Hologic system. The spectra were then scaled appropriately to ensure that the total MGD to the breast from the LE and HE images matched the Hologic dose (Constraint 1). The mAs required to achieve this dose was then calculated. The mAs and signal intensity (SI) were tested to ensure they were within the limitations of the physical system (Constraints 3 and 4). If the mAs and SI criteria were met for the DE spectral pair, the simulation algorithm calculated the DE weighting factor, W, and the SDNR. In total, 26,460 unique combinations of imaging parameters were studied.
Calculation of W and signal difference-to-noise ratio
The SI recorded by the energy-integrating detector is given by:
 |
where Id is the spectral photon fluence incident on the detector, E is the energy (keV), ∆E is the size of the energy bins and  is the applied tube potential difference. The standard deviation, σ, of the SI is calculated as:
The exponent of 0.46 was obtained from Marshall et al.36 A value of 0.5 would correspond to a Poisson distribution of SI. This value is used directly under the assumption that the detector response of the Hologic Dimensions CEDE system is the same as that studied by Marshall (Selenia®; Hologic, Waltham, MA). In addition, the exponent is assumed to be constant across the various X-ray energies used in this analysis. The DE weighting factor is calculated as:
 |
The superscripts, a and g, refer to adipose and glandular tissue, respectively. This formulation is adapted from our previous theoretical model to account for polyenergetic spectra.20 The weighting factor is calculated so as to remove the signal variation that arises from various admixtures of adipose and glandular tissue. The expression of W is similar to the subtraction weighting factors used in the literature.37,38 DE SI (SIDE) is calculated from the LE and HE SI as:
This calculation is performed for breast tissue with and without added contrast material (superscripts cont and bkg, respectively). The resulting imaging contrast is quantified using SDNR:
 |
The DE standard deviation (σDE) is calculated as:
 |
The expression of σDE is the propagation of error resulting from the weighted subtraction of the LE and HE signal intensities. The covariance term (cov) was experimentally measured by imaging a 4-cm block acrylic phantom using combinations of LE and HE spectral pairs. The resulting values of σDE, σLE and σHE were used with Equation (6) to obtain the covariance. A representative value of the covariance, averaged over the spectral pairs, was used for the analysis. The effect of filter material, dose fraction and breast thickness on the values of W and SDNR of a Ag contrast agent were then studied.
Validating the simulation algorithm
The results of the simulation algorithm were validated using physical phantoms. 10 spectral pairs were chosen to be experimentally measured on the prototype Hologic Dimensions CEDE system (Table 2). These were chosen to encompass a variety of LE and HE tube potential pairs, filter materials and LE dose fractions. In all cases, raw images (“For Processing” in Hologic) were used for quantitative analysis. These images have minimal image processing applied to them and have pixel values that are analogous to the signal intensities derived by the simulation. W and SDNR were obtained experimentally and compared with the values obtained from the simulation.
Table 2.
Representative spectral pairs that were chosen to validate the simulation results
| Spectral pair | HE (kV) | LE (kV) | LE filter | LE dose fraction (%) |
|---|---|---|---|---|
| 1 | 36 | 28 | Aluminium | 70 |
| 2 | 42 | 28 | Aluminium | 60 |
| 3 | 49 | 28 | Aluminium | 60 |
| 4 | 36 | 26 | Rhodium | 90 |
| 5 | 42 | 26 | Rhodium | 50 |
| 6 | 49 | 26 | Rhodium | 40 |
| 7 | 42 | 32 | Silver | 40 |
| 8 | 42 | 35 | Silver | 80 |
| 9 | 49 | 32 | Silver | 70 |
| 10 | 49 | 35 | Silver | 60 |
HE, high energy; LE, low energy.
The representative spectral pairs consist of a mixture of LE, HE tube potential combinations, filter materials and LE dose fraction.
W was measured using phantoms consisting of blocks of 100% adipose-equivalent and 100% glandular-equivalent CIRS materials. The phantom materials were placed upon a lead sheet having a 10-mm diameter aperture to reduce the influence of scatter. Similarly, the assembly was imaged using a geometric magnification of 1.4 to reduce the number of scattered photons further (Figure 1). The raw pixel values were measured in a region of interest (3.5 × 3.5 mm) after the system-specific flat-fielding algorithm was applied. W was then calculated using Equation (3). Multiple regions of interest were used to determine the error in the calculation of W.
Figure 1.
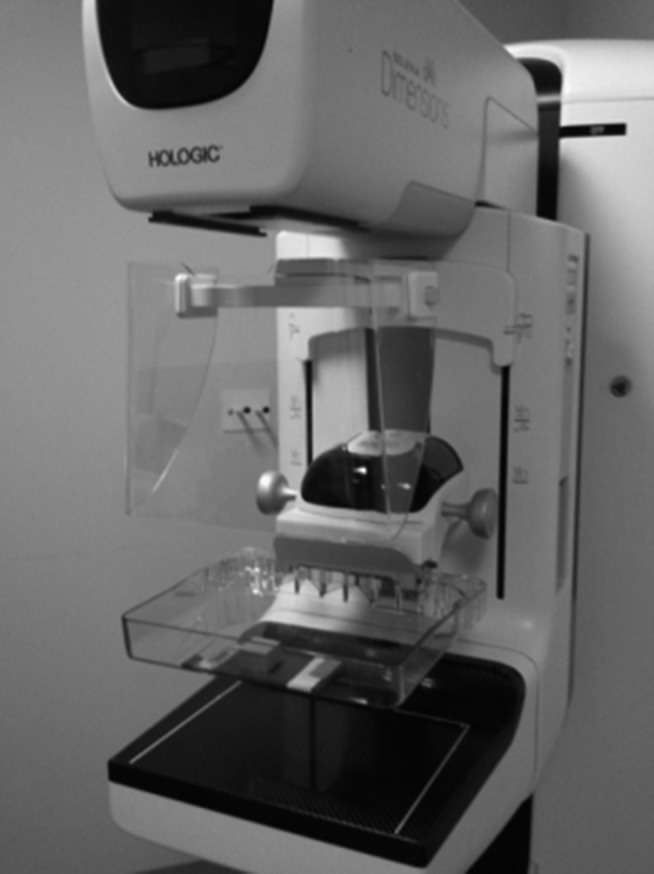
Experimental set-up for determining W. Adipose- or glandular-equivalent materials of Computerized Imaging Reference Systems Inc., Norfolk, VA, were placed on a lead sheet with a hole and imaged under geometric magnification.
To measure SDNR, the lead sheet was removed, and a 50-µm strip of Ag foil was placed on the surface of a 4-cm step phantom set directly on the breast support. LE and HE images were acquired for each spectral pair and subtracted to create DE images. Regions of interest (3.5 × 3.5 mm) in the DE image were chosen in the background and Ag foil to correspond to  and
and  , respectively. SDNR was calculated using Equations (4)–(6). Multiple regions of interest were used to determine the error in the calculation of SDNR.
Comparing signal difference-to-noise ratio between silver and iodine
A solution of Omnipaque™ (GE Healthcare, Little Chalfont, UK) iodinated contrast material was diluted to a final concentration of 16 mg ml−1 of I. An equivalent concentration of Ag was obtained by dissolving the required amount of silver nitrate in water. The two solutions were used to compare the SDNR of Ag and I contrast materials in a specially fabricated contrast-embedded step phantom. The phantom measured 3 × 4 × 10 cm (height × width × length). The phantom was positioned such that the X-ray path length through the phantom was equal to the height of the phantom (3 cm). A 4-mm hole was bored along the longitudinal direction to accommodate a Tygon® (Saint-Gobain, Courbevoie, France) R-3603 plastic tube (inner diameter, 3/32 inches; outer diameter, 5/32 inches) containing the contrast agents to be imaged against varying glandular percentages (from 0% to 100% glandularity, in 25% increments).
Using the simulation, the maximum SDNR at a thickness of 3 cm was determined for each of the three LE filter materials. This was performed for both I and Ag, yielding six optimal spectral pairs. For each filter material, four imaging conditions were then carried out: (i) Ag at optimal Ag imaging conditions, (ii) I at optimal I imaging conditions, (iii) Ag at optimal I imaging conditions and (iv) I at optimal Ag imaging conditions.
RESULTS
Simulation
If the simulation were to include all the possible combinations available on the prototype Hologic Dimensions CEDE system, as determined by Constraints 1 and 2 described in the Development of simulation algorithm section, it would be possible to obtain values of SDNR for 26,460 unique combinations of imaging parameters. However, many of these combinations would be infeasible because they would either require impractical mAs or result in insufficient SI. Therefore, the mAs and SI criteria in Constraints 3 and 4 require that 76% of these combinations be eliminated. The following results were obtained using the remaining 6366 combinations of spectral pairs.
Weighting factor
Weighting factor, W, is calculated using Equation (3). From its formulation, W would be expected to show a dependence on the separation between the LE and HE spectra. This is demonstrated in Figure 2, where W is plotted as a function of the mean energies of the LE and HE spectra. The 6366 data points were fit to a second order polynomial surface with a root mean square error of 0.03. W is shown to decrease as the separation between the two spectra increases. This can be explained by an examination of the dependency of W on the signal intensities of adipose and glandular tissue. The natural logarithm of the SI is primarily dependent on the linear attenuation coefficient of the material. Thus, Equation (3) can be thought of as the difference in linear attenuation coefficient between adipose and glandular tissue at the HE divided by the difference at the LE. As the energy increases, the difference in linear attenuation coefficient between these two materials decreases. These data agree with previous monoenergetic calculations that show that W is smaller when the LE and HE values are further apart.20
Figure 2.

Surface plot of W as a function of the mean energy of the low-energy (LE) and high-energy (HE) spectra. The fitted surface is shown alone for better visibility. W is greatest when the two spectra are closest together and the least when the spectra are the furthest apart.
The relationship between W and the LE and HE mean energies can be used to explain the variation in W with all of the algorithm parameters. For example, Figure 3 shows W plotted for breast thicknesses ranging from 2 to 8 cm for a spectral pair of 46 kV HE with copper filtration and a 28 kV LE with rhodium filtration at a LE dose fraction of 40%. W increases with increasing breast thickness owing to beam hardening; as breast thickness increases, a greater proportion of the LE photons are attenuated. Although beam hardening affects both LE and HE spectra, the increase in mean energy is more noticeable in the LE spectrum owing to the higher proportion of LE photons. As a result, the mean energy of the LE spectrum increases faster than that of the HE spectrum. The reduction in spectral separation with increasing thickness results in an increase in the value of W.
Figure 3.

The effect of breast thickness on W. In this example, a 46-kV high-energy beam with copper filtration was paired with a 26-kV low-energy (LE) beam with rhodium filtration at a LE dose fraction of 40%. W increases as the breast thickness increases owing to beam hardening.
Signal difference-to-noise ratio
The SDNR for a Ag contrast agent was calculated using Equation (5). When SDNR was plotted against the mean energies of the LE and HE spectra, as in Figure 2, no correlation was observed. The effect of other compounding factors, such as dose and noise, mask any relationship that may otherwise exist. Therefore, the influence of individual imaging parameters on SDNR was studied to identify trends in the data.
The first parameter examined is the choice of filter material. The HE filter is always set to copper, as this is the only option available on the Hologic image acquisition system. Thus, the simulation exclusively selected copper for the HE spectrum, and any reference to filter material or thickness from this point forward corresponds to the LE filter. The effect of the three filter material choices on the SDNR is illustrated as a box plot in Figure 4. For these data points, the central mark is the median, the edges of the box are the 25th and 75th percentile and the whiskers extend to the most extreme data. The data for each filter material encompass multiple energy pairs, dose fractions and breast thicknesses. The data for aluminium, rhodium and Ag comprise 1753, 2349 and 2265 spectral pairs, respectively. Both the mean and the maximum SDNR are slightly greater for the higher Z filter materials (rhodium and Ag) than those of aluminium. This can be attributed to the fact that the rhodium and Ag filters are better able to position the mean energy of the LE spectrum immediately below the k-edge of Ag contrast material.
Figure 4.

Box plot of signal difference-to-noise ratio (SDNR) of a silver contrast material for the various low-energy filter materials chosen in the simulation algorithm (aluminium, rhodium and silver). The maximum SDNR is slightly greater for the higher Z filter materials (rhodium and silver) than that of aluminium. The box plots represent data spanning multiple energy pairs, breast thicknesses and dose fractions.
The effect of the LE dose fraction on the SDNR is illustrated as a box plot in Figure 5 using the same convention as Figure 4. Over the range plotted, the SDNR decreases with increasing dose to the LE image. Although the drop in SDNR is gradual when the dose fraction is between 30% and 50%, the decrease is more drastic for larger dose distributions to the LE image. By increasing the dose fraction to the LE image, the information obtained at the HE is reduced. In DE breast imaging, the HE image contains the majority of the signal arising from the contrast media. This HE information is necessary to provide sufficient SDNR of the contrast agent in the DE image. Dose fractions <30% are not shown as none of the imaging parameter combinations passed the mAs and SI criteria in Constraints 3 and 4 (the Development of simulation algorithm section). However, if these constraints are removed, we note that the SDNR reaches a maximum at a dose fraction of 20–30% and then decreases owing to the small LE signal at a dose fraction of 10%.
Figure 5.

Box plot of signal difference-to-noise ratio (SDNR) of a sliver contrast material for the various dose distributions to the low-energy (LE) image. SDNR decreases with increasing dose to the LE image. The box plots represent data spanning multiple energy pairs, filter combinations and breast thicknesses.
In this study, the breast thickness was allowed to vary from 2 to 8 cm. In order to eliminate the influence of dose when comparing the various breast thicknesses, SDNR can be normalized by the square root of the MGD. This normalization is carried out under the assumption that the detector is quantum noise limited in operation, which was ensured by setting the minimum SI threshold in the simulation. Figure 6 plots the SDNR per square root MGD for all breast thicknesses. The SDNR per square root MGD decreases with increasing breast thickness. This decrease can be attributed in part to beam hardening. Although the mean energy of the LE and HE spectra both increase when passing through thicker breasts, the effect is greater for the LE spectrum, which results in a decrease in the difference of mean energies between the two spectra. The reduction in spectral separation results in an increase in the proportion of the LE spectrum being positioned above the k-edge of Ag. This in turn reduces the effectiveness of the spectral pair to utilize the k-edge to obtain DE contrast.
Figure 6.

Box plot of signal difference-to-noise ratio (SDNR) per square root mean glandular dose (MGD) of a silver contrast material for the breast thicknesses from 2 to 8 cm. Across the range of breast thickness values, the SDNR decreases by 67%. The box plots represent data spanning multiple energy pairs, filter combinations and dose fractions.
Figure 6 does not, however, display the clinical performance of the system, as the dose is increased for thicker breasts to allow for adequate penetration through the tissue. The absolute SDNR value, shown in Figure 7, does not decrease as dramatically as the SDNR per square root MGD. Over the range of breast thicknesses studied, the absolute SDNR decreases by 35%, while the SDNR per square root MGD decreases by 63%. The doses selected by Hologic ensure that the clinical acquisition system is able to strike a balance between radiation dose and maintaining SDNR over a broad range of breast thicknesses.
Figure 7.

Box plot of signal difference-to-noise ratio (SDNR) of a silver contrast material for the breast thicknesses from 2 to 8 cm. As the thickness increases from 2 to 8 cm, the SDNR decreases by 36%. The box plots represent data spanning multiple energy pairs, filter combinations and dose fractions.
Signal difference-to-noise ratio for silver vs iodine at all breast thicknesses
The single best (optimal) technique for each of Ag and I was selected for each breast thickness. The SDNR per square root MGD for either contrast material was obtained for each of these imaging parameter sets to yield four separate values: (i) Ag at optimal Ag imaging conditions, (ii) I at optimal I imaging conditions, (iii) Ag at optimal I imaging conditions and (iv) I at optimal Ag imaging conditions. The optimal techniques for Ag and I are tabulated in Tables 3 and 4, respectively. For Ag, the LE tube potential is maintained at 26 kV, while the HE tube potential and LE dose fraction increase for increasing breast thickness. In the case of I, the HE tube potential is maintained at 49 kV, while the LE tube potential and LE dose fraction increase for larger breasts.
Table 3.
Optimal combinations of parameters to maximize signal difference-to-noise ratio of silver at breast thicknesses from 2 to 8 cm
| Breast thickness (cm) | HE (kV) | LE (kV) | LE filter | LE dose fraction (%) |
|---|---|---|---|---|
| 2 | 44 | 26 | Rhodium | 30 |
| 3 | 45 | 26 | Rhodium | 30 |
| 4 | 49 | 26 | Rhodium | 30 |
| 5 | 49 | 26 | Rhodium | 40 |
| 6 | 49 | 26 | Rhodium | 60 |
| 7 | 47 | 26 | Rhodium | 70 |
| 8 | 49 | 26 | Silver | 70 |
HE, high energy; LE, low energy.
The LE tube potential is maintained at 26 kV, while the HE tube potential and LE dose fraction is increased as the breast thickness increases.
Table 4.
The optimal imaging conditions to maximize signal difference-to-noise ratio for iodine identified by the simulation algorithm
| Breast thickness (cm) | HE (kV) | LE (kV) | LE filter | LE dose fraction (%) |
|---|---|---|---|---|
| 2 | 49 | 26 | Rhodium | 30 (50) |
| 3 | 49 | 26 | Rhodium | 30 (50) |
| 4 | 49 | 26 (28) | Rhodium | 30 (50) |
| 5 | 49 | 26 (29) | Rhodium | 30 (50) |
| 6 | 49 | 27 (31) | Rhodium | 50 |
| 7 | 49 | 28 (30) | Rhodium (silver) | 60 |
| 8 | 49 | 29 (32) | Rhodium (silver) | 60 (70) |
HE, high energy; LE, low energy.
Where different, the values used by Hologic® (Bedford, MA) are presented in parentheses.
The values of SDNR per square root MGD for each of the optimal techniques are plotted as a histogram for breast thicknesses between 2 and 8 cm in Figure 8. Over the range of breast thicknesses studied, the maximum SDNR for Ag is greater than that for I at their respective optimal imaging conditions. Ag has the greatest advantage for thinner breasts; at 2 cm, the SDNR per square root MGD for Ag is 28% higher than that of I. This advantage is reduced for thicker breasts; at 8 cm, the SDNR per square root MGD for Ag is only 3% higher than that of I. This is due in part to the fact that the HE tube potential must be increased with increasing breast thickness to ensure that a sufficient number of X-rays pass through the breast and are recorded by the detector. Increasing the HE tube potential results in the mean energy of the spectrum being located further away from the k-edge of Ag, which in turn decreases the SDNR. This effect is not as prominent with I owing to its higher k-edge, and the optimal HE spectra was the maximum tube potential available on the Hologic system.
Figure 8.

Comparison of simulated signal difference-to-noise ratio (SDNR) per square root mean glandular dose (MGD) between silver and iodine at breast thicknesses between 2 and 8 cm. Silver performs better than iodine at their respective optimal conditions for every thickness studied. Moreover, silver performed better than iodine when imaged using the optimal conditions for iodine.
Interestingly, the SDNR per square root MGD for Ag at the optimal imaging conditions for I is consistently greater than the optimal SDNR for I using the same imaging conditions. Thus, despite the fact that the clinical system under study was explicitly designed for iodinated contrast agents, our results suggest that Ag performs better as a contrast agent than I for every thickness from 2 to 8 cm even when using the imaging parameters that are optimal for I. Thus, a Ag contrast agent should be directly translatable to the clinic without any modification of the existing image acquisition systems or protocols.
Validating the simulation algorithm
The simulation was validated by testing in physical phantoms using the 10 spectral pairs tabulated in Table 2. These spectral pairs encompass a range of LE and HE tube potential, filter material and dose fraction. They do not represent optimal imaging conditions and were specifically chosen to provide a sufficiently, broad distribution of W and SDNR values with which to validate the simulation. The values of W and SDNR for Ag at each of the spectral pairs were obtained from the simulation. The spectral pairs were then used along with the method described in the Validating the simulation algorithm section to obtain experimental values of W and SDNR.
The simulated and experimentally obtained values of W are plotted parametrically in Figure 9. The data were fit to a linear regression (shown as a dashed line) with a Pearson correlation coefficient of 0.94. The slope of the fit is 1.02, while the y-intercept is 0.10. Similarly, the experimentally obtained values of SDNR using the contrast-embedded step phantom are compared with those obtained from the simulation algorithm in Figure 10. A Pearson correlation coefficient of 0.95 was obtained, and the slope and y-intercept of the linear fit are 0.18 and 7.83. The high Pearson correlation coefficients obtained for both W and SDNR indicate that the simulation algorithm is able to correctly predict the trends in SI observed in the prototype Hologic Dimensions CEDE system. The algorithm does not, however, perfectly predict the pixel values and will need to include additional processes such as detector gain in a future refinement.
Figure 9.

The experimentally obtained values of W are highly correlated with the simulated values. A Pearson correlation coefficient of 0.89 was calculated for the two data sets. Error bars indicate standard deviation.
Figure 10.

The experimentally obtained values of signal difference-to-noise ratio (SDNR) correlate well with the simulated values. A Pearson correlation coefficient of 0.93 was obtained between the two data sets.
Comparing signal difference-to-noise ratio between silver and iodine
Six optimal spectral pairs were identified to compare the SDNR between Ag and I contrast agents. The optimal imaging technique parameters for either contrast material were insensitive of the LE filter. The optimal technique for Ag is a 45-kV HE spectrum with a 26-kV LE spectrum at a dose fraction of 30%. While, that for I is a 49-kV HE spectrum and a 26-kV LE spectrum at a dose fraction of 30%.
SDNR was calculated using the method in described in the Calculation of W and signal difference-to-noise ratio section for equal volumetric concentrations of Ag and I using spectral pairs that comprised the optimal Ag and I imaging conditions for each of the three LE filter materials (aluminium, rhodium and Ag). An example of the LE, HE and DE images of the contrast-embedded step phantom obtained for one spectral pair are shown in Figure 11. The contrast material is observed within the plastic tubing as a region of low-intensity pixel values. The values of SDNR obtained for each contrast material are plotted in Figure 12. When imaged at their respective optimal conditions, Ag outperforms I regardless of the filter material chosen. On average, the SDNR for Ag is 43% higher than that of I. The superiority of Ag is such that the lowest SDNR for Ag is still 34% higher than the highest SDNR for I. The superior SDNR of Ag can be attributed to the lower k-edge, which means that the HE spectrum is better positioned for optimal DE subtraction. A theoretical study using monoenergetic models20 demonstrated that DE contrast is very sensitive to the placement of the HE value; the contrast decreases rapidly as the HE value is moved further from the k-edge of the contrast material. However, it is difficult to obtain HE spectra with mean energies in the range of 34–38 keV (above the k-edge of I) using a mammographic X-ray imaging system. In order to achieve suitable HE spectra, the imaging system would require tube potential values in excess of 50 kV with thicker filtration than is currently used in mammography.
Figure 11.

Example of low-energy (LE), high-energy (HE) and dual-energy (DE) images of the contrast-embedded step phantom with silver contrast material. The DE subtraction method removes the signal variation that exists in the background steps while maintaining the signal intensity within the contrast material.
Figure 12.

Comparison of experimental values of signal difference-to-noise ratio (SDNR) between silver (Ag) and iodine (I) for the optimal imaging parameters at each low-energy filter material. Ag performs better that I at their respective optimal imaging conditions, as well as the optimal conditions for I. The results are for a 3-cm step phantom.
Ag also performs better than I when imaging at the optimal conditions for I. For example, using the rhodium filter, the SDNR for Ag is 40% higher than that of I even though both were imaged at the optimal conditions for the latter. The maximum SDNR for I occurs at a HE tube potential value of 49. This is needed to ensure that a large portion of the spectrum is above the k-edge of I. However, even at the maximum tube potential value, a substantial portion of the HE spectrum is below the k-edge of I, and thus not contributing to the SDNR. When using a 49-kV HE spectrum with the copper filtration available on the Hologic CEDE system, 99% of the spectrum (in terms of the number of photons) is above the k-edge of Ag, whereas only 78% is above the k-edge of I. The remaining 22% of the spectrum that lies below the k-edge of I cannot contribute to the SDNR, providing Ag with an advantage, even at the best possible conditions for I. This is graphically illustrated in Figure 13, where the optimal LE and HE spectra for a 5-cm thick breast are overlaid with the mass attenuation coefficients for Ag and I.
Figure 13.

Overlay of the optimal low-energy (LE) and high-energy (HE) spectral pair for a 5-cm thick breast with the mass attenuation coefficients of silver and iodine. 99% of the HE spectrum is above the k-edge of silver. By contrast, only 78% of the HE spectrum is above the k-edge of iodine and thus contributing to the signal difference-to-noise ratio.
DISCUSSION
Our previous monoenergetic study20 identified several potential contrast materials as alternatives to I in CEDE breast imaging. That study predicted that materials with Z from 42 to 52 would provide the maximum contrast in DE imaging while still allocating a sufficient dose fraction to the LE image for clinically acceptable anatomical images. Upon further consideration, Ag (Z = 47) was chosen owing to the abundant availability of literature on the development of Ag nanoparticles, as well as the prevalent use of Ag filters in CEDE imaging. The former is important as it provides a solid base from which to develop a prototype contrast agent, whereas the latter implies that the LE spectrum can be filtered to provide a mean energy as close to the k-edge of Ag as possible.
The purpose of this study was to test the applicability of a Ag contrast agent, predicted by the theoretical model, in a commercially available DE breast imaging system. This is an important predicate step before significant effort is expended on developing novel contrast agents. The model is constrained in that it does not attempt to search all the possible technique parameters (such as filter materials) that could be used but is restricted to those that are available on the system being studied. This was performed to determine whether a Ag agent could replace an iodinated agent using an existing CEDE imaging system that was explicitly designed for iodine contrast imaging. The system under investigation in this work is the commercial Hologic Dimensions CEDE X-ray acquisition system. A polyenergetic simulation algorithm was developed to model the SI and noise of the clinical system. The simulation algorithm was then used to provide insight into the influence of imaging parameters on SDNR as well as identify techniques with which to compare the SDNR of Ag and I, objectively.
The DE weighting factor, W, is plotted in Figure 2 for the various combinations of mean energies available on the prototype Hologic system. The polyenergetic model of W follows the same trend as the monoenergetic model; W decreases as the separation between the LE and HE values increases. It is important to note that, similar to the monoenergetic calculation, W does not change with the choice of contrast agent and is only dependent on the linear attenuation coefficient of adipose and glandular tissue. However, secondary effects such as scatter will introduce a thickness dependency on the overall attenuation of tissue, and consequently on the value of W. These effects are not included in the current simulation algorithm and may need to be taken into consideration for further refinement.
The simulation algorithm was also used to analyse the influence of the technique parameters on the SDNR of a potential Ag contrast agent. The choice of filter material was not shown to exert as important a role as initially thought. Although the k-edge filters present in the system (Ag and rhodium) exhibited slightly higher mean and maximum values of SDNR than the non-k-edge filter (aluminium), the difference between the two groups was minimal. The thicknesses of the silver and rhodium filters used on the Hologic machine are not sufficient to completely remove X-ray photons above their respective k-edges. However, excessively thick high Z filter materials would require infeasibly large values of mAs to allow the spectra to penetrate the filter with sufficient fluence. However, given that the optimal LE spectra for Ag were limited to 26 kV, it may be possible to consider thicker filter thicknesses while compensating with high LE tube potential values.
The major influences on the SDNR of Ag were found to be the LE dose fraction and the breast thickness. An increase in the values of either of these parameters resulted in a decrease in the value of SDNR. By allocating a larger dose to the LE image, the technique is unable to utilize the contrast information that is present in the HE image and therefore results in a reduction in SDNR. Thus, while it is common practice to equally distribute the dose between the LE and HE images, our results suggest that the information contained in the HE image is more important to the SDNR of the contrast agent. However, additional practical considerations such as the quality of the anatomical image for diagnostic purposes must be taken into consideration before accepting the use of a lower dose fraction to the LE image. Therefore, a compromise must be struck between obtaining a good quality anatomical image to aid in the diagnosis, and the visualization and characterization of CE anatomical structures.
As previously mentioned, an increase in the breast thickness also results in a decrease in the value of SDNR. This is due to the increase in the mean energy of the HE spectrum as a result of beam hardening and the tube potential value being increased to penetrate through thicker tissue. As the HE spectrum is positioned further away from the k-edge of Ag, the ability of the DE technique to fully utilize the k-edge for contrast decreases. However, this effect can be reduced by increasing the allocated dose for thicker breasts—a practice that is clinically implemented. By following the dose scheme utilized by Hologic for their CEDE examinations, it is possible to maintain the SDNR of a Ag contrast over a substantial range of breast thicknesses, with only a slight degradation observed for thicker breasts (Figure 7).
The simulation algorithm identified the techniques that maximized the SDNR for Ag and I contrast agents over the range of breast thicknesses studied (Tables 3 and 4, respectively). For Ag, the optimal HE tube potential value is increased from 44 to 49 kV as breast thickness increases, while the LE tube potential value is maintained at 26 kV. A rhodium filter is optimal, except for the largest breast thickness studied where a Ag filter is preferred. The LE image, consisting of a 26-kV tungsten spectra filtered with rhodium is a classic example of a soft-tissue anatomical image obtained clinically. Therefore, the LE image would provide excellent anatomical and spatial localization of structures (calcifications and lesions), whereas the DE image can be used for quantitative analysis of contrast agent uptake. The optimal LE tube potential value agrees with the previous theoretical modelling using monoenergetic simulations20 that showed an optimal contrast LE value of 18 keV; roughly the mean energy of a 26-kV spectrum.
Conversely, the optimal HE tube potential for I is maintained at 49, while the LE tube potential value is increased from 26 to 29 as breast thickness increases. A rhodium filter is used throughout. The higher k-edge of I requires the HE tube potential value to be set to the maximum in an effort to ensure that the majority of the HE spectrum is above the k-edge of I. As a result, the LE tube potential value is forced to increase for thicker breasts. While this increase is not substantial, the LE anatomical image of thicker breasts may not provide the same level of detail as their thinner counterparts because the difference in attenuation between adipose and glandular tissue is reduced for higher LE tube potential values. The optimal technique parameters for I, as determined by the model, also presents an interesting opportunity to evaluate the technique parameters currently used by Hologic. By and large, the optimal simulated technique parameters agreed with those used clinically. There are, however, several instances where the techniques differ. The minimum LE dose fraction used by Hologic is 50%, while that used by the model is 30%. We presume that Hologic set this minimum dose fraction primarily to ensure a good quality LE anatomical image. In addition, the LE tube potential is increased faster as a function of breast thickness on the clinical system by Hologic than predicted by the model. These differences are minimal and the large level of concordance between the two techniques help to further validate the results of our algorithm.
The SDNR at each of the optimal techniques for Ag and I can be compared by examination of the simulation and experimental results (Figures 8 and 12, respectively). The simulation can be used to compare the two contrast agents over the range of breast thicknesses; a singular thickness was used for the experimental validation. Both methods support the same two conclusions:
(1) If the established technique parameters that are currently utilized in the clinic are considered, Ag provides a higher value of SDNR than I. This suggests that Ag is better suited as a DE imaging agent than I in the mammographic energy range. A biologically stable Ag imaging agent could be directly translated from development to clinical implementation without the need for modification or redesign of image acquisition systems.
(2) If the technique parameters are slightly modified to reflect the lower k-edge of Ag, the difference in SDNR between the two materials would be further increased. These modifications would consist primarily lower HE and LE tube potential values. The lower LE tube potential value may serve to boost the diagnostic application of the CEDE technique further by providing a good quality anatomical image with excellent soft-tissue contrast.
There are, however, several improvements that can be made to the simulation algorithm. For example, the algorithm does not incorporate the effects of scatter. The energy dependence of Compton and coherent scattering may have implications on the image quality when using a Ag or I imaging agent. The detrimental effect of scatter should be greater for I because of the higher LE and HE tube potential values used. The greater effect of scatter will result in a reduced SDNR for I compared with Ag than currently predicted. The algorithm will need to be modified with a Monte Carlo-type X-ray interaction simulation to adequately test this hypothesis. In addition, the SI generated by the model is not the same as the pixel value obtained using a particular imaging technique. This can be remedied by incorporating into the simulation the gain factors involved in the conversion of X-ray photons attenuated by the detector to a digital value. Once the pixel value is predicted exactly, the simulation algorithm could be used in assisting the system design process by identifying optimal filter materials and thicknesses for imaging either a Ag or I contrast agent.
CONCLUSION
This work explores the use of a Ag imaging agent as an alternative to I in CEDE X-ray breast imaging. Iodinated agents are used extensively in X-ray projection imaging and display excellent biocompatibility and stability within the body. However, the lower energies available to clinical DE X-ray breast imaging than those of other organs in the body suggests that an alternative material may be better suited. Previously conducted theoretical analysis demonstrated that materials with atomic numbers from 42 to 52 should be explored as potential candidates. From these materials, Ag was chosen for further investigation. The prominence of Ag filters in breast X-ray imaging devices and Ag nanoparticles in consumer products suggested that a Ag-based imaging agent might have practical application in CEDE X-ray breast imaging.
An algorithm was developed in MATLAB to simulate the image acquisition of the Hologic Dimensions CEDE system. The SDNR of Ag was compared with that of I for imaging parameters that comprised the optimal conditions for either material. Not only does Ag perform better than I when imaged at their respective optimal conditions but also Ag is able to provide greater SDNR than I when imaged with protocols that are optimal for I. This means that a Ag contrast agent could be translated to the clinic without modification of machine or protocol. Work into developing a biologically stable Ag nanoparticle agent, although outside of the scope of this manuscript, is warranted and preliminary data show promise.39
FUNDING
This work was supported by the Department of Defense (W81XWH-09-1-0055 and W81XWH-11-1-0246) and the National Institute of Health (NIH/NBIB R21-EB013754).
Acknowledgments
ACKNOWLEDGMENTS
The authors would like to thank Cornell Williams (Hologic Inc., Bedford, MA) for his expertise with the prototype contrast-enhanced dual-energy acquisition system.
REFERENCES
- 1.Jochelson MS, Dershaw DD, Sung JS, Heerdt AS, Thornton C, Moskowitz CS, et al. Bilateral contrast-enhanced dual-energy digital mammography: feasibility and comparison with conventional digital mammography and MR imaging in women with known breast carcinoma. Radiology 2013; 266: 743–51. [DOI] [PMC free article] [PubMed] [Google Scholar]
- 2.Froeling V, Diekmann F, Renz DM, Fallenberg EM, Steffen IG, Diekmann S, et al. Correlation of contrast agent kinetics between iodinated contrast-enhanced spectral tomosynthesis and gadolinium-enhanced MRI of breast lesions. Eur Radiol 2013; 23: 1528–36. [DOI] [PubMed] [Google Scholar]
- 3.Dromain C, Thibault F, Diekmann F, Fallenberg EM, Jong RA, Koomen M, et al. Dual-energy contrast-enhanced digital mammography: initial clinical results of a multireader, multicase study. Breast Cancer Res 2012; 14: R94. doi: 10.1186/bcr3210 [DOI] [PMC free article] [PubMed] [Google Scholar]
- 4.Carton A-K, Ullberg C, Maidment AD. Optimization of a dual-energy contrast-enhanced technique for a photon-counting digital breast tomosynthesis system: II. An experimental validation. Med Phys 2010; 37: 5908–13. [DOI] [PMC free article] [PubMed] [Google Scholar]
- 5.Carton AK, Ullberg C, Lindman K, Acciavatti R, Francke T, Maidment AD. Optimization of a dual-energy contrast-enhanced technique for a photon-counting digital breast tomosynthesis system: I. A theoretical model. Med Phys 2010; 37: 5896–907. [DOI] [PMC free article] [PubMed] [Google Scholar]
- 6.Carton AK, Gavenonis SC, Currivan JA, Conant EF, Schnall MD, Maidment AD. Dual-energy contrast-enhanced digital breast tomosynthesis—a feasibility study. Br J Radiol 2010; 83: 344–50. doi: 10.1259/bjr/80279516 [DOI] [PMC free article] [PubMed] [Google Scholar]
- 7.Chen SC, Carton AK, Albert M, Conant EF, Schnall MD, Maidment ADA. Initial clinical experience with contrast-enhanced digital breast tomosynthesis. Acad Radiol 2008; 14: 229–38. doi: 10.1016/j.acra.2006.10.022 [DOI] [PMC free article] [PubMed] [Google Scholar]
- 8.Lewin JM, Isaacs PK, Vance V, Larke FJ. Dual-energy contrast-enhanced digital subtraction mammography: feasibility. Radiology 2003; 229: 261–8. doi: 10.1148/radiol.2291021276 [DOI] [PubMed] [Google Scholar]
- 9.MedImaging.net. Contrast-enhanced spectral mammography offers dual-energy image acquisition [Cited 3 September 2013.] Available from: http://www.medimaging.net/radiography/articles/294737841/contrastenhanced_spectral_mammography_offers_dualenergy_image_acquisition.html [Google Scholar]
- 10.Molloi S. Spectral mammography using a photon counting detector provides a unique method for measurements of breast density. Amsterdam, Netherlands: Philips Healthcare; 2013.
- 11.Hainfeld JF, Slatkin DN, Focella TM, Smilowitz HM. Gold nanoparticles: a new X-ray contrast agent. Br J Radiol 2006; 79: 248–53. doi: 10.1259/bjr/13169882 [DOI] [PubMed] [Google Scholar]
- 12.Weisberg LS, Kurnik PB, Kurnik BR. Risk of radiocontrast nephropathy in patients with and without diabetes mellitus. Kidney Int 1994; 45: 259–65. [DOI] [PubMed] [Google Scholar]
- 13.Cigarroa RG, Lange RA, Williams RH, Hillis LD. Dosing of contrast material to prevent contrast nephropathy in patients with renal disease. Am J Med 1989; 86: 649–52. [DOI] [PubMed] [Google Scholar]
- 14.Wang M, Thanou M. Targeting nanoparticles to cancer. Pharmacol Res 2010; 62: 90–9. doi: 10.1016/j.phrs.2010.03.005 [DOI] [PubMed] [Google Scholar]
- 15.Han H, Davis ME. Single-antibody, targeted nanoparticle delivery of camptothecin. Mol Pharm 2013; 10: 2558–67. doi: 10.1021/mp300702x [DOI] [PMC free article] [PubMed] [Google Scholar]
- 16.Vlashi E, Kelderhouse LE, Sturgis JE, Low PS. Effect of folate-targeted nanoparticle size on their rates of penetration into solid tumors. ACS Nano 2013; 7: 8573–82. doi: 10.1021/nn402644g [DOI] [PubMed] [Google Scholar]
- 17.Fang C, Shi B, Pei YY, Hong MH, Wu J, Chen HZ. In vivo tumor targeting of tumor necrosis factor-alpha-loaded stealth nanoparticles: effect of MePEG molecular weight and particle size. Eur J Pharm Sci 2006; 27: 27–36. doi: 10.1016/j.ejps.2005.08.002 [DOI] [PubMed] [Google Scholar]
- 18.Cheng L, Yang K, Chen Q, Liu Z. Organic stealth nanoparticles for highly effective in vivo near-infrared photothermal therapy of cancer. ACS Nano 2012; 6: 5605–13. doi: 10.1021/nn301539m [DOI] [PubMed] [Google Scholar]
- 19.Marra M, Salzano G, Leonetti C, Porru M, Franco R, Zappavigna S, et al. New self-assembly nanoparticles and stealth liposomes for the delivery of zoledronic acid: a comparative study. Biotechnol Adv 2012; 30: 302–9. doi: 10.1016/j.biotechadv.2011.06.018 [DOI] [PubMed] [Google Scholar]
- 20.Karunamuni R, Maidment ADA. Search for novel contrast materials in dual-energy x-ray breast imaging using theoretical modeling of contrast-to-noise ratio. Phys Med Biol 2014; 59: 4311–24. [DOI] [PubMed] [Google Scholar]
- 21.Nabikhan A, Kandasamy K, Raj A, Alikunhi NM. Synthesis of antimicrobial silver nanoparticles by callus and leaf extracts from saltmarsh plant, Sesuvium portulacastrum L. Colloids Surf B Biointerfaces 2010; 79: 488–93. doi: 10.1016/j.colsurfb.2010.05.018 [DOI] [PubMed] [Google Scholar]
- 22.Vaidyanathan R, Gopalram S, Kalishwaralal K, Deepak V, Pandian SR, Gurunathan S. Enhanced silver nanoparticle synthesis by optimization of nitrate reductase activity. Colloids Surf B Biointerfaces 2010; 75: 335–41. doi: 10.1016/j.colsurfb.2009.09.006 [DOI] [PubMed] [Google Scholar]
- 23.Silvert P, Duvauchelle N, Vijayakrishnan V, Elhsissen KT. Preparation of colloidal silver dispersions by the polyol process. J Mater Chem 1996; 6: 573–7. [Google Scholar]
- 24.Wiley B, Herricks T, Sun Y, Xia Y. Polyol synthesis of silver nanoparticles: use of chloride and oxygen to promote the formation of single-crystal, truncated cubes and tetrahedrons. Nano Lett 2004; 4: 1733–9. [Google Scholar]
- 25.Liu J, Hurt RH. Ion release kinetics and particle persistence in aqueous nano-silver colloids. Environ Sci Technol 2010; 44: 2169–75. doi: 10.1021/es9035557 [DOI] [PubMed] [Google Scholar]
- 26.Verma VC, Kharwar RN, Gange AC. Biosynthesis of antimicrobial silver nanoparticles by the endophytic fungus Aspergillus clavatus. Nanomedicine (Lond) 2010; 5: 33–40. doi: 10.2217/nnm.09.77 [DOI] [PubMed] [Google Scholar]
- 27.Musarrat J, Dwivedi S, Singh BR, Al-Khedhairy AA, Azam A, Naqvi A. Production of antimicrobial silver nanoparticles in water extracts of the fungus Amylomyces rouxii strain KSU-09. Bioresour Technol 2010; 101: 8772–6. doi: 10.1016/j.biortech.2010.06.065 [DOI] [PubMed] [Google Scholar]
- 28.Mehra S, Christoforo MG, Peumans P, Salleo A. Solution processed zinc oxide nanopyramid/silver nanowire transparent network films with highly tunable light scattering properties. Nanoscale 2013; 5: 4400–3. [DOI] [PubMed] [Google Scholar]
- 29.Kahraman M, Sur I, Mustafa C. Label-free detection of proteins from self-assembled protein-silver nanoparticle structures using surface-enhanced Raman scattering. Anal Chem 2010; 82: 7596–602. doi: 10.1021/ac101720s [DOI] [PubMed] [Google Scholar]
- 30.Chen LQ, Xiao SJ, Peng L, Wu T, Ling J, Li YF, et al. Aptamer-based silver nanoparticles used for intracellular protein imaging and single nanoparticle spectral analysis. J Phys Chem B 2010; 114: 3655–9. doi: 10.1021/jp9104618 [DOI] [PubMed] [Google Scholar]
- 31.Kumar A, Vemula PK, Ajayan PM, John G. Silver-nanoparticle-embedded antimicrobial paints based on vegetable oil. Nat Mater 2008; 7: 236–41. doi: 10.1038/nmat2099 [DOI] [PubMed] [Google Scholar]
- 32.McFarland AD, Van Duyne RP. Single silver nanoparticles as real-time optical sensors with zeptomole sensitivity. Nano Lett 2003; 3: 1057–62. [Google Scholar]
- 33.Dance DR, Skinner CL, Young KC, Beckett JR, Kotre CJ. Additional factors for the estimation of mean glandular breast dose using the UK mammography dosimetry protocol. Phys Med Biol 2000; 45: 3225–40. [DOI] [PubMed] [Google Scholar]
- 34.Dance DR. Monte Carlo calculation of conversion factors for the estimation of mean glandular breast dose. Phys Med Biol 1990; 35: 1211–19. [DOI] [PubMed] [Google Scholar]
- 35.Boone JM, Fewell TR, Jennings RJ. Molybdenum, rhodium, and tungsten anode spectral models using interpolating polynomials with application to mammography. Med Phys 1997; 24: 1863–74. [DOI] [PubMed] [Google Scholar]
- 36.Marshall NW, Monnin P, Bosmans H, Bochud FO, Verdun FR. Image quality assessment in digital mammography: part I. Technical characterization of the systems. Phys Med Biol 2011; 56: 4201–20. [DOI] [PubMed] [Google Scholar]
- 37.Brettle DS, Cowen AR. Dual-energy digital mammography utilizing stimulated phosphor computed radiography. Phys Med Biol 1994; 39: 1989–2004. [DOI] [PubMed] [Google Scholar]
- 38.Bliznakova K, Kolitsi Z, Pallikarakis N. Dual-energy mammography: simulation studies. Phys Med Biol 2006; 51: 4497–515. doi: 10.1088/0031-9155/51/18/004 [DOI] [PubMed] [Google Scholar]
- 39.Karunamuni R, Zaki AA, Popov AV, Delikatny EJ, Gavenonis S, Tsourkas A, et al. An examination of silver as a radiographic contrast agent in dual-energy breast X-ray imaging. In: IWDM 12 Proceedings of the 11th International Conference on Breast Imaging. Berlin, Germany: Springer-Verlag. pp. 418–25. [Google Scholar]