Abstract
Purpose.
We compared hypoautofluorescent (hypoAF) areas detected with near-infrared (NIR-AF) and short-wavelength autofluorescence (SW-AF) in patients with recessive Stargardt disease (STGD1) to retinal structure using spectral domain optical coherence tomography (SD-OCT).
Methods.
The SD-OCT volume scans, and SW-AF and NIR-AF images were obtained from 15 eyes of 15 patients with STGD1 and registered to each other. Thickness maps of the total retina, receptor-plus layer (R+, from distal border of the RPE to outer plexiform/inner nuclear layer boundary), and outer segment-plus layer (OS+, from distal border of the RPE to ellipsoid zone [EZ] band) were created from SD-OCT scans. These were compared qualitatively and quantitatively to the hypoAF areas in SW-AF and NIR-AF images.
Results.
All eyes showed a hypoAF area in the central macula and loss of the EZ band in SD-OCT scans. The hypoAF area was larger in NIR than SW-AF images and it exceeded the area of EZ band loss for 12 eyes. The thickness maps showed progressive thinning towards the central macula, with the OS+ layer showing the most extensive and severe thinning. The central hypoAF areas on NIR corresponded to the OS+ thinned areas, while the hypoAF areas on SW-AF corresponded to the R+ thinned areas.
Conclusions.
Since the larger hypoAF area on NIR-AF exceeded the region of EZ band loss, and corresponded to the OS+ thinned area, RPE cell loss occurred before photoreceptor cell loss. The NIR-AF imaging may be an effective tool for following progression and predicting loss of photoreceptors in STGD1.
Keywords: fundus autofluorescence, recessive Stargardt disease, ABCA4, optical coherence tomography, retinal pigment epithelium
Quantitative methods were used to compare hypoautofluorescent areas detected with near-infrared and short-wavelength autofluorescence to retinal thickness maps created from SD-OCT volume scans in Stargardt patients. Results were consistent with RPE cell loss occurring before photoreceptor cell loss.
Recessive Stargardt disease (STGD1) is a form of juvenile macular degeneration caused by mutations in the ABCA4 gene.1 It is characterized by symptoms of progressive loss of central vision that typically occur in the first two decades of life.2–4
Several noninvasive imaging modalities are used for the diagnosis and monitoring of disease progression in STGD1. These include short-wavelength fundus autofluorescence (SW-AF), near infrared autofluorescence (NIR-AF), and spectral domain optical coherence tomography (SD-OCT). The signal for SW-AF (488 nm excitation) is derived primarily from lipofuscin of the retinal pigment epithelium (RPE), and in particular from its bisretinoid constituents,5,6 while NIR-AF (787 nm excitation), on the other hand, originates from melanin in the choroid and RPE.7 In patients with STGD1, SW- and NIR-AF imaging reveal areas of decreased autofluorescence or hypoautofluorescence (hypoAF), and areas of hyperautofluorescence (hyperAF) in the form of flecks and/or rings. However, there are differences in the extent and location of these areas of abnormal AF depending on whether SW- or NIR-AF is used. For example, the hypoAF area observed in the central macula of some patients is larger on NIR-AF than SW-AF.8,9 With SD-OCT it has been shown that the central hypoAF area is associated with loss of the ellipsoid zone (EZ) band and thinning or loss of the RPE;9–12 and in one study10 a high correlation between photoreceptor cell loss and the extent of SW-AF hypoAF was found.
The aims of this study are to gain further insight into the disease process of STGD1 by comparing the pattern and extent of disease-related changes on NIR-AF and SW-AF to the structural abnormalities of the underlying retinal layers seen on SD-OCT volume scans.
Methods
Subjects
Fifteen patients (15 eyes) with at least one (expected) disease-causing mutation in the ABCA4 gene, was included in the study. They ranged in age from 8 to 43 years (mean age, 23.7 ± 9.4 years). Demographic, selected clinical, and genetic data are presented in Table 1. All patients had a complete ophthalmic examination, including best-corrected visual acuity with subjective refraction, and the clinical diagnosis of STGD1 was confirmed by a retina specialist. Eyes were excluded from the study if there was evidence of significant ocular media opacities, refractive errors greater than ±6 diopter (D) sphere or ±2 D cylinder, elevated IOP > 21 mm Hg, and a history or diagnosis of any other significant ocular comorbidities. The eye with the better visual acuity was included in the study. Where visual acuities were equal in both eyes, the eye with the lower refractive error was chosen. The 15 eyes in the present study exhibited fundus changes that were confined to the central macula. Full-field scotopic and photopic electroretinograms (ERG) were obtained according to the International Society for Clinical Electrophysiology of Vision (ISCEV) standards.13
Table 1.
Selected Demographic, Clinical, and Genetic Characteristics of the Study Cohort
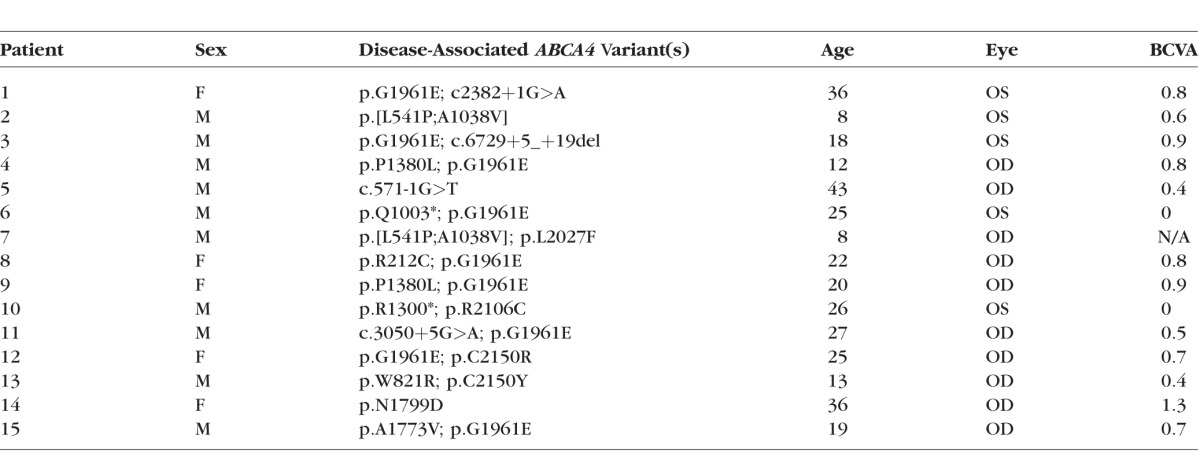
All patients except one (P2) were classified as group I based on full-field ERG results; that is, the patients had normal scotopic and photopic ERGs; P2 was classified as group II, the photopic ERG was decreased.14
Before participating in the study, patients were consented under internal review board (IRB) protocol #AAAI9906 approved by the Institutional Review Board at Columbia University. The study adhered to tenets set out in the Declaration of Helsinki.
Genetic Analyses
All patients were screened for ABCA4 variants by complete sequencing of all coding and intron/exon boundaries of the gene by either Sanger sequencing or by next-generation sequencing (NGS) as described previously,15 or with the Illumina TruSeq Custom Amplicon protocol (Illumina, San Diego, CA, USA), followed by sequencing on Illumina MiSeq platform. The next-generation sequencing reads were analyzed and compared to the reference genome GRCh37/hg19, using the variant discovery software NextGENe (SoftGenetics LLC, State College, PA, USA). All detected possibly disease-associated variants were confirmed by Sanger sequencing and analyzed with Alamut software (available in the public domain at http://www.interactive-biosoftware.com). Segregation of the variants with the disease was analyzed if family members were available. The allele frequencies of all variants were compared to the Exome Variant Server (EVS) dataset, NHLBI Exome Sequencing Project, Seattle, WA, USA (available in the public domain at http://snp.gs.washington.edu/EVS/; accessed March 2014).
Genetic data are presented in Table 1; at least one disease-associated variant in the ABCA4 gene was detected in all patients and two variants, resulting in an unequivocal genetic diagnosis of STGD1, were detected in 12/15 patients.
Imaging
Following pupil dilation, SW-AF (488 nm excitation) images were acquired with the Spectralis HRA+OCT (Heidelberg Engineering, Heidelberg, Germany) after a 20-second bleach of the photopigments in AF mode.16 In addition, a 9-mm horizontal line scan through the fovea and a 6-mm volume scan were obtained with the Spectralis. The SD-OCT scans were automatically registered to a simultaneously acquired near-infrared reflectance (NIR-R) fundus image. The NIR-AF (787 nm excitation) images were acquired with the Heidelberg Retina Angiograph 2 scanning laser ophthalmoscope (HRA2-cSLO, Heidelberg Engineering) using the indocyanine-green angiography mode (without injection of dye) after focus adjustment in infrared reflectance mode. To obtain the lowest signal-to-noise ratio for AF and OCT images, the eye tracking feature was used to average scans in both SLO instruments. For SW-AF nonnormalized images were acquired, whereas for NIR-AF normalized and nonnormalized images were acquired. All images of the same field were aligned to the NIR-R image of the SD-OCT volume scan using i2k Retina software (DualAlign LLC, Clifton Park, NY, USA) and Photoshop CS5 (Adobe, San Jose, CA, USA).
Image Analysis
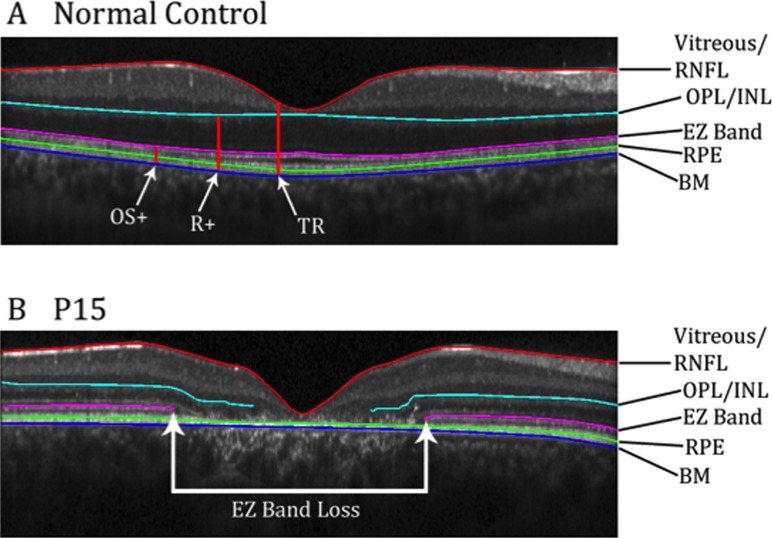
The AF images and corresponding SD-OCT scans were analyzed by two independent observers (ADS, WL). For each SD-OCT scan, the outer edges of the central EZ band (aka inner segment ellipsoid [ISe] or inner segment/outer segment border [IS/OS]) loss were marked on the corresponding NIR-R fundus image using the measuring tool of the Heidelberg Eye Explorer software (Heyex, Version 1.7.0.0; Heidelberg Engineering). The location of EZ band loss was defined as the point where the hyper-reflective EZ band was no longer visible, moving from the periphery of the scan towards the midline (Fig. 1B). The locations also were marked in the manually-corrected automated program used to create the thickness maps described below.
Figure 1.
(A) Horizontal SD-OCT b-scan of a healthy subject through the fovea. Red, cyan, pink, and blue lines represent borders that have been segmented. Red vertical lines show the thicknesses that were mapped. (B) Horizontal SD-OCT scan of P15 through the fovea. Red, cyan, pink, and blue lines were segmented. White arrows show the region of EZ band loss.
The SD-OCT scans for the 15 eyes of the patients and for 16 eyes of 16 age-similar control subjects also acquired with the Spectralis were segmented in MATLAB (Mathworks, Natick, MA, USA) using a manually corrected automated program.17 The following boundaries were marked (Fig. 1): the vitreous/retinal nerve fiber layer (vitreous/RNFL), outer plexiform/inner nuclear layer (OPL/INL), proximal border of the EZ band, proximal border of the RPE, and border between Bruch's membrane and the choroid (BM/choroid). These boundaries were grouped into three layers and thickness measurements were derived: outer segment-plus (OS+) layer, from the BM/choroid border to the proximal border of EZ aka IS/OS junction; receptor-plus (R+) layer, from the BM/choroid border to the OPL/INL boundary; and total retina (TR), from BM/choroid to the vitreous/RNFL boundary (Fig. 1A). Thickness maps of these layers were created in MATLAB. The thicknesses for controls and patients were normalized against the average thickness of the respective control layer at each point. The thickness maps then were overlaid onto the SW-AF and NIR-AF images using Adobe Photoshop CS5.
The area of hypoAF was measured in mm2 on the NIR-AF and SW-AF images using ImageJ64 (National Institutes of Health [NIH], Bethesda, MD, USA; available in the public domain at imagej.nih.gov/ij/). To assess the relationship of hypoAF to the underlying structure on SD-OCT, the area of thinning (defined as an area with thickness less than 50% of normal) for each layer mentioned above was traced in ImageJ64 as well. To scale the images it was assumed that the horizontal extent of a 30° image equals 9 mm.
Bland-Altman plots were generated (GraphPad Prism 5; GraphPad Software, La Jolla, CA, USA) to assess the agreement between SW-AF and NIR-AF measurements of hypoAF. Statistical significance of the differences was tested with a paired-samples test in SPSS Statistics 20.0 for Mac (SPSS IBM, Chicago, IL, USA). In addition, interclass correlation coefficients (ICC) were calculated in SPSS to assess statistical agreement between the two observers.
Results
Near-Infrared and Short-Wave Autofluorescence
The NIR and SW-AF images obtained from a healthy subject are shown in Figure 2. The distribution of signals follows a characteristic pattern. The NIR-AF signal in the central macula is high (i.e., hyperAF) due to increased optical density of melanin in an area approximately 8° in diameter.7 On the other hand, the SW-AF signal in this region, especially in the foveal area, is low (i.e., hypoAF) due to absorption of the excitation light by macular pigment.18 Outside the central macula, the NIR-AF and SW-AF signals are relatively uniform, although large choroidal vessels can be visible on NIR-AF in some subjects.7
Figure 2.
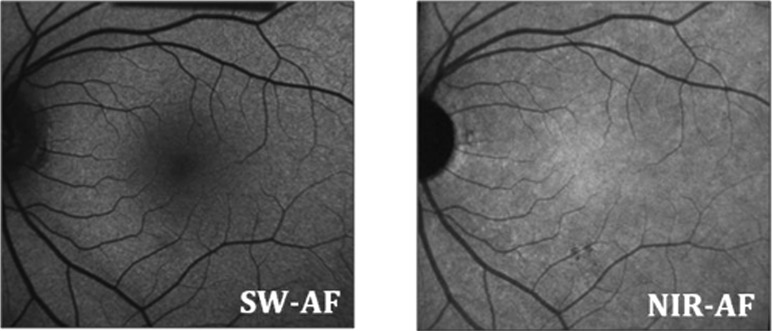
The SW-AF and NIR-AF images from a normal subject, showing hypoAF in the central macula on SW-AF and hyperAF in the central macula on NIR-AF.
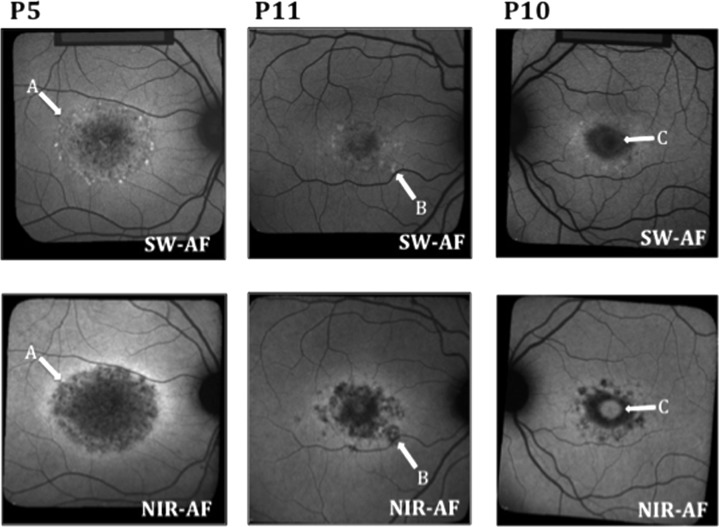
The NIR- and SW-AF images obtained from all 15 patients showed a central hypoAF area that appeared to be larger on NIR- than SW-AF. In 11 of the 15 eyes, this central area was surrounded by a hyperAF border on NIR-AF. In 9 of the 11, this ring also appeared on SW-AF, although the NIR-AF hyperAF appeared more intense (Fig. 3 left, A). One patient (P2) had a hyperAF ring on SW-AF that was not apparent on NIR-AF. Three patients did not have rings on NIR-AF or SW-AF. Nine of the 15 patients had hyperAF flecks on SW-AF that were hypoAF on NIR-AF (Fig. 3 center, B). Two of the 15 cases exhibited evidence of foveal sparing, which was more apparent on NIR-AF than SW-AF (Fig. 3 right, C).
Figure 3.
Examples of SW-AF and NIR-AF images from 3 patients. (A) A more intense hyperAF ring on NIR-AF than on SW-AF in P5. (B) A fleck that is hyperAF on SW-AF and hypoAF on NIR-AF in P11. (C) Foveal sparing, which is more apparent on NIR-AF than SW-AF in P10.
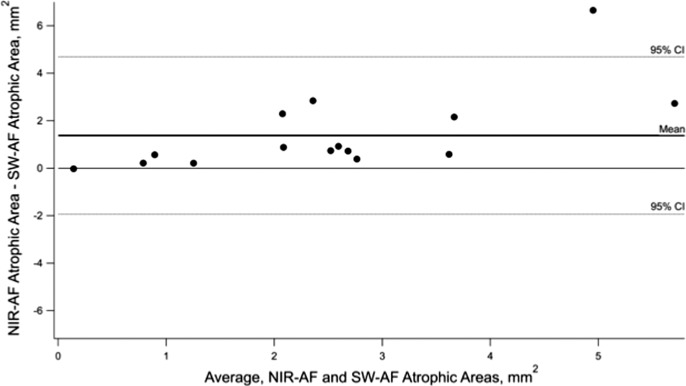
There was a significant difference between the total area of the central hypoAF measured on SW-AF and NIR-AF (P < .05). The Bland-Altman plot in Figure 4 illustrates the differences in these measurements for the 15 eyes. The NIR-AF defects were larger than SW-AF in all but one case. Average ICCs revealed excellent agreement between the two observers for SW-AF and NIR-AF measurements (SW-AF 0.98, NIR-AF 0.96).
Figure 4.
Bland-Altman plot showing differences in the size of the NIR- hypoAF and SW- hypoAF areas in the central macula. The dashed horizontal lines represent 95% CIs and the bold solid line represents the mean.
SD-OCT and Thickness Maps
The SD-OCT images from a healthy subject show a central foveal depression with several hyperreflective bands in the outer retina, including the external limiting membrane, EZ band, and RPE (Fig. 1A). The bands were uninterrupted throughout all scans, except for shadows from vessels in some images.
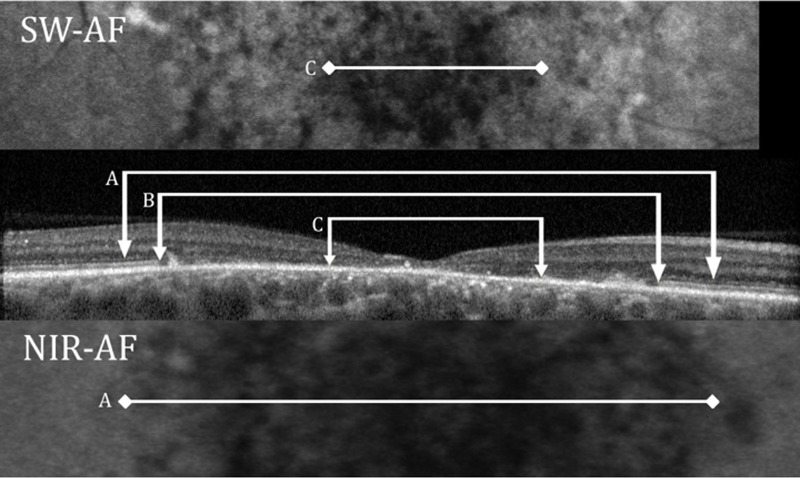
All patients showed loss of the EZ band in the central macula. Figure 5 shows an example for P14 of EZ band loss on the SD-OCT horizontal scan through the fovea. The extent of the loss is compared to the horizontal extent of the SW hypoAF defect C, in the upper panel, and to the horizontal extent of the NIR hypoAF defect A, in the lower panel. For all 15 eyes, the locations of EZ band loss were marked and overlaid onto the SW-AF and NIR-AF images. This is illustrated in Figure 6 for P5. For all 15 eyes, the boundary of EZ band loss more closely approximated the hypoAF boundary on NIR than on SW-AF; the extent of hypoAF on SW-AF consistently underestimated the extent of EZ band loss. In addition, for the majority of eyes (n = 12) the central hypoAF area on NIR-AF was larger than the area of EZ band loss.
Figure 5.
The SW-AF image for P14 is shown (upper), the SD-OCT horizontal scan through the fovea (center) panel, and the NIR-AF image (lower). (A) Horizontal extent of the NIR hypoAF defect. (B) Extent of EZ band loss. (C) Extent of the SW hypoAF defect.
Figure 6.
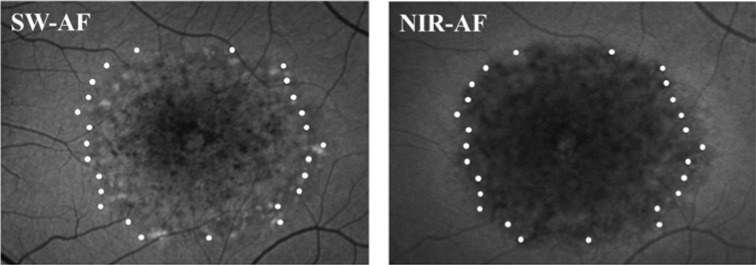
The locations of the edges of the EZ band, represented by the white dots, overlaid onto the SW-AF and NIR-AF images for P5.
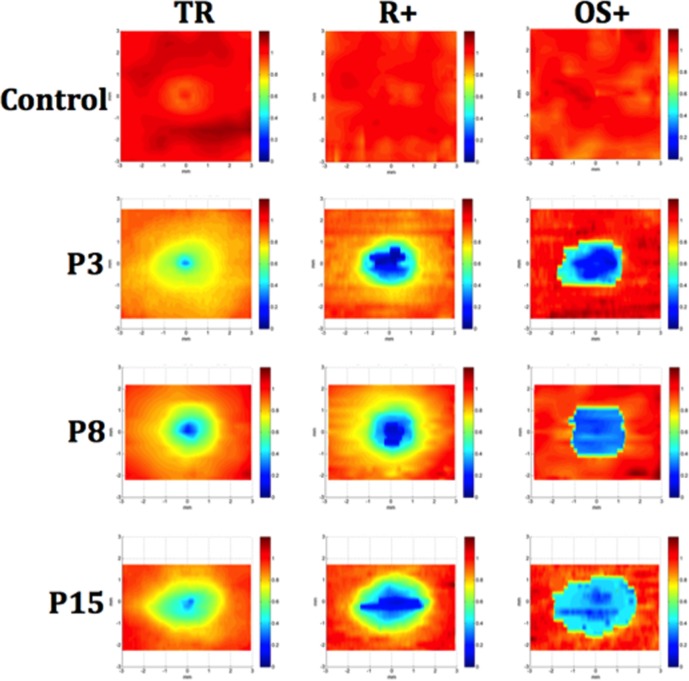
Figure 7 shows the normalized TR, R+, and OS+ thickness maps for a control eye and 3 representative patient eyes (P3, P8, P15). For the patients, progressive thinning from the periphery toward the center can be seen for all three layers, with the OS+ layer showing the most extensive and severe thinning in the central area, followed by the R+ layer, and then the TR. Thinning, indicated by yellow and orange-yellow shading, in areas outside the central area also can be seen on the TR and R+ maps.
Figure 7.
Normalized thickness maps for SD-OCT volume scans from a control and 3 representative patients (P3, P8, and P15) for TR, R+, and OS+ layers. The maps show normalized thickness, where dark blue is 0% of normal and dark red is 120% of normal. Thinning progressing from the periphery toward the center can be seen for all three layer measurements, with the most severe central thinning seen in the OS+ map.
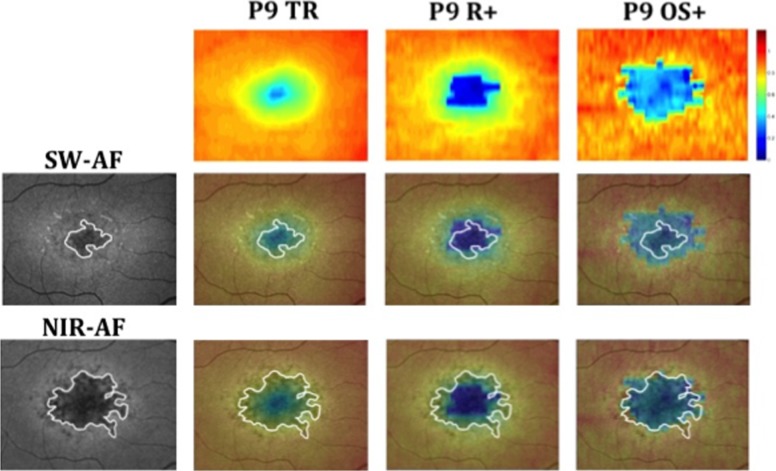
To compare the extent of this central thinned area on the thickness maps to the regions of hypoAF on SW-AF and NIR-AF, the OS+ and R+ maps were overlaid onto SW-AF and NIR-AF images. An example is shown in Figure 8 for P9. Qualitatively, the SW-AF hypoAF areas (white line, second row) appeared to correspond roughly to the thinned R+ areas, while the NIR-AF hypoAF areas (white line, third row) corresponded to the thinned areas on the OS+ maps. The area of flecks around the central atrophic area corresponded qualitatively with less severe areas of OS+ and R+ thinning.
Figure 8.
Thickness maps of P9 overlaid on SW-AF and NIR-AF images. The white outline represents the measured hypoAF area on SW-AF and NIR-AF. The scale on the right shows relative thickness compared to normals, where dark red is above normal thickness and dark blue is 0% of normal thickness.
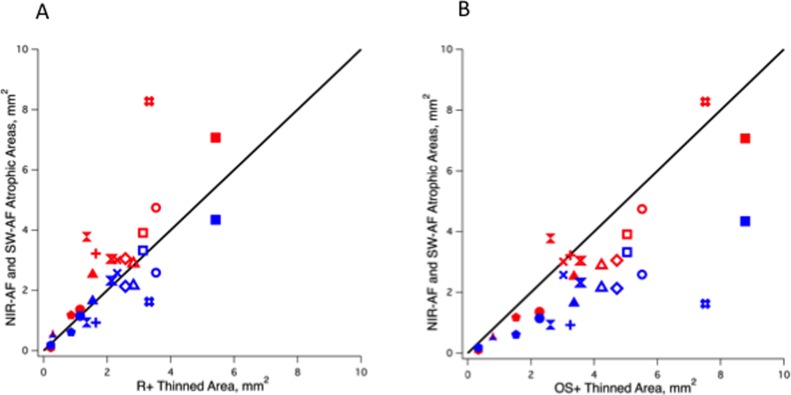
Figures 9A and 9B show the results of quantitative comparisons between the central NIR (red symbols) and SW hypoAF (blue symbols) areas, and the central thinned R+ (Fig. 9A) and OS+ (Fig. 9B) areas for the 15 eyes. In Figure 9A, the SW hypoAF values for 12 of the 15 eyes are closer to the diagonal line (slope = 1.0) representing the line of equality than the NIR hypoAF values, whereas in Figure 9B the NIR hypoAF values for 12 of the 15 eyes are closer to the line of equality. The results support the observations that the SW-AF hypoAF areas correspond more closely to the R+ thinned areas, while the NIR-AF hypoAF areas correspond to the OS+ areas. Average ICCs revealed good agreement between the two observers (ADS, WL) for the OS+ and R+ area measurements (OS+ 0.93, R+ 0.72).
Figure 9.
Comparison between the areas of central hypoAF on NIR-AF (red symbols) and SW-AF (blue symbols) and the thinned areas for the R+ (A) and OS+ (B) layers for all 15 eyes. The diagonal line represents equality.
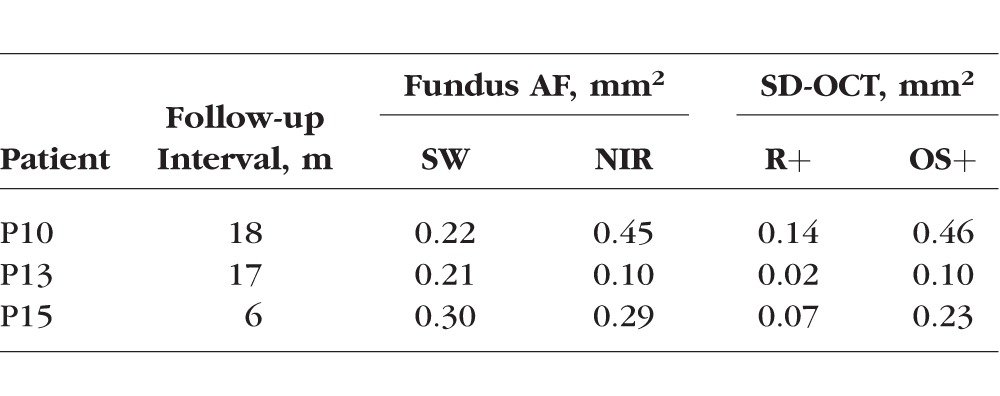
Follow-up data were obtained on 3 of the 15 patients (P10, P13, and P15) at 18, 17, and 6 months, respectively. All 3 patients showed increases in the central hypoAF area on SW and NIR-AF and in the thinned areas on the R+ and OS+ thickness maps (see Table 2 for details).
Table 2.
Summary of Follow-up Data
Discussion
In agreement with previous reports, the central macula showed an area of reduced AF in NIR- and SW-AF images.8,9,19–21 Even though both AF signals are believed to originate in the RPE,22 the central area of reduced AF was larger on NIR- than SW-AF. This quantitative finding supports previous qualitative reports that a greater area of abnormality was detected on NIR-AF than SW-AF in patients with STGD1,8,19 and it also is consistent with a recent report by Duncker et al.9 In addition to the observation of reduced AF in the central macula in NIR- and SW-AF images, these hypoAF areas were surrounded by a hyperAF border. The colocalization of increased NIR-AF with increased SW-AF at the border of atrophy may reflect stacking of RPE cells that have lost contact with Bruch's membrane.23 However, the presence of a SW-AF ring in the absence of a corresponding ring in the NIR-AF image for one of the patients (P2) warrants an alternative explanation. In this case the SW-AF signal is amplified even further than the elevated levels expected for the STGD1 fundus.24 Because this zone of elevated SW-AF includes the area of EZ loss in SD-OCT scans, it is possible that the accelerated bisretinoid production is attributable to disabled and degenerating photoreceptor cells, as also may be the case under other conditions.25
Further insight into the discrepant findings between the two modes of AF imaging can be gained by comparing the hypoAF areas to the underlying structure seen on SD-OCT. When we compared the spatial extent of these areas in NIR- and SW-AF images to the central thinned areas on the OS+ and R+ thickness maps, we found that the hypoAF areas in NIR images corresponded more closely to the OS+ thinned areas, while those in SW-AF images corresponded more closely to the R+ thinned areas (Fig. 9). We also observed that the thickness of the OS+ layer outside the central atrophic area defined by reduced NIR-AF was similar or only slightly thinned compared to that of controls. However, for the R+ layer, whose boundaries include the ONL, thinning outside the central atrophic area became apparent (Figs. 7, 8). Thus the SW-AF signal can be present in the absence of NIR-AF and it can be observed in regions of photoreceptor damage (i.e., in the presence of ONL thinning).
In summary, for NIR-AF, the central hypoAF area was not only larger, more closely related to the thinned area on the OS+ map and to the boundary of EZ band loss (see example in Fig. 6), but it also exceeded the area of EZ band loss in the majority of eyes. These findings have implications regarding the sequence of changes that occur with progression of STGD1. Specifically, given that EZ band loss is correlated with photoreceptor loss10,12 and that the melanin-associated NIR-AF signal is thought to originate in the RPE,22 these observations indicated that RPE cell loss and/or dysfunction occurs before photoreceptor cell loss in STGD1. This view is in agreement with the sequence or stages of ABCA4-associated retinal degeneration proposed by Cideciyan et al.26 The preliminary follow-up data we obtained on 3 of the 15 patients, although very limited, provided some additional support. The central area of decreased NIR-AF and the central thinned area on the OS+ map increased over time. For all 3 patients, the NIR-AF area was larger than the OS+ area at the initial and at the follow-up visit. These findings suggested that changes in the hypoAF area on NIR may precede changes in the EZ band.
It is commonly assumed that RPE cells are the only source of SW fundus AF. Accordingly, the incongruity between NIR-AF and SW-AF based indicators of atrophy has been a conundrum. Similarly, the mismatch between the region of absent SW-AF and EZ band loss in SD-OCT images, has led investigators to question whether RPE atrophy precedes or follows photoreceptor cell loss in STGD1 and AMD.27 In a recent study by Ritter et al.28 that compared structural changes observed with polarization-sensitive OCT to those visible on SW-AF, it was suggested that in the mildest cases of STGD1, the results were consistent with changes in the photoreceptor layer occurring simultaneously with the development of abnormalities in the RPE layer. Nevertheless, a contribution to SW-AF from degenerating photoreceptor cells in the advancing front of atrophy could explain why the size of the area of hypoautofluorescence (atrophy) can be underestimated in SW-AF compared to NIR-AF images29 and why the diameter of the area of absent SW-AF inadequately reflects the spatial extent of photoreceptor cell abnormalities visualized in SD-OCT images. Given these considerations, NIR-AF may be an effective tool for following disease progression and for predicting loss of photoreceptors in STGD1. The NIR-AF imaging technique also has the added advantage of being better tolerated by children and photophobic patients.
Acknowledgments
The authors thank Ali Raza, PhD, for his help in creating the thickness maps, and Stephen Tsang, MD, PhD, for clinical evaluation of the patients.
Supported in part by Grants EY009076, EY024091, EY021163, EY019861, and EY019007 from the National Eye Institute/NIH (Core Support for Vision Research: Foundation Fighting Blindness, and an unrestricted grant from Research to Prevent Blindness to the Department of Ophthalmology, Columbia University. The authors alone are responsible for the content and writing of the paper.
Disclosure: V.C. Greenstein, None; A.D. Schuman, None; W. Lee, None; T. Duncker, None; J. Zernant, None; R. Allikmets, None; D.C. Hood, None; J.R. Sparrow, None
References
- 1. Allikmets R,, Singh N,, Sun H,, et al. A photoreceptor cell-specific ATP-binding transporter gene (ABCR) is mutated in recessive Stargardt macular dystrophy. Nat Genet. 1997; 15: 236–246. [DOI] [PubMed] [Google Scholar]
- 2. Rotenstreich Y,, Fishman GA,, Anderson RJ. Visual acuity loss and clinical observations in a large series of patients with Stargardt disease. Ophthalmology. 2003; 110: 1151–1158. [DOI] [PubMed] [Google Scholar]
- 3. Armstrong JD,, Meyer D,, Xu S,, Elfervig JL. Long-term follow-up of Stargardt's disease and fundus flavimaculatus. Ophthalmology. 1998; 105: 448–457. [DOI] [PubMed] [Google Scholar]
- 4. Fishman GA,, Farber M,, Patel BS,, Derlacki DJ. Visual acuity loss in patients with Stargardt's macular dystrophy. Ophthalmology. 1987; 94: 809–814. [DOI] [PubMed] [Google Scholar]
- 5. von Rückmann A,, Fitzke FW,, Bird AC. In vivo fundus autofluorescence in macular dystrophies. Arch Ophthalmol. 1997; 115: 609–615. [DOI] [PubMed] [Google Scholar]
- 6. Lois N,, Halfyard AS,, Bird AC,, Holder GE,, Fitzke FW. Fundus autofluorescence in Stargardt macular dystrophy-fundus flavimaculatus. Am J Ophthalmol. 2004; 138: 55–63. [DOI] [PubMed] [Google Scholar]
- 7. Keilhauer CN,, Delori FC. Near-infrared autofluorescence imaging of the fundus: visualization of ocular melanin. Invest Ophthalmol Vis Sci. 2006; 47: 3556–3564. [DOI] [PubMed] [Google Scholar]
- 8. Kellner S,, Kellner U,, Weber BH,, Fiebig B,, Weinitz S,, Ruether K. Lipofuscin- and melanin-related fundus autofluorescence in patients with ABCA4-associated retinal dystrophies. Am J Ophthalmol. 2009; 147: 895–902. [DOI] [PubMed] [Google Scholar]
- 9. Duncker T,, Marsiglia M,, Lee W, et al. Correlations among near-infrared and short-wavelength autofluorescence and spectral domain optical coherence tomography in recessive Stargardt disease. Invest Ophthalmol Vis Sci. 2014; 55: 8134–8143. [DOI] [PMC free article] [PubMed] [Google Scholar]
- 10. Ergun E,, Hermann B,, Wirtitsch M,, et al. Assessment of central visual function in Stargardt's disease/fundus flavimaculatus with ultrahigh-resolution optical coherence tomography. Invest Ophthalmol Vis Sci. 2005; 46: 310–316. [DOI] [PubMed] [Google Scholar]
- 11. Srinivasan VJ,, Wojtkowski M,, Witkin AJ, et al. High-definition and 3-dimensional imaging of macular pathologies with high-speed ultrahigh-resolution optical coherence tomography. Ophthalmology. 2006; 113: 2054.e1–14e. [DOI] [PMC free article] [PubMed] [Google Scholar]
- 12. Burke TR,, Rhee DW,, Smith RT,, et al. Quantification of peripapillary sparing and macular involvement in Stargardt disease (STGD1). Invest Ophthalmol Vis Sci. 2011; 52: 8006–8015. [DOI] [PMC free article] [PubMed] [Google Scholar]
- 13. Marmor MF,, Fulton AB,, Holder GE, et al. ISCEV Standard for full-field clinical electroretinography (2008 update). Doc Ophthalmol. 2009; 118: 69–77. [DOI] [PubMed] [Google Scholar]
- 14. Lois N,, Holder GE,, Bunce C,, Fitzke FW,, Bird AC. Phenotypic subtypes of Stargardt macular dystrophy-fundus flavimaculatus. Arch Ophthalmol. 2001; 119: 359–369. [DOI] [PubMed] [Google Scholar]
- 15. Zernant J,, Schubert C,, Im KM, et al. Analysis of the ABCA4 gene by next-generation sequencing. Invest Ophthalmol Vis Sci. 2011; 52: 8479–8487. [DOI] [PMC free article] [PubMed] [Google Scholar]
- 16. Delori F,, Greenberg JP,, Woods RL,, et al. Quantitative measurements of autofluorescence with the scanning laser ophthalmoscope. Invest Ophthalmol Vis Sci. 2011; 52: 9379–9390. [DOI] [PMC free article] [PubMed] [Google Scholar]
- 17. Yang Q,, Reisman CA,, Chan K,, Ramachandran R,, Raza A,, Hood DC. Automated segmentation of outer retinal layers in macular OCT images of patients with retinitis pigmentosa. Biomed Opt Express. 2011; 2: 2493–2503. [DOI] [PMC free article] [PubMed] [Google Scholar]
- 18. Delori FC,, Staurenghi G,, Arend O,, Dorey CK,, Goger DG,, Weiter JJ. In vivo measurement of lipofuscin in Stargardt's disease--Fundus flavimaculatus. Invest Ophthalmol Vis Sci. 1995; 36: 2327–2331. [PubMed] [Google Scholar]
- 19. Chun R,, Fishman GA,, Collison FT,, Stone EM,, Zernant J,, Allikmets R. The value of retinal imaging with infrared scanning laser ophthalmoscopy in patients with stargardt disease. Retina. 2014; 34: 1391–1399. [DOI] [PMC free article] [PubMed] [Google Scholar]
- 20. Schmitz-Valckenberg S,, Lara D,, Nizari S, et al. Localisation and significance of in vivo near-infrared autofluorescent signal in retinal imaging. Br J Ophthalmol. 2011; 95: 1134–1139. [DOI] [PubMed] [Google Scholar]
- 21. Cukras CA,, Wong WT,, Caruso R,, Cunningham D,, Zein W,, Sieving PA. Centrifugal expansion of fundus autofluorescence patterns in Stargardt disease over time. Arch Ophthalmol. 2012; 130: 171–179. [DOI] [PMC free article] [PubMed] [Google Scholar]
- 22. Gibbs D,, Cideciyan AV,, Jacobson SG,, Williams DS. Retinal pigment epithelium defects in humans and mice with mutations in MYO7A: imaging melanosome-specific autofluorescence. Invest Ophthalmol Vis Sci. 2009; 50: 4386–4393. [DOI] [PMC free article] [PubMed] [Google Scholar]
- 23. Rudolf M,, Vogt SD,, Curcio CA, et al. Histologic basis of variations in retinal pigment epithelium autofluorescence in eyes with geographic atrophy. Ophthalmology. 2013; 120: 821–828. [DOI] [PMC free article] [PubMed] [Google Scholar]
- 24. Burke TR,, Duncker T,, Woods RL,, et al. Quantitative fundus autofluorescence in recessive Stargardt disease. Invest Ophthalmol Vis Sci. 2014; 55: 2841–2852. [DOI] [PMC free article] [PubMed] [Google Scholar]
- 25. Gelman R,, Chen R,, Blonska A,, Barile G,, Sparrow JR. Fundus autofluorescence imaging in a patient with rapidly developing scotoma. Retin Cases Brief Reps. 2012; 6: 345–348. [DOI] [PMC free article] [PubMed] [Google Scholar]
- 26. Cideciyan AV,, Aleman TS,, Swider M, et al. Mutations in ABCA4 result in accumulation of lipofuscin before slowing of the retinoid cycle: a reappraisal of the human disease sequence. Hum Mol Genet. 2004; 13: 525–534. [DOI] [PubMed] [Google Scholar]
- 27. Gomes NL,, Greenstein VC,, Carlson JN,, et al. A comparison of fundus autofluorescence and retinal structure in patients with Stargardt disease. Invest Ophthalmol Vis Sci. 2009; 50: 3953–3959. [DOI] [PMC free article] [PubMed] [Google Scholar]
- 28. Ritter M,, Zotter S,, Schmidt WM,, Bittner RE,, Deak GG, et al. Characterization of stargardt disease using polarization-sensitive optical coherence tomography and fundus autofluorescence imaging. Invest Ophthalmol Vis Sci. 2013; 54: 6416–6425. [DOI] [PubMed] [Google Scholar]
- 29. Sayegh RG,, Simader C,, Scheschy U,, et al. A systematic comparison of spectral-domain optical coherence tomography and fundus autofluorescence in patients with geographic atrophy. Ophthalmology. 2011; 118: 1844–1851. [DOI] [PubMed] [Google Scholar]


