

ABSTRACT
Grapevine is a well-studied, economically relevant crop, whose associated bacteria could influence its organoleptic properties. In this study, the spatial and temporal dynamics of the bacterial communities associated with grapevine organs (leaves, flowers, grapes, and roots) and soils were characterized over two growing seasons to determine the influence of vine cultivar, edaphic parameters, vine developmental stage (dormancy, flowering, preharvest), and vineyard. Belowground bacterial communities differed significantly from those aboveground, and yet the communities associated with leaves, flowers, and grapes shared a greater proportion of taxa with soil communities than with each other, suggesting that soil may serve as a bacterial reservoir. A subset of soil microorganisms, including root colonizers significantly enriched in plant growth-promoting bacteria and related functional genes, were selected by the grapevine. In addition to plant selective pressure, the structure of soil and root microbiota was significantly influenced by soil pH and C:N ratio, and changes in leaf- and grape-associated microbiota were correlated with soil carbon and showed interannual variation even at small spatial scales. Diazotrophic bacteria, e.g., Rhizobiaceae and Bradyrhizobium spp., were significantly more abundant in soil samples and root samples of specific vineyards. Vine-associated microbial assemblages were influenced by myriad factors that shape their composition and structure, but the majority of organ-associated taxa originated in the soil, and their distribution reflected the influence of highly localized biogeographic factors and vineyard management.
IMPORTANCE
Vine-associated bacterial communities may play specific roles in the productivity and disease resistance of their host plant. Also, the bacterial communities on grapes have the potential to influence the organoleptic properties of the wine, contributing to a regional terroir. Understanding that factors that influence these bacteria may provide insights into management practices to shape and craft individual wine properties. We show that soil serves as a key source of vine-associated bacteria and that edaphic factors and vineyard-specific properties can influence the native grapevine microbiome preharvest.
INTRODUCTION
Bacteria form complex and dynamic associations with plants that range from mutually beneficial to commensal or pathogenic (1, 2) and play key roles in soil quality, host productivity, and host health through direct or indirect mechanisms, such as mineralizing soil organic matter, activating plant defense mechanisms, and even producing antibiotics against phytopathogens (3–6). Plant-associated bacteria colonize both exterior surfaces (epiphytes) and interior surfaces (endophytes), and the soil surrounding plants is the most likely origin for many of these organisms. Plant soil-microbe interactions are complex, with both plant species and soil type being factors exerting their effect on soil microbial community and so playing key roles in soil pathogen suppression (7). Plants can be inoculated with growth-promoting bacteria that colonize via roots to confer pathogen resistance or improve productivity (8). However, when not inoculated, plant roots are known to influence rhizosphere microbial community composition through both root morphology and selective enrichment via root exudation (9). Building on previous work, Bulgarelli and colleagues (10) proposed a model of root selection for soil microbiota whereby the composition of the soil microbiome is defined by edaphic factors, followed by substrate-driven community selection within the rhizosphere, and finally by host genotype-dependent tuning of endophytic bacteria that colonize roots and, eventually, leaves and reproductive structures. In potatoes and poplars, the rhizosphere and the root microbial composition are cultivar specific and developmental stage dependent, while the microbiome of Arabidopsis spp. is mostly influenced by the edaphic and physical properties of soil (11–13). Aboveground epiphytic microbiota are mostly selected by nutrient-poor conditions and highly variable conditions of temperature, humidity, and UV radiation intensity (14, 15) of the plant environment, and yet some leaf epiphytes have plant species-specific associations that change little with geographic location (16). Elucidating the origin of bacteria that colonize crops and, hence, shape the disease resistance, productivity, and stress tolerance of their hosts may provide biological targets for future biotechnological application. However, model crop systems, such as grapevines, also provide an opportunity to unravel the complex influence of soil type, edaphic factors, climate, plant variety, and vineyard management practices on bacterial colonization and stability within the crop. Understanding these ecological principles is vital if we are to translate this knowledge into practical application.
Viticulturists rely on the assumption that the land from which grapes are grown imparts a unique quality to the wine, called the terroir. The physiological response of the vines to soil type, climatic conditions, and vineyard characteristics and management is believed to give rise to particular organoleptic properties of the wine defining its terroir. The existence and impact of region-specific microbiota in defining the terroir have been more controversial, as some studies have been inconclusive (17), while other studies found evidence for a biogeographic pattern (see, e.g., references 18 and 19). Microbial spatial pattern analyses have mainly been focused on studying the grape microbiota, but the relative importance of the microbiome of local soils in defining the terroir, which is also influenced by local climate and vineyard characteristics (20), is not known. The potential importance of bacteria and fungi associated with soils and growing plant organs has been characterized (21, 22), but to date, research has mostly focused on the fermentative stages whereby fungi (17) and bacteria may have a direct influence on the wine.
In the present study, we characterized the bacteria associated with Merlot grapevines using 16S rRNA amplicon sequencing and shotgun metagenomics to disentangle the influences of host cultivar, soil edaphic parameters, and grapevine developmental stage (dormancy, flowering, and preharvest) on the bacterial community composition, structure, and function from three grapevine parts (roots, leaves, and grapes or flowers) and associated soil (bulk soil and root zone soil). Specifically, we aimed to determine whether the soil was the main source of bacteria colonizing these grapevines and how edaphic factors, climate, and vineyard characteristics might influence the phylogeny and functional potential of this source.
RESULTS
A total of 62,109,490 16S rRNA V4 amplicon sequences were generated from 725 samples covering five sample types from each of five replicate plants in New York plus 5 grape samples from Bordeaux. Of these raw sequences, many were annotated as mitochondria or chloroplasts and were removed, leaving 44,582,970 sequences that clustered into 381,871 operational taxonomic units (OTUs; 97% nucleotide identity [ID]). A subset of 26 root samples and 22 bulk soil samples were randomly selected for shotgun metagenomic analysis. While similar quantities of sequences per sample were recovered for the two sample types, a higher number of sequences were annotated into functional categories in roots than in bulk soil samples (root average, 152,753; bulk soil average, 66,572). Bulk soil and root samples had significantly different functional gene structures and compositions (samples grouped according to sample type, bulk soil or root, in the first axis of the PCoA [PCo1] r2 = 0.626 and PCo2 r2 = 0.150) (see Fig. S1 in the supplemental material).
Most bacterial OTUs originate in soil, suggesting its potential as a source reservoir.
At an even sequencing depth of 1,000 sequences per sample (used for all analyses), 33% to 48% of belowground OTUs were shared among all belowground sample types (bulk soil, root zone soil, and roots). Meanwhile, the proportion of OTUs shared among aboveground sample types was lower (see Table S1A in the supplemental material), with only 6% to 9.8% of the OTUs present in grapes and leaves (which shared 24% and 33% of the OTUs with each other) also present in flower samples. However, 37% of the OTUs found in leaves and flowers and 42.1% of the OTUs found in grapes were also present in roots. The majority of plant organ-associated bacterial taxa appeared in the soil (Fig. 1; see also Text S1 and Table S1A), and some extremely rare (<0.001%) taxa in soil or root samples, including Pasteurellales, Staphylococcus, Gluconobacter, and Streptococcus spp., were more abundant above ground (0.08% and 1.30% in grape and leaf samples).
FIG 1 .

Bipartite network of OTU sharing between samples. Samples are represented as large circles with sample type designated by color, while OTUs are represented as black points. Edges connect sample nodes to OTU nodes detected in that sample and are also colored by sample type. To reduce the complexity of the network, only OTUs detected at least 50 times across all samples are included. Nodes are ordinated using an edge-weighted spring-embedded algorithm in which nodes repel each other and shared edges bring them closer together. Hence, nodes with a large degree of OTU overlap (unweighted by the number of observations of that OTU) form clusters. (The table of edges and nodes needed to reconstruct the OTU network is provided in www.bio.anl.gov/PRMT/Supplementary_dataset.xlsx.)
No OTUs were found in all the samples, but 3 OTUs (97% nucleotide ID) were detected in 75% of the samples. These “core” microbiota, comprising OTUs associated with Bradyrhizobium, Steroidobacter, and Acidobacteria spp., were more abundant below ground. Across vineyard, cultivar, year, and plant developmental stage, bulk soil samples had 17 OTUs in common, while root zone samples had 15 and roots had 10. In aboveground samples, only flowers maintained core OTUs across all samples, with 3 OTUs that belonged to the Pseudomonas viridiflava, and Erwinia genera. Every sample type also had unique OTUs (bulk soil = 19, root zone = 18, roots = 18, grapes = 30, flowers = 1, and leaves = 13), which all had low relative abundance (see Table S2) (for more detail on core microbial taxa, see Results in the supplemental material).
Microbial community structures were significantly different among plant organs and soil samples.
Aboveground samples (leaves, grapes, and flowers) were less diverse than belowground samples (bulk soil, root zone soil, and roots), and root samples were not as diverse as the samples from the surrounding soil (see Table S1B in the supplemental material). All aboveground samples were dominated by Proteobacteria (grapes, 80.7%; leaves, 90%; flowers, 98%) (Fig. 2A), which also dominated soil and root samples, although to a significantly lesser extent (32% and 57%, respectively). Communities associated with both grapes and leaves were composed of Firmicutes, Acidobacteria, and Bacteroidetes in low abundance. In flower samples, Pseudomonas spp. (61.8%) and Erwinia spp. (25.2%) were the dominant Proteobacteria taxa, while leaves and grapes contained species of Pseudomonas (leaves = 43%; grapes = 19%), Sphingomonas (leaves = 19%; grapes = 33%), and Methylobacterium, the latter of which was often the third-most-abundant genus. While soil and root samples were also dominated by Proteobacteria spp. (32% and 57%, respectively), they also contained Acidobacteria spp. (19% in soil; 10% in root), Bacteroidetes spp. (10% in soil; 13% in root), and Verrucomicrobia spp. (8% in soil; 5% in root), with a greater relative abundance of Planctomycetes spp. in soils (7%) and of Actinobacteria spp. in roots (5.1%; Fig. 2B), which were also enriched for Bacteroidetes spp. and Proteobacteria spp. (Fig. 2B), including Xanthomonadales (Steroidobacter), Cytophagaceae, Chitinophagaceae, Rhizobiales, and Actinomycetales spp. (Fig. 2B) (single analysis of variance [ANOVA], Bonferroni corrected, P value < 0.01). Steroidobacter spp. comprised 16.7% of the OTUs in roots (<1% in soils), and their relative abundances were remarkably stable between sample dates.
FIG 2 .
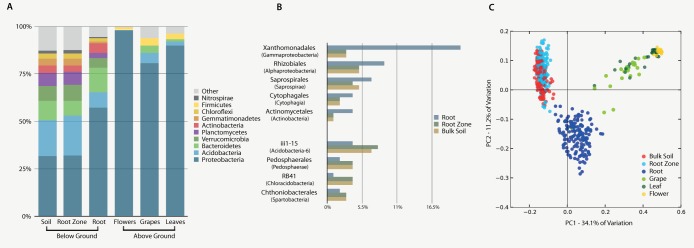
Aboveground and belowground samples showed differences in their bacterial community structures and compositions, while bulk soil and root communities differed in the abundances of particular taxa. (A) Microbial community composition in belowground and aboveground samples characterized to the phylum level (top 10 taxa). Data were rarified to 1,000 sequences per sample. (B) Single ANOVA representing bacteria that significantly differed in their relative abundances in comparisons of soils (bulk soil and root zone soil) and root samples after Bonferroni correction. Data were rarified to 5,100 sequences per sample, and only OTUs showing ≥1% relative abundance in all 3 sample types were used in the figures. (C) Principal coordinate analysis (PCoA) among plant parts and soil samples based on weighted UniFrac distances.
Sample type (bulk soil, root zone soil, root, flower, leaf, or grape) was found to be the major explanatory variable (45% explained) of microbial community structure (Fig. 2C) (PCo1 = 34% and PCo2 = 11%) and had the greatest permutational multivariate test statistic when constrained for the remaining experimental factors (R2 = 0.87, P = 0.001). A multivariate regression tree (MRT) that included all experimental factors (sample type, vineyard, cultivar, year, and plant developmental stage) and all edaphic factors (pH, moisture, soil temperature, total C and N, and C:N ratio) identified sample type as the most significant variable (see Fig. S2 in the supplemental material). However, as demonstrated previously (10, 13, 23), remarkable similarities among root zone soil and bulk soil microbial communities were found (Fig. 2C; see also Fig. S2); the variance explained by bulk soil versus root zone samples was smaller than the variance explained by year, pH, or vineyard (see Fig. S2). Permutational multivariate analysis of variance (PERMANOVA) showed that within soil samples, sample type (bulk or root zone) explained less variance when constraining the analyses by vineyard or year (R2 = 0.0137, P = 0.001) than was explained by vineyard when constraining the analysis by sample type (R2 = 0.515, P = 0.001).
Random Forests supervised learning models revealed that observed microbiota had a high discriminative power to distinguish samples as coming from either flowers or roots, suggesting that these two plant parts were the most distinct of the sample types. Compared to all other sample type combinations, flowers and roots had the lowest predictive error, with all samples correctly identified (class errors, 0 and 0.006, respectively; see Table S1C in the supplemental material). Belowground samples could be discriminated from aboveground samples by the changing relative abundances of Chthoniobacteraceae (DA101 genera), Betaproteobacteria (IS-44), and Pseudomonas viridiflava. Flowers had a greater relative abundance of P. viridiflava, a known pathogen of tomato, melon, chrysanthemum, eggplant (24), and A. thaliana (25), than either grapes or leaves.
Predicted functions of aboveground and belowground bacteria show organ-specific adaptations.
In order to compare aboveground and belowground functional potentials, functional content was predicted from amplicon data using PICRUSt (26). Aboveground samples showed lower nearest sequenced taxon index (NSTI) values (aboveground mean NSTI = 0.06 ± 0.035 and belowground mean NSTI = 0.20 ± 0.02), indicating that those sample types have better representation in the reference genome database used to generate the predictions, and thus better accuracy than belowground samples. Bulk soil and root metagenomes were generated to validate these functional predictions. The empirical and predicted functional annotations of bulk soil and root samples were significantly correlated (Mantel R = 0.79 [P = 0.001] and R = 0.56 [P = 0.001], respectively), suggesting a meaningful ability to make functional predictions for all sample types.
Several predicted pathways were significantly enriched in the microbiota of aboveground organs (Bonferroni-corrected ANOVA, P value < 0.01), among them, genes associated with signal transduction, cellular processes and signaling, membrane transport, cell motility, amino acid metabolism, and xenobiotic biodegradation and metabolism. Genes involved in xenobiotic biodegradation and metabolism had the highest relative abundance in grapes, followed by leaves. Genes associated with nitrogen metabolic pathways were significantly more abundant in leaves and roots than in other sample types (P < 0.001).
When analyzing the functional abundance of genes from paired metagenomes of bulk soil and root samples from each of six plants, we found that several microbial functional categories, including iron acquisition and metabolism, dormancy and sporulation, motility and chemotaxis, potassium metabolism, stress response, sulfur metabolism, metabolism of aromatic compounds, and membrane transport, were significantly enriched in root samples (see Table S3 in the supplemental material). The genomic potential for siderophore production (aerobactin, enterobactin, and pyoverdine) was highly enriched in Merlot roots (P = 0.0002), suggesting potential plant recruitment of siderophore-producing bacteria. Only one functional category, spore DNA protection (subsystem level 2 of dormancy and sporulation), which can influence the survival of bacterial DNA when sporulated, likely during periods of reduced plant activity, was found exclusively in roots.
Within organs, edaphic factors were secondary drivers of community structure.
In aboveground samples, a weak but significant correlation was observed with year of collection for both grape and leaf microbiota (Fig. 3A and B), which may have been due to the warmer air temperatures in September 2011 (number of cooling degree days [CLDD] = 113 and highest extreme maximum temperature for the month [EMXT] = 84°F) than in September 2012 (CLDD = 81 and EMXT = 86°F). For grape samples, a number of taxa associated with year of collection were significantly different, including Agrobacterium, Sphingomonas, and Oxalobacteraceae spp., all of which were more abundant in 2011 (Fig. 3A). In leaf samples, Pseudomonadales and Oxalobacteraceae spp. were significantly more abundant in 2011, whereas Bacillaceae and Pseudomonas abundances were higher in 2012 (Fig. 3B). Changes in Pseudomonas abundance were particularly large, representing 32% of the community in 2012 and 9% in 2011. No effects of cultivar or vineyard were observed.
FIG 3 .
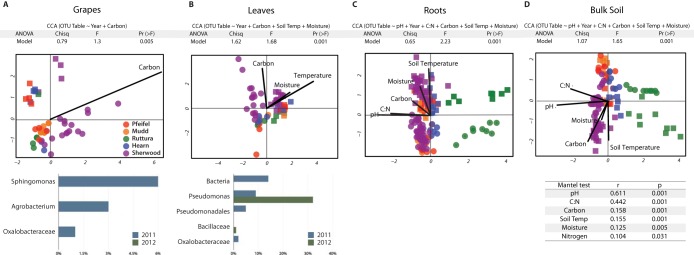
Canonical correspondence analysis (CCA) showing the correlations among soil edaphic factors and microbial communities from each sample type. ANOVA tables show the significance for the CCA model. CCA panels show samples colored by vineyard. Dots represent 2012 samples and triangles 2011 samples. The bar charts show taxa for which abundances were significantly different among leaves and grapes in comparisons of 2011 and 2012 samples (Bonferroni-corrected single ANOVA, P < 0.01). The Mantel test was used for calculations using data from bulk soil samples to study the edaphic factors correlating with the bacterial community. Chisq, chi-square test; F, F value; Pr, probability; Temp, temperature.
In belowground microbial communities, vineyard and year of collection were secondary drivers after plant organ. Variance in each of the three belowground sample types was significantly explained (ADONIS P < 0.001) by vineyard while constraining the analysis for the remaining experimental variables (R2 = 0.52 in bulk soil, R2 = 0.39 in root zone, and R2 = 0.26 in root samples). Many taxa were responsible for the microbial community differences among vineyards (see Table S4 and Results in the supplemental material); however, aboveground samples did not show such vineyard specificity. In addition, supervised learning classification could predict the vineyard of origin of soil and root samples (see Table S5).
PERMANOVA showed that the year of collection was the third most explanatory variable in bulk soil (R2 = 0.086, P = 0.001) and root zone (R2 = 0.122, P = 0.001) microbial communities when constrained by sample type and vineyard; although the year of collection was not significant for root samples (R2 = 0.062, P = 0.40), stepwise regression using forward selection of variables included the year of collection as an explanatory variable as part of the model best explaining the community dissimilarity in all belowground samples (Fig. 3C). All soil temperatures were significantly lower (t test, P < 0.01) in the 2012 sampling months (April and September) than in 2011 (June and September; see Table S6 in the supplemental material), which could explain the significant influence of the year of collection on the data from belowground communities.
Bacterial diversity was also influenced by edaphic factors, as shown by a BEST rank model which included pH, carbon, and moisture as the factors explaining the microbial beta-diversity patterns for bulk soil. This was confirmed by both a Mantel test and canonical correspondence analysis (CCA), which showed that, while all edaphic factors had some influence, pH and C:N ratio were the factors that most strongly correlated with microbial beta-diversity (Fig. 3D). pH and C:N ratio were also found to have the most significant correlations with changes in root microbial community structure (Fig. 3C). Total soil carbon also influenced the aboveground organ microbiota (grapes and leaves) (Fig. 3A and B). In addition, leaf microbial communities were affected by moisture and soil temperature.
Plant organ-specific signatures were preserved through early fermentation independently of environmental conditions.
The grape bacterial communities examined here (Suffolk, NY) were compared to bacterial communities from Merlot grapes from Bordeaux, France (collected following the same methods and processed and sequenced with this study’s samples), and to bacterial communities from freshly crushed Merlot grape must from California (19). Despite significant differences in location, DNA extraction procedure, sample type (whole grapes versus must), and potential inoculation sources (e.g., grapes in bulk transport are often damaged, attacked by flies, etc.), the California must bacterial community structure was more similar to Suffolk aboveground samples (grapes, flowers, and leaves) than to Suffolk belowground samples (bulk soil, root zone, and roots; Fig. 4A), which suggests that organ-specific signatures are preserved even during early fermentation.
FIG 4 .
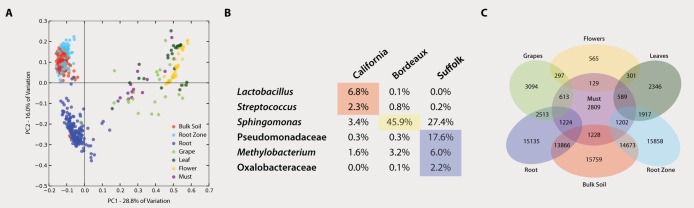
(A) Weighted UniFrac PCoA plot showing the dissimilarities among all sample types from Suffolk Merlot and including Californian must. The PCoA evidences a higher similarity of Californian must with Suffolk aboveground samples. (B) Taxa responsible for the differences among Suffolk grapes, Bordeaux grapes, and California must at the genus level (Bonferroni-corrected single ANOVA, P < 0.02). (C) Numbers of OTUs shared among the different sample types on Suffolk Merlot grapevine and Californian must. The numbers in the shaded overlapping zones indicate how many of the OTUs of the total number of OTUs (nonshaded-nonoverlapping number) were shared among sample types.
Comparing the microbiota of Suffolk grapes, Bordeaux grapes, and Californian must, several OTUs appeared in 80% of samples, demonstrating the existence of a “core” grape microbial phylogeny that is independent of growing region, climate, and sample collection method. Interestingly, in all comparisons involving Suffolk grapes (Suffolk vs Bordeaux grapes, and Suffolk vs Californian must) shared OTUs were phyllosphere or grape surface related, such as those corresponding to Methylobacterium, many sphingomonads, Pseudomonas, and soil-associated bacteria such as Microbacteriaceae (also found in botrytized wine ferments [27]). However, the OTUs found in 80% of samples in comparisons of Bordeaux grapes and Californian musts included a range of OTUs related to the malolactic fermentation process in wine, such as those in the Lactobacillales order (Lactococcus, Streptococcus and Leuconostaceae; Fig. 4B). Unexpectedly, in comparisons of the phylotypes shared among the different sample types, California must samples shared more taxa with Suffolk soil than with Suffolk grapes (~43% and 21%, respectively; Fig. 4C).
DISCUSSION
Plant parts maintain distinct microbial communities, with sample type explaining the greatest proportion of variation in microbial community structure of all factors. Overall, Merlot microbial diversity was greater in belowground (roots, root zone, and bulk soil) than aboveground (leaves, flowers, and grapes) samples, as described for other plant systems (28, 29). This decrease in diversity may be due to the extremes of temperature, UV exposure, and humidity experienced by epiphytes on aboveground organs (15, 16). Species of Pseudomonas and Sphingomonas taxa found in aboveground plant parts could influence plant health and productivity (30, 15), while Methylobacterium spp. found in leaves and grapes may stimulate plant development through phytohormone production (31). Sphingomonas and Methylobacterium spp. can survive the wine fermentation process (27), and yet their impacts on wine organoleptic properties remain unknown. Steroidobacter spp., which were found in higher abundance in roots than in soil, may play an essential role in plant development and physiology, as brassinosteroids have been shown to control seed germination, stem and root elongation, vascular differentiation, fruit ripening, leaf expansion, and stress protection in plants (32, 33). The enrichment of Actinobacteria, Bacteroidetes, and Proteobacteria spp. in roots (Fig. 2B) is likely driven by chemoattraction via photoassimilates secreted by root cells (10). The taxa enriched in root samples (Xanthomonadales, Rhizobiales, Bradyrhizobium, Saprospirales, Cytophagales, and Actinomycetales spp.) comprised 64% of the core OTUs (OTUs present in ≥95% of samples), which suggests that they outcompeted other bacteria for colonization of the roots or that the plant selects for these taxa or both. For example, the enrichment of roots in taxa belonging to the Rhizobiales order, such as Bradyrhizobium spp. (both part of the root core microbiota), may result in N fixation and antibiotic production (33) that would promote plant growth and disease suppression.
Microbial metabolic capabilities enriched in roots compared to soils included traits previously identified as favoring the movement or attraction of bacteria toward root exudates (10, 34) and genes encoding the metabolism of macro- and micronutrients (K, S, and Fe) as well as plant stress tolerance. Iron acquisition is both a known virulence factor (35) and a potential pathogen biocontrol signature, as nonpathogenic bacteria producing siderophores reduce iron availability, restricting pathogen growth (3, 36); therefore, it may benefit the plant to enhance siderophore production in the root and root zone.
Whereas plant endophytic colonization from soil microbiota is a quite well-established concept, the origin of plant epiphytes is believed to be more complex. In the present study, where epiphytes and endophytes were analyzed simultaneously, soil was more diverse and contained the majority of OTUs found in aboveground samples, suggesting that soil serves as a primary reservoir for potential plant-associated bacteria. Regarding endophytes, Rhizobium, Staphylococcus, and Agrobacterium spp. were observed in grapes and leaves but were not previously observed as epiphytes in the same plant parts of Merlot vines (22), suggesting that they likely originated in the soil and migrated through roots to aerial parts, where they flourished because of their potential adaptation to improved nutrient supply and reduced bacterium-bacterium competition due to the selective environment. In concordance, previous studies on grapevine endophytes demonstrated the migration of endophyte Burkholderia phytofirmans strain PsJN from the rhizosphere to young grapes of cutting systems (37). In addition, it is likely that the rootstock affects further endophytic colonization, as it has been shown to play a key role in pathogen resistance, and it may be expected that different rootstocks differentially select microbes from the surrounding soil. Further research is needed to explore the effects of rootstock selection on the final microbiota of grapevine tissues.
Referring to epiphytes, soil has been previously proposed as a potential microbial inoculum for grapevine aboveground organs. Martins and colleagues (22) showed that some epiphytic bacteria were common among aerial plant parts and soil, which led them to propose that the physical proximity between soil and grapevine parts might facilitate microbial migration through rain splash, high winds, insects, etc. In addition, Compant and colleagues (21) demonstrated that aboveground organs may also be colonized by epiphytes from other plant surfaces (38), which may explain the presence of species of taxa that were abundant and unique to aboveground grapevine parts in this study, e.g., Actinobacillus spp. were present in leaves and grapes but not in the rest of the sample types. Furthermore, while endophytes could colonize surface tissues, epiphytes could establish as endophytes through wounds and natural openings, suggesting that epiphytes and endophytes are part of a continuum (39, 40). Thus, none of these means of microbial colonization of plant organs are mutually exclusive and many or all of them may act in concert to influence the final grapevine organ microbial community structure.
Biogeographic trends in bacterial community structure and composition were observed only in bulk soil. Bacterial and fungal communities associated with Chardonnay and Cabernet Sauvignon musts have previously been shown to exhibit significant biogeography (19). In the current study, however, edaphic factors within vineyards outweighed biogeographic trends, suggesting that soil bacterial assemblages have extensive local heterogeneity even across small distances, and soils with similar edaphic variables and homogenous climatic conditions. This local heterogeneity could necessitate highly specific regionalization of vineyard management practices to support beneficial bacterial taxa, both above ground (e.g., Pseudomonas, Sphingomonas, and Methylobacterium spp.) and below ground (e.g., Rhizobiaceae and Bradyrhizobium spp.). The vineyard-associated localization of bacterial taxa has implications for viticulturists who rely on the assumption that the “land” imparts a unique quality to the wine specific to that growing site, called the terroir, but to date, only grapes and must have been implicated. These results suggest that the local biogeography of the soil microbiota may also have an indirect influence.
The origin of the microbes in wine ferments is still poorly understood, but, when not purposely inoculated, they are commonly assumed to come from the grapes themselves (41); however, some particular microbes might come from the winery equipment and barrels as well (42). The present study results evidenced that microbial community structures were most similar between grape and must samples, suggesting that the community present on grapes prior to fermentation remains relatively stable or, at least, more stable than differences among plant organs. Despite this, in comparisons of the phylotypes shared among the different sample types, California must samples shared more species of bacterial taxa with the soil from this study than with the grape samples. A plausible explanation might be related to the harvest practices and transport procedures, where harvested grapes ultimately forming part of the must might have received a significant input of microorganism phylotypes from soil when manually harvested, as these grapes are usually stored in boxes located on the ground. Mechanical harvesting is not exempt from this, as the machinery generates dust from the ground, which could colonize grapes. Martins and colleagues (22) proposed a similar idea, suggesting that dust generated in tillage (commonly used to control weeds in vineyards) might contribute to the migration of microorganisms from soil to aerial parts, where they would establish as grape epiphytes. All these results imply that soil microbiota may have a more direct role in winemaking and that soil microbiota are potentially involved in the formation of the regional wine terroir.
In conclusion, microbial community structures were significantly different between plant parts and soils, and yet aboveground samples shared more OTUs with belowground environments than they did with each other, suggesting that soil is a major microbial reservoir. Differences in the soil bacterial communities of different vineyards are reflected in the roots, with the abundances of species of several taxa showing specific vineyard regionalization. This suggests that, even within a single region, there can be significant variation in the community structure in both soils and vines, pointing to a potential microbial seed bank in soils that is differentially selected for by the Merlot vine and that might shape the microbial assemblages of aboveground organs, such as grapes, thereby indirectly influencing wine characteristics.
MATERIALS AND METHODS
Data availability.
16S rRNA raw data are publically available at the Earth Microbiome Project (EMP) portal (http://www.microbio.me/emp/), and shotgun metagenomic data are accessible through MG-RAST (http://metagenomics.anl.gov/). Both projects are available under the name “Merlot microbiome.”
Sample collection.
Grapevine samples were collected at 5 vineyards on Long Island (Suffolk County, NY) which are between 0.5 and 5 mi distant from each other. These vineyards contain many Merlot cultivars maintained under similar soil and climatic conditions. Additionally, these vineyards are managed by a single owner, minimizing differences in viticulture management. Five replicate plants of four Merlot cultivars (clones 1, 3, 6, and 181) growing in two soil types (Haven and Riverhead) were analyzed (see Table S6 in the supplemental material). All four clones had been grafted onto the same rootstock (no. 3309). Soil chemical analyses (described below) did not show significant differences between soil types; therefore, soil type was controlled for in statistical analyses but its direct effects were not examined.
In each grapevine, five different sample types were studied over 2 years (2011 and 2012): bulk soil, root zone soil (soil surrounding roots), roots, leaves, and grapes or flowers (season dependent) (see Table S6 in the supplemental material). In 2011, samples were collected in June (flowering) and September (at harvest). In 2012, samples were collected in April (dormant, no leaves or grapes collected) and September (at harvest). Plants were chosen to represent the same aspect (orientation to prevailing wind and sun) and position (proximity to end of row), and samples were randomly collected from each plant. A total of 720 samples were collected in New York.
Five bulk soil surface samples (depth, 5 to 7 cm) were collected 20 to 30 cm from each stem using a 33-in. by 7/8-in. soil corer and composited in the field. Homogenized soil was immediately passed through a 1-mm-pore-size sieve and divided into two subsamples, one each for soil chemistry and microbial community analysis. Roots and root zone soil samples were collected with a spade close to the stem at depths of 10 to 15 cm. Roots were manually removed from soil using sterile gloves. Five aboveground samples were collected per organ and plant (five leaves and five flowers or grapes). Leaves of similar developmental stages were collected. Undamaged grapes were chosen from different grape bunches (17). Additional grape samples of cultivar 181 Merlot grapevines (five plants) collected from the Chauteau Camensac winery in Bordeaux, France, following this protocol were sent to Argonne National Laboratory for sequencing. All belowground and aboveground samples were stored in sterile bags on dry ice at the time of sampling, and they were stored at −80°C until DNA extraction.
Analysis of abiotic factors: soil chemistry and climate.
Several edaphic factors were analyzed in bulk soil samples: soil temperature, pH, moisture, total carbon, and total nitrogen. Soil temperature was collected at sampling by insertion of a temperature probe into the open holes after soil coring. Soil pH was measured in a soil and water suspension (2:5 soil/water). Moisture content was obtained by the oven-drying method (at 105°C). Subsamples of each soil were pulverized in a ball mill (Spex CertiPrep, Metuchen, NJ) prior to total C and N measurement by dry combustion (900°C) with an Elementar vario MAX cube elemental analyzer (Hanau, Germany).
Suffolk region monthly precipitation and air temperature measurements for 2011 and 2012 were obtained from annual climatological summaries of Mattituck Station (40.990°N, 72.512°W) extracted from the National Oceanic and Atmospheric Administration (NOAA) Web page (http://www.ncdc.noaa.gov/cdo-web/datasets/ANNUAL/stations/COOP:305142/detail).
DNA extraction and sequencing.
Genomic DNA was extracted from all samples using a PowerSoil-htp 96-well DNA isolation kit (MoBio) with a 10-min (65°C) incubation step modification (http://www.earthmicrobiome.org/emp-standard-protocols/dna-extraction-protocol/). Extraction of DNA from plant parts and soil samples followed the same procedure. We did not conduct any sterilization prior to DNA extractions for any sample type, and for all sample types, endophytes and epiphytes were extracted, sequenced, and analyzed simultaneously. For the 16S rRNA gene amplicon analysis, the V4 16S region was amplified in triplicate for each sample using the 515F/806R primers with 12-bp barcodes as described by Caporaso and colleagues (8, 43) following the EMP PCR protocol (http://www.earthmicrobiome.org/emp-standard-protocols/16s/). The V4 region was chosen because it can adequately distinguish bacterial OTUs at the short read lengths used in this study (43). PCR products were pooled at equimolar concentrations and cleaned using an UltraClean PCR clean-up kit (MoBio). 16S rRNA amplicons were sequenced on an Illumina MiSeq instrument using 151-bp paired-end sequencing and on an Illumina HiSeq instrument using a single 151-bp read.
Additionally, 22 bulk soil and 26 root samples were randomly selected for shotgun metagenomic sequencing. Shotgun libraries were prepared using a Nextera XT DNA sample preparation kit (Illumina) following the manufacturer’s instructions. Libraries were sequenced using an Illumina MiSeq instrument with a 251-bp paired-end sequencing run. All sequencing was performed at the Next Generation Sequencing Core at Argonne National Laboratory.
Data analysis. (i) 16S rRNA gene amplicon analysis.
Forward raw sequences were demultiplexed and quality filtered using QIIME 1.7 (44). OTUs were clustered against GreenGenes 13_5 reference sequences, and reads failing to hit the reference were subsequently clustered de novo at the 97% similarity level using uclust (45). OTU sequences were aligned using PYNAST (46, 11). OTU taxonomy was determined using the RDP classifier retrained toward the GreenGenes database (97% similarity) (47). A tree was constructed from a gap-filtered alignment using FastTree (48). A final OTU table was created, excluding unaligned sequences, singletons, and sequences matching plant plastids. To avoid biases generated by differences in sequencing depth and removal of plastid sequences, the OTU table was rarified to an even depth of 1,000 sequences per sample in comparisons of all sample types in this study.
Downstream data analysis was conducted using QIIME 1.7 (44) or R software (v 3.0.1). The core microbiome and shared phylotypes were examined and OTUs shared between samples were visualized using a bipartite OTU network and the edge-weighted, spring-embedded algorithm for visualization in cytoscape (49). To reduce network complexity, the OTU table was filtered to include only OTUs detected at least 50 times across all samples.
Within sample type, alpha diversity estimates were calculated by analyzing the observed species, Shannon index, and evenness. Each sample type was analyzed independently to evaluate the potential influence of the remaining experimental factors (vineyard, cultivar, plant developmental stage, and year of collection) on the microbial communities, rarifying the belowground samples (bulk soils, root zone soils, and roots) to 5,100 reads per sample, flower samples to 1,500 reads per sample, and leaf and grape samples to 170 reads per sample. Beta diversity estimates based on UniFrac distances were used to examine community dissimilarity and determine the impact of experimental factors on microbial community structure. Principal coordinate analysis (PCoA) plots were used to visualize these differences. ANOVA was performed to determine which OTUs significantly differed in abundance among experimental factors after Bonferroni correction. Stratified permutational multivariate analysis of variance (PERMANOVA) with 999 permutations was conducted within each sample type to explore the percentage of variance explained by the remaining experimental factors to account for factor nesting. In addition, a multivariate regression tree (MRT) was generated using the mvpart package (50) in standardized data (sum of squares, 51) with 100 iterations and automatic selection of the best tree within 1 standard error (SE) of the overall best, to test the effect of the experimental factors (sample type, vineyard, cultivar, year, and plant developmental stage) and all edaphic factors (pH, moisture, soil temperature, nitrogen, carbon, and C:N ratio). In MRT analysis, data split into hierarchical clusters, where variables chosen for each split minimize within-cluster dissimilarity and thus have the greatest explanatory power.
The edaphic factors influencing the microbial communities of soils and grapevine organs were also explored by canonical correspondence analysis (CCA) using vegan (51). ANOVA followed by stepwise ordination was used to obtain the significance of the overall model used to create the CCA and obtain the significance P value for each of the variables included in the model. The BEST test was used to rank all edaphic variables by their importance and to identify the ones capturing the greatest variance in the community. Similarly, a Mantel test was used to examine the correlations among soil edaphic factors and microbial community structures (based on UniFrac distances). Pearson correlations were used to determine OTUs whose abundances were significantly correlated with particular edaphic factors (e.g., pH).
A supervised learning analysis (52) was conducted using the Random Forests classifier (53) with 1,000 trees, with OTUs as predictors and sample type or vineyard as class label, to evaluate not only the discriminative power of the microbiota to distinguish those groupings (sample type and vineyard) but also the robustness of the groupings themselves. The contribution of each OTU to the overall Bray-Curtis dissimilarity observed in comparisons of the microbial communities of the bulk soil and root samples from the different vineyards was analyzed by the similarity percentages test (51).
In addition, 16S rRNA sequences and the OTU table of a study analyzing California Merlot must samples were downloaded from the “2019” project accessible at QIIME-db (micro-bio.me/qiime/). That study targeted the same 16S gene region, the V4, and used the same primers as those used in the present study. The publicly available Merlot Californian must bacteria data set was compared to the Merlot grape microbiota sequence data set generated in this study, which included samples collected at five locations in Long Island (Suffolk, NY) and at a vineyard in Bordeaux, France. The closed reference OTUs of the two studies were merged, and the combined OTU table was rarified to 800 reads per sample. Diversity indices (alpha-diversities and beta-diversities), shared phylotypes, and core OTUs shared among samples were calculated in QIIME (44) as previously described.
The functional content of microbiota from all plant parts and soil samples was predicted from the 16S rRNA data using PICRUSt software (26). For that purpose, a closed reference OTU picking strategy was used, removing all the OTUs that did not match with the GreenGenes 13_5 reference sequences at 97% similarity. OTUs were normalized by dividing their abundances by known or predicted 16S copy number abundances (26) before final metagenomic functional predictions were created. Predicted functional counts were rarefied to an even depth, and single ANOVAs were calculated comparing KEGG orthology (KO) values (levels 2 and 3) among belowground and aboveground samples. To validate PICRUSt predictions, the predicted function counts (relative abundance of each gene) derived from the 16S rRNA amplicon data of root and bulk soil samples were compared to shotgun sequencing functional annotations of the same samples. The relative abundances in the predicted and observed datasets were correlated and distances were examined using Bray-Curtis dissimilarity matrices, which were determined to be statistically similar or dissimilar by Mantel test.
(ii) Shotgun metagenomic analysis.
The raw sequences from the Nextera XT libraries sequenced for 48 root and bulk soil samples were uploaded to MG-RAST v3 (54). Sequences were quality filtered and annotated following the default parameters. For downstream analysis, only the forward reads of the project were used. For taxonomic analysis of the metagenomes, the sequences obtained were compared to the GreenGenes database and M5NR database using a maximum E value of 1e-5, a minimum identity of 60%, and a minimum alignment length of 15. For functional analysis, sequences were compared using SubSystems and a maximum E value of 1e-5, a minimum identity of 60%, and a minimum alignment length of 15. A comparison of these annotations to KEGG and RefSeq data resulted in interpretations of the data that were not significantly different. A PCoA was created with the functional abundance hierarchical classification of all 48 samples to evaluate whether the metabolic capabilities of soil and roots differed. A subset of 12 (6 root samples and 6 bulk soil samples) of the 48 samples were further analyzed by comparing the Bray-Curtis distances of the relative abundances of the genes associated with functional categories in the root samples and bulk soil samples using the bar-chart tool, which returned a t test P value for the comparison. The 12 samples included in the analysis correspond to MG-RAST accession numbers 4520306.3, 4520328.3, 4520330.3, 4520336.3, 4520344.3, 4520350.3, 4520354.3, 4520366.3, 4520370.3, 4520380.3, 4520388.3, and 4520392.3 and comprise paired root and soil samples from the same plant, to avoid biases related to unbalanced representation and low replication of the factors studied, such as the different vineyards, clonal varieties, the year of collection, etc.
SUPPLEMENTAL MATERIAL
Functional PCoA (based on Bray-Curtis distance) of bulk soil and root samples determined using the normalized relative abundances of annotated genes showed differences in metabolic capability between the two samples: PCo1 r2 = 0.626 and PCo2 r2 = 0.150. Bulk soil samples are represented in red and root samples in green. Download
Multivariate regression tree (MRT) analysis conducted using OTU data sets from all samples (at the order level). The model included all the edaphic factors (pH, moisture, soil temperature, total C and N, and C:N ratio) and the categorical variables (sample type, vineyard, clone type, soil type, year, and plant developmental stage). The sample type was found to be the most important explanatory variable for the grouping of the samples. Download
(A) Numbers of OTUs shared among all plant parts and soil samples (each underlined value indicates the total number of OTUs found in that sample type). (B) Species richness (observed species and observed species error [Obs.Sp.Err.]), diversity (Shannon index), and evenness (equitability [Equit]) in all plant parts and soil samples determined after rarifying the samples to an even depth of 1,000 sequences per sample. (C) Supervised learning analysis results showing the predicted classification of samples to each of the types of sample origin (plant organ and soil samples).
OTUs that were unique in each of the sample types (plant organ and soil samples, respectively).
Functional categories of the annotated metagenome genes showing significantly higher relative abundances in the root microbial community than in the bulk soil microbiota (n = normalized abundance values averaged for each sample type).
Similarity percentage (simper) analysis for bulk soil and root samples from different vineyards. The tables in panels A and C indicate the families and their contributions (%) to the between-vineyards Bray-Curtis dissimilarity (only taxa contributing more than 2% are shown), and the tables in panels B and D show the relative abundances of those taxa in the community. (A) Major taxa contributing to the pairwise intervineyard differences in bulk soil samples. (B) Abundances of the taxa identified in the simper analysis as highly contributive to the microbiota differences between the bulk soil samples among vineyards. (C) Major taxa contributing to the pairwise intervineyard differences between root samples. (D) Abundances of the taxa identified in the simper analysis as highly contributive to the microbiota differences between root samples among vineyards.
Supervised learning classification to the vineyard of origin of bulk soil samples (A) and root samples (B). The clonal variety is indicated with a C (clones 1, 3, 6, and 181). “RH” and “HA” indicate the soil type (Riverhead and Haven, respectively). Shaded values indicate the group of samples with best predictions.
(A) Information about the samples collected from Long Island (Suffolk County, NY). “HA” and “RH” indicate the Haven and Riverhead soil types, respectively. “C” indicates the host genotype (clones 1, 3, 6, and 181). “X” or “–” indicates whether those samples were or were not collected. Additional grape samples of Merlot grapevines were collected from the Chauteau Camensac winery in Bordeaux, France, in October 2012 (n = 5) (data not shown). (B) Average measurements of soil edaphic factors for the 5 plant replicates per Long Island vineyard and month: pH, carbon (C), carbon/nitrogen ratio (C:N), nitrogen (N), moisture, and soil temperature.
Detailed analysis of taxon variation among samples. Download
ACKNOWLEDGMENTS
This work was supported by the Earth Microbiome Project, the FMC Center for Agricultural and Environmental Biotechnology, and a postdoctoral research grant (DKR program) to I.Z. from the Education, Universities and Investigation Department of the Basque government. This work was supported in part by the U.S Department of Energy under contract DE-AC02-06CH11357 and was completed with resources provided by the University of Chicago Research Computing Center.
We are grateful to Gilles Martin for giving us access to the Long Island vineyards in this study and assisting with the sampling and to Guilherme Martins from USC Oenologie-INRA/Bordeaux Science Agro for collecting and extracting the DNA of the Merlot samples from Château Camensac (Bordeaux). We acknowledge Sarah O’Brien and Timothy Vugteveen (Argonne National Laboratory) for their involvement in the soil chemistry analysis, as well as Sean M. Gibbons for his assistance with QIIME analysis.
Footnotes
Citation Zarraonaindia I, Owens SM, Weisenhorn P, West K, Hampton-Marcell J, Lax S, Bokulich NA, Mills DA, Martin G, Taghavi S, van der Lelie D, Gilbert JA. 2015. The soil microbiome influences grapevine-associated microbiota. mBio 6(2):e02527-14. doi:10.1128/mBio.02527-14.
REFERENCES
- 1.Kogel KH, Franken P, Hückelhoven R. 2006. Endophyte or parasite—what decides? Curr Opin Plant Biol 9:358–363. doi: 10.1016/j.pbi.2006.05.001. [DOI] [PubMed] [Google Scholar]
- 2.Newton AC, Fitt BD, Atkins SD, Walters DR, Daniell TJ. 2010. Pathogenesis, parasitism and mutualism in the trophic space of microbe-plant interactions. Trends Microbiol 18:365–373. doi: 10.1016/j.tim.2010.06.002. [DOI] [PubMed] [Google Scholar]
- 3.Van der Lelie D, Taghavi S, Monchy S, Schwender J, Miller L, Ferrieri R, Rogers A, Wu X, Zhu W, Weyens N, Vangronsveld J, Newman L. 2009. Poplar and its bacterial endophytes: coexistence and harmony. Crit Rev Plant Sci 28:346–358. doi: 10.1080/07352680903241204. [DOI] [Google Scholar]
- 4.Lugtenberg B, Kamilova F. 2009. Plant-growth-promoting rhizobacteria. Annu Rev Microbiol 63:541–556. doi: 10.1146/annurev.micro.62.081307.162918. [DOI] [PubMed] [Google Scholar]
- 5.Compant S, Clément C, Sessitsch A. 2010. Plant growth-promoting bacteria in the rhizo- and endosphere of plants: their role, colonization, mechanisms involved and prospects for utilization. Soil Biol Biochem 42:669–678. doi: 10.1016/j.soilbio.2009.11.024. [DOI] [Google Scholar]
- 6.Bhattacharyya PN, Jha DK. 2012. Plant growth-promoting rhizobacteria (PGPR): emergence in agriculture. World J Microbiol Biotechnol 28:1327–1350. doi: 10.1007/s11274-011-0979-9. [DOI] [PubMed] [Google Scholar]
- 7.Garbeva P, van Veen JA, van Elsas JD. 2004. Microbial diversity in soil: selection microbial populations by plant and soil type and implications for disease suppressiveness. Annu Rev Phytopathol 42:243–270. doi: 10.1146/annurev.phyto.42.012604.135455. [DOI] [PubMed] [Google Scholar]
- 8.Chanway CP, Shishido M, Nairn J, Jungwirth S, Markham J, Xiao G, Holl FB. 2000. Endophytic colonization and field responses of hybrid spruce seedlings after inoculation with plant growth-promoting rhizobacteria. Forest Ecol Manage 133:81–88. doi: 10.1016/S0378-1127(99)00300-X. [DOI] [Google Scholar]
- 9.Berg G, Smalla K. 2009. Plant species and soil type cooperatively shape the structure and function of microbial communities in the rhizosphere. FEMS Microbiol Ecol 68:1–13. doi: 10.1111/j.1574-6941.2009.00654.x. [DOI] [PubMed] [Google Scholar]
- 10.Bulgarelli D, Schlaeppi K, Spaepen S, Ver Loren van Themaat E, Schulze-Lefert P. 2013. Structure and functions of the bacterial microbiota of plants. Annu Rev Plant Biol 64:807–838. doi: 10.1146/annurev-arplant-050312-120106. [DOI] [PubMed] [Google Scholar]
- 11.Van Overbeek L, Van Elsas JD. 2008. Effects of plant genotype and growth stage on the structure of bacterial communities associated with potato (Solanum tuberosum L.). FEMS Microbiol Ecol 64:283–296. doi: 10.1111/j.1574-6941.2008.00469.x. [DOI] [PubMed] [Google Scholar]
- 12.Weinert N, Piceno Y, Ding G-C, Meincke R, Heuer H, Berg G, Schloter M, Andersen G, Smalla K. 2011. PhyloChip hybridization uncovered an enormous bacterial diversity in the rhizosphere of different potato cultivars: many common and few cultivar-dependent taxa. FEMS Microbiol Ecol 75:497–506. doi: 10.1111/j.1574-6941.2010.01025.x. [DOI] [PubMed] [Google Scholar]
- 13.Bulgarelli D, Rott M, Schlaeppi K, Ver Loren van Themaat E, Ahmadinejad N, Assenza F, Rauf P, Huettel B, Reinhardt R, Schmelzer E, Peplies J, Gloeckner FO, Amann R, Eickhorst T, Schulze-Lefert P. 2012. Revealing structure and assembly cues for Arabidopsis root-inhabiting bacterial microbiota. Nature 488:91–95. doi: 10.1038/nature11336. [DOI] [PubMed] [Google Scholar]
- 14.Lindow SE, Brandl MT. 2003. Microbiology of the phyllosphere. Appl Environ Microbiol 69:1875–1883. doi: 10.1128/AEM.69.4.1875-1883.2003. [DOI] [PMC free article] [PubMed] [Google Scholar]
- 15.Whipps JM, Hand P, Pink D, Bending GD. 2008. Phyllosphere microbiology with special reference to diversity and plant genotype. J Appl Microbiol 105:1744–1755. doi: 10.1111/j.1365-2672.2008.03906.x. [DOI] [PubMed] [Google Scholar]
- 16.Redford AJ, Bowers RM, Knight R, Linhart Y, Fierer N. 2010. The ecology of the phyllosphere: geographic and phylogenetic variability in the distribution of bacteria on tree leaves. Environ Microbiol 12:2885–2893. doi: 10.1111/j.1462-2920.2010.02258.x. [DOI] [PMC free article] [PubMed] [Google Scholar]
- 17.Barata A, Malfeito-Ferreira M, Loureiro V. 2012. The microbial ecology of wine grape berries. Int J Food Microbiol 153:243–259. doi: 10.1016/j.ijfoodmicro.2011.11.025. [DOI] [PubMed] [Google Scholar]
- 18.Verginer M, Leitner E, Berg G. 2010. Production of volatile metabolites by grape-associated microorganisms. J Agric Food Chem 58:8344–8350. doi: 10.1021/jf100393w. [DOI] [PubMed] [Google Scholar]
- 19.Bokulich NA, Thorngate JH, Richardson PM, Mills DA. 2014. Microbial biogeography of wine grapes is conditioned by cultivar, vintage, and climate. Proc Natl Acad Sci U S A 111:E139–E148. doi: 10.1073/pnas.1317377110. [DOI] [PMC free article] [PubMed] [Google Scholar]
- 20.Gilbert JA, van der Lelie D, Zarraonaindia I. 2014. Microbial terroir for wine grapes. Proc Natl Acad Sci U S A 111:5–6. doi: 10.1073/pnas.1320471110. [DOI] [PMC free article] [PubMed] [Google Scholar]
- 21.Compant S, Mitter B, Colli-Mull JG, Gangl H, Sessitsch A. 2011. Endophytes of grapevine flowers, berries, and seeds: identification of cultivable bacteria, comparison with other plant parts, and visualization of niches of colonization. Microb Ecol 62:188–197. doi: 10.1007/s00248-011-9883-y. [DOI] [PubMed] [Google Scholar]
- 22.Martins G, Lauga B, Miot-Sertier C, Mercier A, Lonvaud A, Soulas M-L, Soulas G, Masneuf-Pomarède I. 2013. Characterization of epiphytic bacterial communities from grapes, leaves, bark and soil of grapevine plants grown, and their relations. PLoS One 8:e73013. doi: 10.1371/journal.pone.0073013. [DOI] [PMC free article] [PubMed] [Google Scholar]
- 23.Lundberg DS, Lebeis SL, Paredes SH, Yourstone S, Gehring J, Malfatti S, Tremblay J, Engelbrektson A, Kunin V, del Rio TG, Edgar RC, Eickhorst T, Ley RE, Hugenholtz P, Tringe SG, Dangl JL. 2012. Defining the core Arabidopsis thaliana root microbiome. Nature 488:86–90. doi: 10.1038/nature11237. [DOI] [PMC free article] [PubMed] [Google Scholar]
- 24.Goumans DE, Chatzaki AK. 1998. Characterization and host range evaluation of Pseudomonas viridiflava from melon, blight, tomato, chrysanthemum and eggplant. Eur J Plant Pathol 104:181–188. doi: 10.1023/A:1008675704834. [DOI] [Google Scholar]
- 25.Goss EM. 2004. Genetic diversity, recombination and cryptic clades in Pseudomonas viridiflava infecting natural populations of Arabidopsis thaliana. Genetics 169:21–35. doi: 10.1534/genetics.104.031351. [DOI] [PMC free article] [PubMed] [Google Scholar]
- 26.Langille MG, Zaneveld J, Caporaso JG, McDonald D, Knights D, Reyes JA, Clemente JC, Burkepile DE, Vega Thurber RL, Knight R, Beiko RG, Huttenhower C. 2013. Predictive functional profiling of microbial communities using 16S rRNA marker gene sequences. Nat Biotechnol 31:814–821. doi: 10.1038/nbt.2676. [DOI] [PMC free article] [PubMed] [Google Scholar]
- 27.Bokulich NA, Joseph CM, Allen G, Benson AK, Mills DA. 2012. Next-generation sequencing reveals significant bacterial diversity of botrytized wine. PLoS One 7:e36357. doi: 10.1371/journal.pone.0036357. [DOI] [PMC free article] [PubMed] [Google Scholar]
- 28.Ottesen AR, Peña A, White JR, Pettengill JB, Li C, Allard S, Rideout S, Allard M, Hill T, Evans P, Strain E, Musser S, Knight R, Brown E. 2013. Baseline survey of the anatomical microbial ecology of an important food plant: Solanum lycopersicum (tomato). BMC Microbiol 13:114. doi: 10.1186/1471-2180-13-114. [DOI] [PMC free article] [PubMed] [Google Scholar]
- 29.Young IM, Ritz K. 2000. Tillage, habitat space and function of soil microbes. Soil Tillage Res 53:201–213. doi: 10.1016/S0167-1987(99)00106-3. [DOI] [Google Scholar]
- 30.Innerebner G, Knief C, Vorholt JA. 2011. Protection of Arabidopsis thaliana against leaf-pathogenic Pseudomonas syringae by sphingomonas strains in a controlled model system. Appl Environ Microbiol 77:3202–3210. doi: 10.1128/AEM.00133-11. [DOI] [PMC free article] [PubMed] [Google Scholar]
- 31.Kutschera U. 2007. Plant-associated methylobacteria as co-evolved phytosymbionts: a hypothesis. Plant Signal Behav 2:74–78. doi: 10.4161/psb.2.2.4073. [DOI] [PMC free article] [PubMed] [Google Scholar]
- 32.Fahrbach M, Kuever J, Remesch M, Huber BE, Kämpfer P, Dott W, Hollender J. 2008. Steroidobacter denitrificans gen. nov., sp. nov., a steroidal hormone-degrading gammaproteobacterium. Int J Syst Evol Microbiol 58:2215–2223. doi: 10.1099/ijs.0.65342-0. [DOI] [PubMed] [Google Scholar]
- 33.Ismail W, Ru Chiang Y. 2012. Oxic and anoxic metabolism of steroids by Bacteria. J. Bioremediation Biodegrad S1:001. doi: 10.4172/2155-6199.S1-001. [DOI] [Google Scholar]
- 34.Compant S, Duffy B, Nowak J, Clément C, Barka EA. 2005. Use of plant growth-promoting bacteria for biocontrol of plant diseases: principles, mechanisms of action, and future prospects. Appl Environ Microbiol 71:4951–4959. doi: 10.1128/AEM.71.9.4951-4959.2005. [DOI] [PMC free article] [PubMed] [Google Scholar]
- 35.Nairz M, Schroll A, Sonnweber T, Weiss G. 2010. The struggle for iron—a metal at the host-pathogen interface. Cell Microbiol 12:1691–1702. doi: 10.1111/j.1462-5822.2010.01529.x. [DOI] [PubMed] [Google Scholar]
- 36.Sessitsch A, Hardoim P, Döring J, Weilharter A, Krause A, Woyke T, Mitter B, Hauberg-Lotte L, Friedrich F, Rahalkar M, Hurek T, Sarkar A, Bodrossy L, van Overbeek L, Brar D, van Elsas JD, Reinhold-Hurek B. 2012. Functional characteristics of an endophyte community colonizing rice roots as revealed by metagenomic analysis. Mol Plant Microbe Interact 25:28–36. doi: 10.1094/MPMI-08-11-0204. [DOI] [PubMed] [Google Scholar]
- 37.Compant S, Kaplan H, Sessitsch A, Nowak J, Ait Barka E, Clément C. 2008. Endophytic colonization of Vitis vinifera L. by Burkholderia phytofirmans strain PsJN: from the rhizosphere to inflorescence tissues. FEMS Microbiol Ecol 63:84–93. doi: 10.1111/j.1574-6941.2007.00410.x. [DOI] [PubMed] [Google Scholar]
- 38.Leveau JHJ, Tech JJ. 2011. Grapevine microbiomics: bacterial diversity on grape leaves and berries revealed by high-throughput sequence analysis of 16S rRNA amplicons. Acta Hort (ISHS) 905:31–42. [Google Scholar]
- 39.Beattie GA, Lindow SE. 1999. Bacterial colonization of leaves: a spectrum of strategies. Phytopathology 89:353–359. doi: 10.1094/PHYTO.1999.89.5.353. [DOI] [PubMed] [Google Scholar]
- 40.Wilson M, Hirano SS, Lindow SE. 1999. Location and survival of leaf-associated bacteria in relation to pathogenicity and potential for growth within the leaf. Appl Environ Microbiol 65:1435–1443. [DOI] [PMC free article] [PubMed] [Google Scholar]
- 41.Mortimer R, Polsinelli M. 1999. On the origins of wine yeast. Res Microbiol 150:199–204. doi: 10.1016/S0923-2508(99)80036-9. [DOI] [PubMed] [Google Scholar]
- 42.Bokulich NA, Ohta M, Richardson PM, Mills DA. 2013. Monitoring seasonal changes in winery-resident microbiota. PLoS One 8:e66437. doi: 10.1371/journal.pone.0066437. [DOI] [PMC free article] [PubMed] [Google Scholar]
- 43.Caporaso JG, Lauber CL, Walters WA, Berg-Lyons D, Huntley J, Fierer N, Owens SM, Betley J, Fraser L, Bauer M, Gormley N, Gilbert JA, Smith G, Knight R. 2012. Ultra-high-throughput microbial community analysis on the Illumina HiSeq and MiSeq platforms. ISME J 6:1621–1624. doi: 10.1038/ismej.2012.8. [DOI] [PMC free article] [PubMed] [Google Scholar]
- 44.Caporaso JG, Kuczynski J, Stombaugh J, Bittinger K, Bushman FD, Costello EK, Fierer N, Peña AG, Goodrich JK, Gordon JI, Huttley GA, Kelley ST, Knights D, Koenig JE, Ley RE, Lozupone CA, McDonald D, Muegge BD, Pirrung M, Reeder J. 2010. QIIME allows analysis of high-throughput community sequencing data. Nat Methods 7:335–336. doi: 10.1038/nmeth.f.303. [DOI] [PMC free article] [PubMed] [Google Scholar]
- 45.Edgar RC. 2010. Search and clustering orders of magnitude faster than BLAST. BioInformatics 26:2460–2461. doi: 10.1093/bioinformatics/btq461. [DOI] [PubMed] [Google Scholar]
- 46.Caporaso JG, Bittinger K, Bushman FD, DeSantis TZ, Andersen GL, Knight R. 2010. PyNAST: a flexible tool for aligning sequences to a template alignment. Bioinformatics 26:266–267. doi: 10.1093/bioinformatics/btp636. [DOI] [PMC free article] [PubMed] [Google Scholar]
- 47.Wang Q, Garrity GM, Tiedje JM, Cole JR. 2007. Naive Bayesian classifier for rapid assignment of rRNA sequences into the new bacterial taxonomy. Appl Environ Microbiol 73:5261–5267. doi: 10.1128/AEM.00062-07. [DOI] [PMC free article] [PubMed] [Google Scholar]
- 48.Price MN, Dehal PS, Arkin AP. 2009. FastTree: computing large minimum evolution trees with profiles instead of a distance matrix. Mol Biol Evol 26:1641–1650. doi: 10.1093/molbev/msp077. [DOI] [PMC free article] [PubMed] [Google Scholar]
- 49.Saito R, Smoot ME, Ono K, Ruscheinski J, Wang P-L, Lotia S, Pico AR, Bader GD, Ideker T. 2012. A travel guide to cytoscape plugins. Nat Methods 9:1069–1076. doi: 10.1038/nmeth.2212. [DOI] [PMC free article] [PubMed] [Google Scholar]
- 50.De’Ath G. 2012. mvpart: multivariate partitioning. R package version 1.2-6. http://cran.r-project.org/web/packages/mvpart.
- 51.Oksanen J, Blanchet FG, Kindt R, Legendre P, Minchin PR, O'Hara RB, Simpson GL, Solymos P, Stevens MHH, Wagner H. 2013. Vegan: community ecology package. R pv 2.0-7. http://CRAN.R-project.org/package=vegan. [Google Scholar]
- 52.Knights D, Costello EK, Knight R. 2011. Supervised classification of human microbiota. FEMS Microbiol Rev 35:343–359. doi: 10.1111/j.1574-6976.2010.00251.x. [DOI] [PubMed] [Google Scholar]
- 53.Breiman L. 2001. Random forests. Mach Learn 45:5–32. doi: 10.1023/A:1010933404324. [DOI] [Google Scholar]
- 54.Meyer F, Paarmann D, D’Souza M, Olson R, Glass EM, Kubal M, Paczian T, Rodriguez A, Stevens R, Wilke A, Wilkening J, Edwards RA. 2008. The metagenomics RAST server—a public resource for the automatic phylogenetic and functional analysis of metagenomes. BMC Bioinformatics 9:386. doi: 10.1186/1471-2105-9-386. [DOI] [PMC free article] [PubMed] [Google Scholar]
Associated Data
This section collects any data citations, data availability statements, or supplementary materials included in this article.
Supplementary Materials
Functional PCoA (based on Bray-Curtis distance) of bulk soil and root samples determined using the normalized relative abundances of annotated genes showed differences in metabolic capability between the two samples: PCo1 r2 = 0.626 and PCo2 r2 = 0.150. Bulk soil samples are represented in red and root samples in green. Download
Multivariate regression tree (MRT) analysis conducted using OTU data sets from all samples (at the order level). The model included all the edaphic factors (pH, moisture, soil temperature, total C and N, and C:N ratio) and the categorical variables (sample type, vineyard, clone type, soil type, year, and plant developmental stage). The sample type was found to be the most important explanatory variable for the grouping of the samples. Download
(A) Numbers of OTUs shared among all plant parts and soil samples (each underlined value indicates the total number of OTUs found in that sample type). (B) Species richness (observed species and observed species error [Obs.Sp.Err.]), diversity (Shannon index), and evenness (equitability [Equit]) in all plant parts and soil samples determined after rarifying the samples to an even depth of 1,000 sequences per sample. (C) Supervised learning analysis results showing the predicted classification of samples to each of the types of sample origin (plant organ and soil samples).
OTUs that were unique in each of the sample types (plant organ and soil samples, respectively).
Functional categories of the annotated metagenome genes showing significantly higher relative abundances in the root microbial community than in the bulk soil microbiota (n = normalized abundance values averaged for each sample type).
Similarity percentage (simper) analysis for bulk soil and root samples from different vineyards. The tables in panels A and C indicate the families and their contributions (%) to the between-vineyards Bray-Curtis dissimilarity (only taxa contributing more than 2% are shown), and the tables in panels B and D show the relative abundances of those taxa in the community. (A) Major taxa contributing to the pairwise intervineyard differences in bulk soil samples. (B) Abundances of the taxa identified in the simper analysis as highly contributive to the microbiota differences between the bulk soil samples among vineyards. (C) Major taxa contributing to the pairwise intervineyard differences between root samples. (D) Abundances of the taxa identified in the simper analysis as highly contributive to the microbiota differences between root samples among vineyards.
Supervised learning classification to the vineyard of origin of bulk soil samples (A) and root samples (B). The clonal variety is indicated with a C (clones 1, 3, 6, and 181). “RH” and “HA” indicate the soil type (Riverhead and Haven, respectively). Shaded values indicate the group of samples with best predictions.
(A) Information about the samples collected from Long Island (Suffolk County, NY). “HA” and “RH” indicate the Haven and Riverhead soil types, respectively. “C” indicates the host genotype (clones 1, 3, 6, and 181). “X” or “–” indicates whether those samples were or were not collected. Additional grape samples of Merlot grapevines were collected from the Chauteau Camensac winery in Bordeaux, France, in October 2012 (n = 5) (data not shown). (B) Average measurements of soil edaphic factors for the 5 plant replicates per Long Island vineyard and month: pH, carbon (C), carbon/nitrogen ratio (C:N), nitrogen (N), moisture, and soil temperature.
Detailed analysis of taxon variation among samples. Download
Data Availability Statement
16S rRNA raw data are publically available at the Earth Microbiome Project (EMP) portal (http://www.microbio.me/emp/), and shotgun metagenomic data are accessible through MG-RAST (http://metagenomics.anl.gov/). Both projects are available under the name “Merlot microbiome.”