

ABSTRACT
We investigated the interaction between Sulfolobus spindle-shaped virus (SSV9) and its native archaeal host Sulfolobus islandicus. We show that upon exposure to SSV9, S. islandicus strain RJW002 has a significant growth delay where the majority of cells are dormant (viable but not growing) for 24 to 48 hours postinfection (hpi) compared to the growth of controls without virus. We demonstrate that in this system, dormancy (i) is induced by both active and inactive virus particles at a low multiplicity of infection (MOI), (ii) is reversible in strains with active CRISPR-Cas immunity that prevents the establishment of productive infections, and (iii) results in dramatic and rapid host death if virus persists in the culture even at low levels. Our results add a new dimension to evolutionary models of virus-host interactions, showing that the mere presence of a virus induces host cell stasis and death independent of infection. This novel, highly sensitive, and risky bet-hedging antiviral response must be integrated into models of virus-host interactions in this system so that the true ecological impact of viruses can be predicted and understood.
IMPORTANCE
Viruses of microbes play key roles in microbial ecology; however, our understanding of viral impact on host physiology is based on a few model bacteria that represent a small fraction of the life history strategies employed by hosts or viruses across the three domains that encompass the microbial world. We have demonstrated that rare and even inactive viruses induce dormancy in the model archaeon S. islandicus. Similar virus-induced dormancy strategies in other microbial systems may help to explain several confounding observations in other systems, including the surprising abundance of dormant cell types found in many microbial environments, the difficulty of culturing microorganisms in the laboratory, and the paradoxical virus-to-host abundances that do not match model predictions. A more accurate grasp of virus-host interactions will expand our understanding of the impact of viruses in microbial ecology.
INTRODUCTION
To date, models of coevolutionary dynamics between microbes and their viruses have been based primarily on tradeoffs between resistance and competitive fitness resulting from modification of cell surface receptors measured in a few model bacteria (1). Dynamics of the coevolutionary arms race have been demonstrated through experimental evolution and characterized at a molecular level (2, 3). Together, empirical data and theoretical models predict that variation in the tradeoff between resistance in the presence of the virus and competitive fitness without the virus result in the generation and maintenance of diversity in microbial populations (4, 5, 6) and may result in the majority of microbial cells exhibiting low activity due to resource limitation imposed as a tradeoff with resistance (7). However, whether these coevolutionary dynamics apply to the diversity of interactions between microbes and viruses across the three domains of life is not known. A broader understanding of microbe-virus interactions in model systems is needed in order to accurately infer the impact that viruses have on microbial ecology (8–11).
To augment our view of microbe-virus interactions occurring in natural systems, we examined the interaction between the double-stranded DNA (dsDNA) fusellovirus Sulfolobus spindle-shaped virus 9 (SSV9) (formerly Sulfolobus spindle-shaped virus Kamchatka-1) (12) and its crenarchaeal host Sulfolobus islandicus RJW002 (13). SSV9 was isolated from the Valley of the Geysers in Kamchatka, Russia, from an infected S. islandicus host (strain GV.10.6) (see Table S1 in the supplemental material). SSVs belong to the Fuselloviridae family, have dsDNA genomes, and can integrate site specifically into a host tRNA (14). Two SSVs have been studied in detail, SSV1 and SSV2, isolated from Japan and Iceland, respectively, from different Sulfolobus hosts (15–18), and neither of these has been shown to cause cell death in the nonnative host strain Sulfolobus solfataricus (15, 17).
S. islandicus (19) is a model system for investigating coevolutionary dynamics because it is becoming increasingly genetically tractable (20, 21) and natural variation of strains has been well characterized over time and space (22–24, 59). S. islandicus, like most Archaea, maintains a CRISPR-Cas immune system through which it targets and degrades invading genetic elements, guided by specific DNA spacer sequences in the CRISPR repeat-spacer arrays within its genome (25). S. islandicus strains have type I and type III CRISPR-Cas immune systems (23, 26, 27) and two or more CRISPR repeat-spacer arrays containing, on average, 180 spacers per individual (28, 29). In a population of S. islandicus cells from Kamchatka, Russia (23, 28), many of these spacers match to sequenced SSVs (28), suggesting frequent interactions with these viruses in nature and a selective benefit for cells to have immunity to viruses. Strain RJW002 has a single 100% CRISPR spacer match to SSV9, with an associated protospacer-associated motif (PAM) (30, 31).
Here, we investigate the impact of SSV9 on the growth and survival of S. islandicus RJW002 isolated from Kamchatka, Russia (see Table S1 in the supplemental material). Using a low multiplicity of infection (MOI), we uncover the fact that SSV9 induces a population-wide dormancy response from which only cultures with CRISPR immunity against the virus recover.
RESULTS
We began by identifying the effect of SSV9 on the growth of RJW002 in liquid cultures over time. The virus was added to RJW002 cultures for 5 h at an MOI calculated as 0.01 (by enumerating PFU), or 0.1 viral genomes/cell (using quantitative PCR [qPCR]) before unadsorbed virus was washed away and cells resuspended in virus-free medium. Surprisingly, as shown by the results in Fig. 1a, the addition of SSV9 at this low MOI to liquid cultures of RJW002 elicited a significant, 24- to 48-h growth delay compared to the growth of controls without virus. We observed a very low adsorption constant in these cultures of approximately 8.39 × 10⁻¹¹ ml/min (see Fig. S1 in the supplemental material). This low adsorption constant suggests that either binding of SSV9 is reversible, signaling virus presence but not resulting in virus uptake or injection, or S. islandicus cells have very few receptors for binding SSV9 and this binding induces signaling of viral presence from the 1% of infected host cells to others in the culture. Regardless of the mechanism, under these conditions, the very low abundance of virus particles can affect a large population of host cells.
FIG 1 .

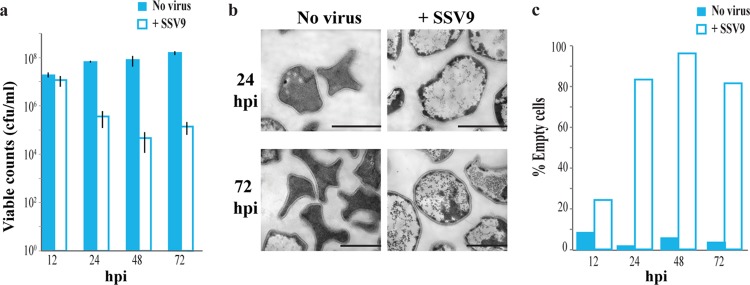
SSV9 induces dormancy in S. islandicus RJW002. (a) Results of three independent experiments showing growth of SSV9-challenged cultures. Samples were collected following a 5-h incubation with SSV9, after which cells were washed twice to remove any unadsorbed virus. Solid lines represent the average results from at least two technical replicates within each experiment. Error bars show ±1 standard deviation (SD). (b) Viable counts of RJW002 cultures with and without SSV9 challenge. Bars and error bars show mean results ± 1 SD (n = 3). (c) Cell morphology changes associated with SSV9 challenge in RJW002. Scale bar, 1 µm. (d) Percentages of empty cells observed by TEM in RJW002 cultures with and without SSV9 challenge. At least 200 cells were counted at each time point in two independent experiments.
To test for cell viability during this population-wide growth delay, we removed RJW002 cells from the flask after the initial viral challenge and plated them on solid medium. The results in Fig. 1b show that RJW002 cells challenged with SSV9 were viable but not growing, with a constant colony count, from 12 to 24 hours postinfection (hpi), in contrast to the virus-free controls, which underwent two doubling events. These data indicate that challenge of RJW002 with SSV9 induced a population-wide stasis or dormancy response, where the majority of cells are viable but not actively growing. Visualized by transmission electron microscopy (TEM) at 24 hpi, approximately 95% of RJW002 cells challenged with SSV9 appeared devoid of cellular contents and exhibit a spherical morphology, suggesting possible disruption of membrane integrity (Fig. 1c). Although the number of empty cells increased dramatically, from 40% to 95% (Fig. 1d), between 12 hpi and 24 hpi, the colony counts on plates (CFU/ml) (Fig. 1b) remained constant, demonstrating that these empty, dormant cells were able to recover and grow.
The genome of S. islandicus strain RJW002 has a single 100% match to SSV9 in the A1 repeat-spacer array (Fig. 2a). We hypothesized that CRISPR-Cas immunity functioned to prevent the virus from establishing a productive infection, allowing the removal of the virus from culture and the rapid recovery of dormant S. islandicus cells. To test this hypothesis, we constructed mutants in the RJW002 background with in-frame deletion mutations of CRISPR-Cas components essential for CRISPR RNA processing and interference and of several components involved in other aspects of the CRISPR-Cas system (32) as controls (see Table S1 in the supplemental material). Virus quantification after viral challenge showed that no infectious particles were produced in RJW002 or the ΔA2 and Δcas1 mutants (controls whose deletions are predicted not to disrupt CRISPR immunity against SSV9) (Fig. 2b). SSV9 DNA was below the limit of detection by qPCR after 48 hpi (see Fig. S2a in the supplemental material) and decreased at a rate similar to the rate at which the virus degrades in controls without cells added (see Fig. S2b and S2c). In contrast, in cultures of mutants that had deletions of the spacer match against SSV9 (ΔA1 mutant) or CRISPR components involved in CRISPR RNA (crRNA) processing (Δcas6 mutant) or interference (Δcas3′ + 3″ mutant, in which the helicase domain known as Cas3′ is fused with a nuclease domain known as Cas3″ [32]), newly produced infectious SSV9 particles were observed to increase by more than 2 orders of magnitude by 24 hpi (Fig. 2b; see Fig. S2a) and were maintained at a constant ratio (3 × 10³ per ml ± 1 × 10³ [average ± standard deviation]) of approximately 0.01 infectious particles to cell. Whether new viral particles infect and replicate in dormant cells (33) or a small subset of nondormant host cells is not known. The fact that under these conditions, immune-deficient cells produced SSV9 while those with immunity did not supports our hypothesis that the type 1A CRISPR-Cas system acts to prevent viral replication, allowing the virus to be eliminated from the culture and permitting host recovery.
FIG 2 .
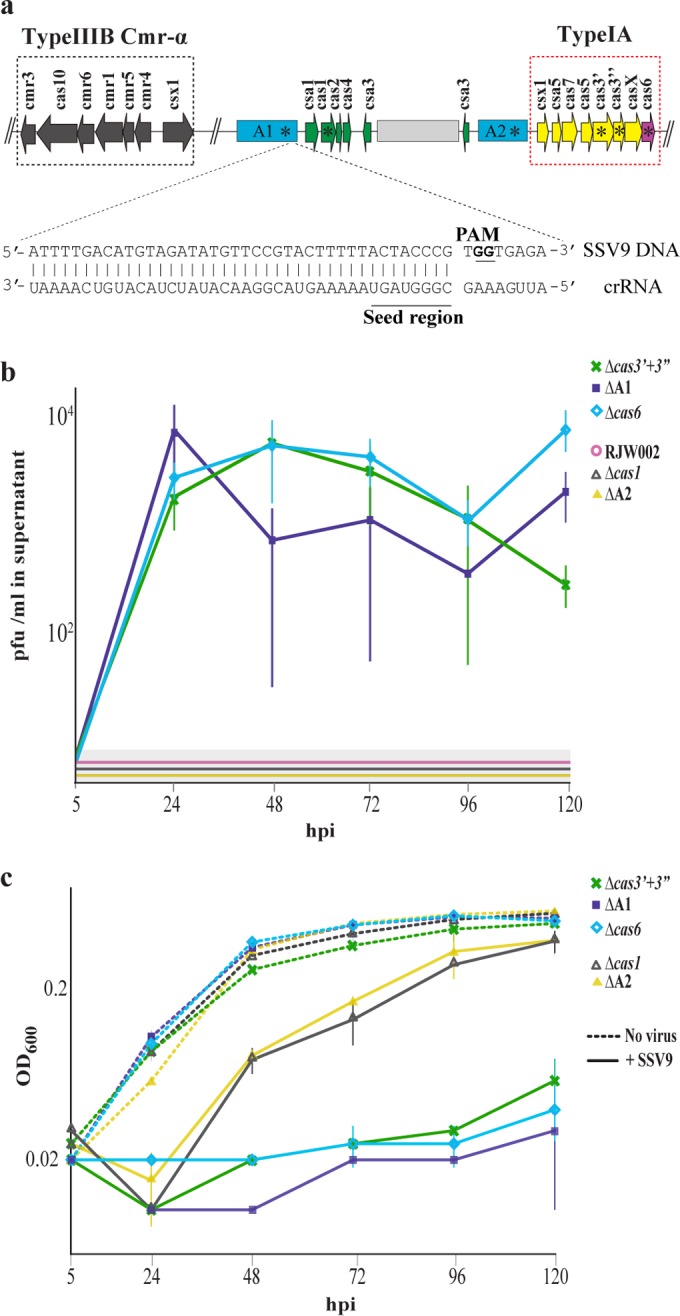
CRISPR-Cas immunity allows cultures to clear virus and recover from dormancy. (a) Schematic representation of the CRISPR-Cas locus in S. islandicus RJW002. Genes involved in type IA CRISPR-Cas immunity are colored to indicate putative function (green, spacer acquisition; pink, crRNA processing; yellow, interference). The third leadermost spacer in the A1 locus matches SSV9 with 100% identity and has a conserved protospacer-associated motif (PAM). In-frame deletions of the A1 and A2 repeat-spacer arrays and cas genes constructed for this study are denoted by asterisks. Light grey bar indicates insertion present in putative transcriptional regulator csa3. (b) Quantification of newly synthesized SSV9 infectious particles in RJW002 and CRISPR-Cas deletion mutants after 5-h challenge followed by washing of unadsorbed particles. Lines inside grey boxes indicate that no signal was detected at that time point. Lines and error bars show mean results ± 1 SD (n = 3). (c) Results of representative experiment showing growth of SSV9-challenged cultures of CRISPR-Cas mutants. Solid lines represent the average results of at least two technical replicates. Error bars show ±1 SD.
The growth of immune-deficient strains (Δcas6, Δcas3′ + 3″, and ΔA1 mutants) in liquid culture when challenged with SSV9 showed a very different trajectory than the growth of strains with immunity, with no significant increase in optical density (OD) for immune-deficient strains during the course of the experiment (Fig. 2c; see Fig. S3 in the supplemental material). In contrast to the immune strain RJW002, Δcas6 mutant colony counts decreased dramatically upon challenge with SSV9, such that only 1% of the cells were viable by 24 hpi (Fig. 3a). TEMs showed that 80% of immune-deficient (Δcas6) cultures had the same empty phenotype as RJW002 by 24 hpi (Fig. 3b) but they did not recover over the course of the experiment (Fig. 3c). Even in cells that were shown to be inviable, lysis (broken cells) was not observed (Fig. 3b). This may explain the constant, nondecreasing OD observed in liquid cultures. These results demonstrate that challenge of immune-deficient cells with SSV9 even at a low MOI of 0.01 resulted in dramatic cell death instead of recovery.
FIG 3 .
Challenge of CRISPR-deficient cultures with SSV9 induces cell death. (a) Viable counts of Δcas6 cultures with and without SSV9 challenge. Bars and error bars show mean results ± 1 SD (n = 3). (b) Cell morphology changes associated with SSV9 challenge in Δcas6. Scale bar, 1 µm. (c) Percentages of empty cells observed by TEM in Δcas6 cultures with and without SSV9 challenge. At least 200 cells were counted at each time point in two independent experiments.
We hypothesized that death in these cultures resulted from a prolonged antiviral dormancy response induced by the continuous presence of SSV9 in immune-deficient cultures where the virus was produced. We tested this hypothesis by inactivating SSV9 with UV and observing the response of cultures when challenged with inactivated particles. As shown by the results in Fig. 4, challenge with virus particles that had been inactivated by UV irradiation resulted in the dormancy-recovery phenotype observed in RJW002. The same response was observed in the Δcas6 strain, where there was no virus production (Fig. 4a). We then subjected both strains to repeated addition of inactivated viral particles (Fig. 4b and c) and found that in both immune and nonimmune strains, prolonged exposure by the addition of UV-inactivated viruses resulted in extensive cell death, and no colonies were recovered on solid medium from samples collected at 72 hpi (Fig. 4c). These results demonstrated that prolonged virus-induced host cell dormancy could lead to cell death with no viral replication or lysis.
FIG 4 .
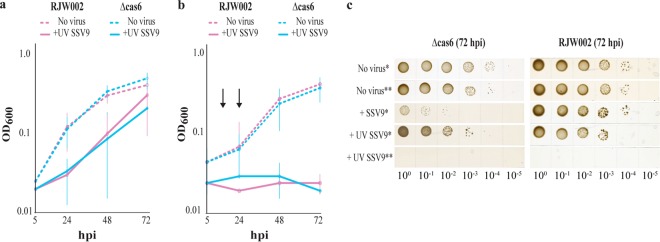
Prolonged dormancy due to continuous virus presence causes cells to die. Results show growth of immune (RJW002) and immune-deficient (Δcas6) cultures challenged with a single dose of UV-inactivated SSV9 (added once and washed out after 5 h) (a), three consecutive doses of UV-inactivated SSV9 (added at 0, as well as 18 and 24 h [arrows]) (b), or UV-irradiated RJW002 supernatant as a no-virus control (a and b). Lines and error bars show mean results ± 1 SD (n = 3). (c) Representative image showing growth of RJW002 and Δcas6 cultures at sampled at 72 hpi. One asterisk indicates that one dose was added, and 2 asterisks indicates three doses were added.
DISCUSSION
We have shown that in the archaeon S. islandicus, exposure to the virus SSV9 induces cell dormancy and death. The population-wide effect of dormancy occurs even when viruses are rare or inactivated, indicating that it is an antiviral response that is independent of infection. The risky, bet-hedging strategy of dormancy is reversible, allowing host cells to recover and grow normally when virus particles are prevented from productive infection by CRISPR-Cas immunity.
Dormancy has been demonstrated in many nonmicrobial systems (34, 35) as a bet-hedging strategy in the face of environmental variation and predation (34) and in microorganisms challenged by other stresses (36). In these systems, the cost of remaining active (for example, selective predation of active individuals) allows the evolution of potentially costly bet-hedging strategies of dormancy (37, 38). By analogy, it is likely that if dormancy protects against infection with highly virulent lytic viruses known to exist in this system (39), it may be an adaptive antiviral strategy.
It is also possible that dormancy serves to facilitate immunity or other mechanisms of viral targeting. Recently, based on the conserved genomic association between CRISPR-Cas loci and putative toxin-antitoxin (TA) systems, Makarova et al. predicted that cells armed with CRISPRs should respond to the stress imposed by viral infection by going into a dormant state (viable but not growing) induced by TA systems while the cell is mounting an immune response (40). The predicted function of dormancy is to allow cells to acquire new CRISPR spacers before the virus is able to complete its life cycle. Although no novel spacer acquisition was observed in this system, this may result from an insertion within the putative regulator of spacer acquisition csa3 (41). The molecular mechanism of dormancy and its consequence for CRISPR-spacer acquisition is yet to be determined.
The infection-independent induction of host cell response appears to be distinct from the few well characterized bacterial abortive infection systems which cause cell death through mechanisms that are triggered by virus replication, transcription, or translation (42). It remains to be determined whether the mechanism of dormancy in this system is host or virus associated or whether it is triggered by binding of SSV9 to the host or by some factor (e.g., host- or virus-derived proteins) packaged within the viral particles. It has been observed in mammalian cell cultures that host-derived proteins packaged within particles of Sindbis virus can modulate the production of type I interferon upon challenge with inactivated particles (43).
Rapid advances in molecular techniques have allowed high-throughput analysis of the vast diversity of uncultivable but ecologically important microbial virus and host abundance over time and space (44–49). Theoretical models are rapidly developing to explain these patterns (4, 7, 50) in order to relate phage-host dynamics to ecologically important factors, such as nutrient cycling in the ocean (51) or the human microbiome (52). Recent models of virus-host interactions predict that the majority of microorganisms in natural populations will have low activity due to the high cost of viral resistance, while abundant viruses will predominate in rare, highly active taxa (53). This prediction has been used to explain the relative virus-to-host ratio observed through culture-independent techniques (9) and is supported by the widespread observation of dormant cells in a diversity of environments (36). Here, we have shown that dormancy itself is an antiviral strategy in this archaeal system, as well as the dramatic impact rare or inactivated viruses may have on a population of host cells even without infecting them. Could mechanisms like this explain the predominance of dormancy in many microbial ecosystems (54)? Could dormancy induced by the presence of viruses in an inoculum contribute to the difficulty of cultivating diverse microorganisms in culture? This type of antiviral response and others must be integrated into models of virus-host interactions before observations of relative virus-host abundances and their impacts on the ecology of natural systems can be well understood.
MATERIALS AND METHODS
Strains and growth conditions.
Escherichia coli was grown on Luria-Bertani medium at 37°C. Ampicillin (100 µg/ml) was added to the medium when needed. All S. islandicus strains were grown in dextrin-tryptone (DT) medium or DT medium supplemented with 20 µg/ml uracil (DTU) at pH 3.5 and incubated at approximately 75 to 78°C in tissue culture flasks (Falcon; BD, United States) without shaking (55). For solid medium, prewarmed 2× DT or 2× DTU supplemented with 20 mM MgSO4 and 7 mM CaCl2·2H2O was mixed with an equal volume of fresh, boiling 1.8% gelrite and then immediately poured into petri dishes.
Strain construction.
E. coli Top10 (Invitrogen) was used for molecular cloning. A cloning vector, pRJW2 (56) (see Table S2 in the supplemental material) carrying a pyrEF expression cassette from S. solfataricus strain P2 was employed to construct gene knockout plasmids. Knockout plasmids carrying cas1, cas3′+3″, cas6, A1, and A2 for markerless gene deletion were constructed via a plasmid integration and segregation (PIS) method (56). Briefly, approximately 0.8 to 1.1 kb of the upstream and downstream flanking regions (Up-arm or Dn-arm) of each gene were amplified from S. islandicus M.16.4 (22) (see Table S1), using the primer sets listed in Table S3 (Integrated DNA Technologies). The Up-arm and Dn-arm were introduced using MluI/PstI and PstI/SalI, respectively (New England Biolabs). The MluI-PstI-digested Up-arm and PstI-SalI-digested Dn-arm were inserted into pRJW2 at the MluI and SalI sites by a triple ligation, generating knockout plasmids pPIS-Cas1, -Cas3′+3″, -Cas6, -A1, and -A2 (see Table S2). Plasmid DNA from E. coli was purified with the QIAprep spin miniprep kit. PCR was performed using Phusion High-Fidelity DNA polymerase (Thermo Scientific), and standard methods were used for general DNA cloning.
Knockout plasmids were transformed into S. islandicus RJW002 (13) via electroporation as previously described (56), with the following modifications. To enrich for transformants, cells were incubated in 20 ml DT medium for two to three weeks and then spread on DT solid medium plates for another 10 days of incubation. Positive transformants were identified, purified, and then used for counterselection on DTU plates containing 5-fluoroorotic acid (5-FOA).
Genome resequencing.
Genomic DNA of S. islandicus was extracted as previously described (24). Genomic libraries were prepared for the immune-deficient mutants (Δcas3′+3″, Δcas6, and ΔA1 strains) and the RJW002 ancestor using the NexteraXT kit (Illumina) following the manufacturer’s instructions. Libraries were pooled and sequenced using MiSeq version 2.5 by the W. M. Keck Center for Comparative and Functional Genomics at the University of Illinois at Urbana-Champaign. Mutations were identified by comparing reads from RJW002 and the Δcas3, ΔA1, and Δcas6 mutants to the genome of the wild-type ancestor S. islandicus M.16.4, using Breseq (55) with default parameters. All alignments were manually inspected. The ΔA1, Δcas3, and Δcas6 strains show between 1 and 5 independent mutations at synonymous or noncoding positions unrelated to CRISPR immunity in addition to the engineered deletions (see Table S4 in the supplemental material). The Δcas6 mutant yielded only two mutations other than the deletion of the cas6 gene compared to its ancestor RJW002 (see Table S4). One of these mutations is silent, and the other is a base substitution in the gene adjacent to cas6, casX (Fig. 2a). Although we cannot verify that the deletion of Δcas6 is alone responsible for the phenotype observed, the Δcas6 strain is a bona fide CRISPR deletion mutant since the only mutations that distinguish it from its immune ancestor are in cas genes.
Virus preparation and quantification.
To obtain SSV9, GV.10.6 (see Table S1 in the supplemental material) was grown in 300 ml of DT medium in 375-cm2 culture flasks (BD Falcon) at 78°C until early stationary phase. Cultures were filtered through 0.22-µm polyethersulfone (PES) membrane filters (Millipore) to remove cells, and virus-containing filtrates were concentrated 10-fold using Spin-X columns (molecular weight cutoff, 30,000; Corning, Inc.) and stored at 4°C until used. Virus filtrates were incubated with fresh liquid DT medium to ensure that there was no cell contamination. To determine viral titers, 100 µl of each dilution (100, 10−1, and 10−2) was mixed with 500 µl of mid-log-phase, 10-times-concentrated S. islandicus strain Y08.82.36 (see Table S1), a highly susceptible Sulfolobus islandicus host isolated from Yellowstone National Park. Cells mixed with virus dilutions were plated on overlays of sucrose-yeast (SY) medium containing 0.1% yeast extract and 0.2% sucrose as previously described (15) and incubated at 78°C for 48 h. Dilutions were performed and plated in triplicate for each sample. SSV9 genome copy numbers were determined by qPCR using primers SSV9F/SSV9R (see Table S3) that are designed to amplify a 138-bp section of the VP1 coat protein; 3 pmol of each primer was added to 5 µl of SsoFast EvaGreen supermix (Bio-Rad) and 0.5 µl of sample, and the volume was adjusted to 10 µl with PCR-grade water. Three technical replicates were performed per sample in each 96-well plate. The reaction was carried out using a Realplex (Eppendorf) thermocycler with the following protocol: 98°C for 2 min, 40 cycles of 98°C for 5 s followed by 60°C for 20 s, and a final melt analysis ramping from 65 to 95°C. The standard curve was generated using a known amount of plasmid containing the target sequence.
Calculation of SSV9 adsorption constant.
Two milliliters of an ~10,000 PFU/ml stock of SSV9 were added to each of three tubes. Amounts of 8.3 × 10⁸ cells of RJW002 or Sulfolobus acidocaldarius DSM 649 (57), a host that does not adsorb SSV9, were added to two of the tubes containing SSV9. The third tube did not have cells added and served as a control to assay for viral decay. Samples were collected before cells were added and 0, 5, 10, 15, 20, 25, 30, 40, 50, 60, 120, and 300 min after cell addition. Samples were centrifuged at maximum speed (15,000 × g) for 5 min, and the supernatant was collected. To determine unabsorbed SSV9 particles, 200 µl of a 10−1 dilution of the supernatant was mixed with 500 µl of mid-log-phase, 10-times-concentrated S. islandicus Y08.82.36. Cells mixed with virus dilutions were plated on overlays of SY medium and incubated at 78°C for 48 h. Dilutions were performed and plated in triplicate. Three independent experiments were performed. The SSV9 adsorption constant on RJW002 was calculated as previously described (58) using the formula k = [2.3/(B × t)]log − (Po/P), where k is the adsorption constant (ml/min), B is the concentration of cells (cells/ml), t is the time interval in which the titer falls from Po to P (min), Po is the original titer, and P is the final titer.
SSV9 challenge experiments.
S. islandicus RJW002 and all of the CRISPR-Cas deletion mutants (see Table S1 in the supplemental material) were grown until mid-log phase (optical density at 600 nm [OD600] between 0.08 and 0.15). Amounts of ~5.0 × 10⁹ cells were spun down for 15 min at 4,000 × g, and the supernatant was discarded. Cells were resuspended in 3 ml of DTU liquid medium. Two milliliters of the concentrated cell suspension were challenged with virus filtrate adjusted with DT (if necessary) to a final multiplicity of infection (MOI) of ~0.01 in a final volume of 40 ml. The MOI was calculated based on the titer obtained on S. islandicus Y08.82.36. This MOI would be equivalent to ~0.1 if qPCR quantification was used instead. The remaining 1 ml of concentrated cell suspension was mixed with the equivalent volume of DTU without virus as a control. Uracil was added to the virus filtrate to a final concentration of 20 µg/ml prior to mixing. The mixtures were shaken at 60 rpm for 5 h at 78°C. Following virus challenge, the cells were washed twice with DTU to reduce background quantification of unadsorbed virus. Cell pellets of cultures challenged with virus were resuspended in 140 ml of DTU that was split into two 75-cm2 tissue culture flasks and incubated at 78°C without shaking. Controls were resuspended in 70 ml of DTU. Cell growth was measured by the OD600 for all strains, and SSV9 abundance was measured by qPCR to quantify virus in the entire culture and by measuring PFU/ml in culture supernatants. To measure PFU/ml, 800 µl of each infected culture was transferred to a 1.5-ml tube and spun down at 9,400 × g for 5 min. Supernatants were carefully transferred to a new tube to avoid disrupting the pellets, and viral titers were determined on S. islandicus Y08.82.36 as described above. To determine viable counts, experiments were set up as described above for RJW002 and the Δcas6 mutant. At each sampling time point, cultures were plated on DTU plates with overlays as follows: 200-µl amounts of 10−3, 10−4, 10−5, and 10−6 dilutions were added to tubes containing 10 ml of a mixture of equal parts of prewarmed 2× DTU and 0.8% gelrite, mixed, poured immediately onto warm DTU plates, and incubated for 10 to 14 days at 78°C. Dilutions were performed and plated in triplicate for each sample. At least three independent experiments were performed.
Challenge with UV-inactivated SSV9.
SSV9 filtrates were UV irradiated in open petri dishes with 1 J/cm2 of energy using a CL-1000 UV crosslinker (UVP, Inc.). Approximately 3.33 × 10⁹ cells of mid-log-phase (OD600 between 0.08 and 0.15) S. islandicus RJW002 and the Δcas6 mutant were spun down for 15 min at 4,000 × g, and the supernatant was discarded. Cells were resuspended in 4 ml of DTU liquid medium. One milliliter of the concentrated cell suspension was challenged with 20 ml of UV-irradiated SSV9 (adjusted to an MOI of 0.01 before inactivation). In control (no virus) cultures, 1 ml of the concentrated cell suspension was treated with 20 ml of RJW002 spent medium irradiated with the same dosage of UV. Uracil was added to the UV-irradiated virus filtrate/spent medium to a final concentration of 20 µg/ml prior to mixing. The mixtures were shaken at 60 rpm for 5 h at 78°C, after which the cells were washed twice with DTU. One hundred-microliter amounts of all irradiated SSV9 filtrates were mixed and plated with 500 µl of 10× mid-log-phase cells of the titering host S. islandicus Y08.82.36 as described above to make sure no infectious particles remained after UV treatment. For the continuous challenge with UV-inactivated particles, cells were challenged as described above but 5 h after the initial addition of UV-inactivated SSV9, cells were not washed but adjusted to a final volume of 70 ml. At 18 and 24 h, 20 ml of each culture was removed and spun down for 15 min at 4,000 × g. Supernatants were discarded, and the pellet was resuspended in 20 ml of freshly UV-irradiated SSV9 and added back into the flask. Cell growth was measured by the OD600 at 72 hpi. Ten-microliter amounts of serially diluted cultures (100 to 10−5) were spotted onto DTU plates and incubated for 7 days at 78 h. Ten-microliter amounts of culture supernatants of cultures collected at 12, 24, 48, and 72 hpi were spotted onto lawns of S. islandicus Y08.82.36 to verify that the virus had not established a productive infection in these cultures. Three independent replicates were performed.
Transmission electron microscopy.
Cells from RJW002 and Δcas6 strain liquid infections were collected at 12, 24, 48, and 72 hpi by low-speed centrifugation. The cells were perfused with Karnovsky’s fixative in phosphate-buffered (pH 7.2) 2% glutaraldehyde and 2.5% paraformaldehyde solution and stored at 4°C until processed. Samples were processed and visualized at the Frederick Seitz Materials Research Laboratory Central Research Facilities, University of Illinois at Urbana-Champaign, as follows. Microwave fixation was used with this primary fixative. Cells were then washed in cacodylate buffer with no further additives. Microwave fixation was also used with the secondary 2% osmium tetroxide fixative, followed by the addition of 3% potassium ferricyanide for 30 min. After washing with water, saturated uranyl acetate was added for en bloc staining. The sample was dehydrated in a series of increasing concentrations of ethanol. Acetonitrile was used as the transition fluid between ethanol and the epoxy. The infiltration series was done with an epoxy mixture using the Epon substitute Lx112. The resulting blocks were polymerized at 90°C overnight and trimmed, and ultrathin sections were cut with diamond knives. The sections were stained with uranyl acetate and lead citrate and examined and photographed with a Hitachi H600 transmission electron microscope.
Enumeration of dormant cells.
Thin sections of control (no-virus) and SSV9-infected cells prepared for TEM were viewed under low magnification (×5,000) (see Fig. S4 in the supplemental material), and cell types were counted at each time point. At least 200 cells were counted at each time point from two independent experiments and assigned to the following categories: (i) empty or (ii) full.
SUPPLEMENTAL MATERIAL
Adsorption dynamics of SSV9 on RJW002. Decrease of free SSV9 infectious particles in the medium after the addition of host RJW002, nonhost Sulfolobus acidocaldarius, and virus alone. Dashed line indicates values used for the final titer in the adsorption rate constant calculation. Lines and error bars show mean results ± 1 standard deviation (SD) (n = 3). Download
SSV9 can replicate in CRISPR-Cas-deficient cultures, but infection is cleared in immune cultures. (a) SSV9 genome abundance was determined by qPCR of infected cultures. (b and c) Virus decay was measured by determining infectious particles (b) and by SSV9 genome abundance in flasks with no cells added (c). Dashed lines indicate detection limit of each technique. Data points below the dashed line denote that no signal was detected. Lines and error bars show mean results ± 1 SD (n = 3). Download
Challenge of CRISPR-mediated immune cultures with SSV9 induces dormancy. Results from two additional independent experiments show growth of SSV9-challenged cultures. Solid lines represent the average results from at least two technical replicates within each experiment. Lines and error bars show mean results ± 1 SD. Download
Dormant cells are observed in immune and immune-deficient cultures after challenge with SSV9. (a) Dormant (empty) cells are observed in cultures of RJW002 and the Δcas6 mutant in the first 48 hpi, but RJW002 cultures recover by 72 hpi. (b) Representative low-magnification images of SSV9-challenged RJW002 and the Δcas6 mutant at 48 hpi, where the majority of cells look dormant (empty). Download
Sulfolobus islandicus strains used in this study.
Plasmids and viruses used in this study.
Primers used in this study. aAdded restriction sites are underlined.
Unique mutations present in the immune-deficient (ΔA1, Δcas3, and Δcas6) strains. Gray boxes denote genes or loci that were intended for deletion. Boldface font denotes nonsynonymous mutations or deletions and duplications in coding regions. CR, mutation within the CRISPR-Cas region of the chromosome, including the type I and type III systems in RJW002. This region spans positions 823,400 to 872,588 of the Sulfolobus islandicus M.16.4 chromosome (see Table S1).
ACKNOWLEDGMENTS
This work was supported by NSF DEB grant 0816885 and NSF Dimensions of Diversity grant DEB 1342876.
We acknowledge K. Stedman for providing strain GV.10.6. We also thank C. Cáceres, P. Degnan, W. England, D. Krause, J. Lennon, J. Slauch, J. Shisler, M. Young, C. Vanderpool, A. Kouris, J. Weitz, and two anonymous reviewers for innovative discussion of the paper and for suggesting approaches. We thank E. Rowland for providing the data on SSV9 adsorption dynamics. We thank J. Black for experimental assistance. We acknowledge the W. M. Keck Center for Comparative and Functional Genomics at University of Illinois at Urbana-Champaign for performing the next-generation sequencing in this work. Finally, we acknowledge L. A. Miller at the Frederick Seitz Materials Research Laboratory Central Research Facilities, University of Illinois at Urbana-Champaign, for performing the TEM sample preparation and visualization.
Footnotes
Citation Bautista MA, Zhang C, Whitaker RJ. 2015. Virus-induced dormancy in the archaeon Sulfolobus islandicus. mBio 6(2):e02565-14. doi:10.1128/mBio.02565-14.
REFERENCES
- 1.Winter C, Bouvier T, Weinbauer MG, Thingstad TF. 2010. Trade-offs between competition and defense specialists among unicellular planktonic organisms: the “killing the winner” hypothesis revisited. Microbiol Mol Biol Rev 74:42–57. doi: 10.1128/MMBR.00034-09. [DOI] [PMC free article] [PubMed] [Google Scholar]
- 2.Brockhurst MA, Morgan AD, Fenton A, Buckling A. 2007. Experimental coevolution with bacteria and phage. Infect Genet Evol 7:547–552. doi: 10.1016/j.meegid.2007.01.005. [DOI] [PubMed] [Google Scholar]
- 3.Bohannan BJM, Lenski RE. 2000. Linking genetic change to community evolution: insights from studies of bacteria and bacteriophage. Ecol Lett 3:362–377. doi: 10.1046/j.1461-0248.2000.00161.x. [DOI] [Google Scholar]
- 4.Weitz JS, Hartman H, Levin SA. 2005. Coevolutionary arms races between bacteria and bacteriophage. Proc Natl Acad Sci U S A 102:9535–9540. doi: 10.1073/pnas.0504062102. [DOI] [PMC free article] [PubMed] [Google Scholar]
- 5.Våge S, Storesund JE, Thingstad TF. 2013. Adding a cost of resistance description extends the ability of virus-host model to explain observed patterns in structure and function of pelagic microbial communities. Environ Microbiol 15:1842–1852. doi: 10.1111/1462-2920.12077. [DOI] [PubMed] [Google Scholar]
- 6.Koskella B, Brockhurst MA. 2014. Bacteria–phage coevolution as a driver of ecological and evolutionary processes in microbial communities. FEMS Microbiol Rev 38:916–931. doi: 10.1111/1574-6976.12072. [DOI] [PMC free article] [PubMed] [Google Scholar]
- 7.Thingstad TF, Våge S, Storesund JE, Sandaa R-A, Giske J. 2014. A theoretical analysis of how strain-specific viruses can control microbial species diversity. Proc Natl Acad Sci U S A 111:7813–7818. doi: 10.1073/pnas.1400909111. [DOI] [PMC free article] [PubMed] [Google Scholar]
- 8.Rohwer F, Prangishvili D, Lindell D. 2009. Roles of viruses in the environment. Environ Microbiol 11:2771–2774. doi: 10.1111/j.1462-2920.2009.02101.x. [DOI] [PubMed] [Google Scholar]
- 9.Suttle CA. 2007. Marine viruses—major players in the global ecosystem. Nat Rev Microbiol 5:801–812. doi: 10.1038/nrmicro1750. [DOI] [PubMed] [Google Scholar]
- 10.Mojica KD, Brussaard CP. 2014. Factors affecting virus dynamics and microbial host-virus interactions in marine environments. FEMS Microbiol Ecol 89:495–515. doi: 10.1111/1574-6941.12343. [DOI] [PubMed] [Google Scholar]
- 11.Danovaro R, Corinaldesi C, Dell’Anno A, Fuhrman JA, Middelburg JJ, Noble RT, Suttle CA. 2011. Marine viruses and global climate change. FEMS Microbiol Rev 35:993–1034. doi: 10.1111/j.1574-6976.2010.00258.x. [DOI] [PubMed] [Google Scholar]
- 12.Wiedenheft B, Stedman K, Roberto F, Willits D, Gleske AK, Zoeller L, Snyder J, Douglas T, Young M. 2004. Comparative genomic analysis of hyperthermophilic archaeal Fuselloviridae viruses. J Virol 78:1954–1961. doi: 10.1128/JVI.78.4.1954-1961.2004. [DOI] [PMC free article] [PubMed] [Google Scholar]
- 13.Zhang C, Whitaker RJ. 2012. A broadly applicable gene knockout system for the thermoacidophilic archaeon Sulfolobus islandicus based on simvastatin selection. Microbiology 158:1513–1522. doi: 10.1099/mic.0.058289-0. [DOI] [PubMed] [Google Scholar]
- 14.Redder P, Peng X, Brügger K, Shah SA, Roesch F, Greve B, She Q, Schleper C, Forterre P, Garrett RA, Prangishvili D. 2009. Four newly isolated fuselloviruses from extreme geothermal environments reveal unusual morphologies and a possible interviral recombination mechanism. Environ Microbiol 11:2849–2862. doi: 10.1111/j.1462-2920.2009.02009.x. [DOI] [PubMed] [Google Scholar]
- 15.Schleper C, Kubo K, Zillig W. 1992. The particle SSV1 from the extremely thermophilic archaeon Sulfolobus is a virus: demonstration of infectivity and of transfection with viral DNA. Proc Natl Acad Sci U S A 89:7645–7649. doi: 10.1073/pnas.89.16.7645. [DOI] [PMC free article] [PubMed] [Google Scholar]
- 16.Fröls S, Gordon PM, Panlilio MA, Schleper C, Sensen CW. 2007. Elucidating the transcription cycle of the UV-inducible hyperthermophilic archaeal virus SSV1 by DNA microarrays. Virology 365:48–59. doi: 10.1016/j.virol.2007.03.033. [DOI] [PubMed] [Google Scholar]
- 17.Contursi P, Jensen S, Aucelli T, Rossi M, Bartolucci S, She Q. 2006. Characterization of the Sulfolobus host-SSV2 virus interaction. Extremophiles 10:615–627. doi: 10.1007/s00792-006-0017-2. [DOI] [PubMed] [Google Scholar]
- 18.Ren Y, She Q, Huang L. 2013. Transcriptomic analysis of the SSV2 infection of Sulfolobus solfataricus with and without the integrative plasmid pSSVi. Virology 441:126–134. doi: 10.1016/j.virol.2013.03.012. [DOI] [PubMed] [Google Scholar]
- 19.Zillig W, Kletzin A, Schleper C, Holz I, Janekovic D, Hain J, Lanzendörfer M, Kristjansson JK. 1993. Screening for Sulfolobales, their plasmids and their viruses in Icelandic solfataras. Syst Appl Microbiol 16:609–628. doi: 10.1016/S0723-2020(11)80333-4. [DOI] [Google Scholar]
- 20.Guo L, Brügger K, Liu C, Shah SA, Zheng H, Zhu Y, Wang S, Lillestøl RK, Chen L, Frank J, Prangishvili D, Paulin L, She Q, Huang L, Garrett RA. 2011. Genome analyses of Icelandic strains of Sulfolobus islandicus, model organisms for genetic and virus-host interaction studies. J Bacteriol 193:1672–1680. doi: 10.1128/JB.01487-10. [DOI] [PMC free article] [PubMed] [Google Scholar]
- 21.Zhang C, Krause DJ, Whitaker RJ. 2013. Sulfolobus islandicus: a model system for evolutionary genomics. Biochem Soc Trans 41:458–462. doi: 10.1042/BST20120338. [DOI] [PubMed] [Google Scholar]
- 22.Reno ML, Held NL, Fields CJ, Burke PV, Whitaker RJ. 2009. Biogeography of the Sulfolobus islandicus pan-genome. Proc Natl Acad Sci U S A 106:8605–8610. doi: 10.1073/pnas.0808945106. [DOI] [PMC free article] [PubMed] [Google Scholar]
- 23.Held NL, Herrera A, Cadillo-Quiroz H, Whitaker RJ. 2010. CRISPR associated diversity within a population of Sulfolobus islandicus. PLoS One 5:e12988. doi: 10.1371/journal.pone.0012988. [DOI] [PMC free article] [PubMed] [Google Scholar]
- 24.Whitaker RJ, Grogan DW, Taylor JW. 2003. Geographic barriers isolate endemic populations of hyperthermophilic archaea. Science 301:976–978. doi: 10.1126/science.1086909. [DOI] [PubMed] [Google Scholar]
- 25.Barrangou R, Fremaux C, Deveau H, Richards M, Boyaval P, Moineau S, Romero DA, Horvath P. 2007. CRISPR provides acquired resistance against viruses in prokaryotes. Science 315:1709–1712. doi: 10.1126/science.1138140. [DOI] [PubMed] [Google Scholar]
- 26.Makarova KS, Haft DH, Barrangou R, Brouns SJ, Charpentier E, Horvath P, Moineau S, Mojica FJ, Wolf YI, Yakunin AF, van der Oost J, Koonin EV. 2011. Evolution and classification of the CRISPR–Cas systems. Nat Rev Microbiol 9:467–477. doi: 10.1038/nrmicro2577. [DOI] [PMC free article] [PubMed] [Google Scholar]
- 27.Garrett RA, Shah SA, Vestergaard G, Deng L, Gudbergsdottir S, Kenchappa CS, Erdmann S, She Q. 2011. CRISPR-based immune systems of the Sulfolobales: complexity and diversity. Biochem Soc Trans 39:51–57. doi: 10.1042/BST0390051. [DOI] [PubMed] [Google Scholar]
- 28.Held NL, Whitaker RJ. 2009. Viral biogeography revealed by signatures in Sulfolobus islandicus genomes. Environ Microbiol 11:457–466. doi: 10.1111/j.1462-2920.2008.01784.x. [DOI] [PubMed] [Google Scholar]
- 29.Held NL, Herrera A, Whitaker RJ. 2013. Reassortment of CRISPR repeat-spacer loci in Sulfolobus islandicus. Environ Microbiol 15:3065–3076. doi: 10.1111/1462-2920.12146. [DOI] [PubMed] [Google Scholar]
- 30.Marraffini LA, Sontheimer EJ. 2010. Self versus non-self discrimination during CRISPR RNA-directed immunity. Nature 463:568–571. doi: 10.1038/nature08703. [DOI] [PMC free article] [PubMed] [Google Scholar]
- 31.Manica A, Zebec Z, Steinkellner J, Schleper C. 2013. Unexpectedly broad target recognition of the CRISPR-mediated virus defence system in the archaeon Sulfolobus solfataricus. Nucleic Acids Res 41:10509–10517. doi: 10.1093/nar/gkt767. [DOI] [PMC free article] [PubMed] [Google Scholar]
- 32.Van der Oost J, Westra ER, Jackson RN, Wiedenheft B. 2014. Unravelling the structural and mechanistic basis of CRISPR-Cas systems. Nat Rev Microbiol 12:479–492. doi: 10.1038/nrmicro3279. [DOI] [PMC free article] [PubMed] [Google Scholar]
- 33.Pearl S, Gabay C, Kishony R, Oppenheim A, Balaban NQ. 2008. Nongenetic individuality in the host–phage interaction. PLoS Biol 6:e120. doi: 10.1371/journal.pbio.0060120. [DOI] [PMC free article] [PubMed] [Google Scholar]
- 34.Tessier AJ, Cáceres CE. 2004. Differentiation in sex investment by clones and populations of Daphnia. Ecol Lett 7:695–703. doi: 10.1111/j.1461-0248.2004.00627.x. [DOI] [Google Scholar]
- 35.Cáceres CE, Tessier AJ. 2003. How long to rest: the ecology of optimal dormancy and environmental constraint. Ecology 84:1189–1198. doi: 10.1890/0012-9658(2003)084[1189:HLTRTE]2.0.CO;2. [DOI] [Google Scholar]
- 36.Lennon JT, Jones SE. 2011. Microbial seed banks: the ecological and evolutionary implications of dormancy. Nat Rev Microbiol 9:119–130. doi: 10.1038/nrmicro2504. [DOI] [PubMed] [Google Scholar]
- 37.Olofsson H, Ripa J, Jonzén N. 2009. Bet-hedging as an evolutionary game: the trade-off between egg size and number. Proc R Soc Lond B Biol Sci 276:2963–2969. doi: 10.1098/rspb.2009.0500. [DOI] [PMC free article] [PubMed] [Google Scholar]
- 38.Othmer HG, Adler FR, Lewis MA, Dallon JC (ed). 1997. Case studies in mathematical modeling: ecology, physiology, and cell biology. Prentice Hall, Upper Saddle River, NJ. [Google Scholar]
- 39.Prangishvili D. 2013. The wonderful world of archaeal viruses. Annu Rev Microbiol 67:565–585. doi: 10.1146/annurev-micro-092412-155633. [DOI] [PubMed] [Google Scholar]
- 40.Makarova KS, Anantharaman V, Aravind L, Koonin EV. 2012. Live virus-free or die: coupling of antivirus immunity and programmed suicide or dormancy in prokaryotes. Biol Direct 7:40. doi: 10.1186/1745-6150-7-40. [DOI] [PMC free article] [PubMed] [Google Scholar]
- 41.Lintner NG, Frankel KA, Tsutakawa SE, Alsbury DL, Copié V, Young MJ, Tainer JA, Lawrence CM. 2011. The structure of the CRISPR-associated protein Csa3 provides insight into the regulation of the CRISPR/Cas system. J Mol Biol 405:939–955. doi: 10.1016/j.jmb.2010.11.019. [DOI] [PMC free article] [PubMed] [Google Scholar]
- 42.Labrie SJ, Samson JE, Moineau S. 2010. Bacteriophage resistance mechanisms. Nat Rev Microbiol 8:317–327. doi: 10.1038/nrmicro2315. [DOI] [PubMed] [Google Scholar]
- 43.Sokoloski KJ, Snyder AJ, Liu NH, Hayes CA, Mukhopadhyay S, Hardy RW. 2013. Encapsidation of host-derived factors correlates with enhanced infectivity of Sindbis virus. J Virol 87:12216–12226. doi: 10.1128/JVI.02437-13. [DOI] [PMC free article] [PubMed] [Google Scholar]
- 44.Duhaime MB, Deng L, Poulos BT, Sullivan MB. 2012. Towards quantitative metagenomics of wild viruses and other ultra-low concentration DNA samples: a rigorous assessment and optimization of the linker amplification method. Environ Microbiol 14:2526–2537. doi: 10.1111/j.1462-2920.2012.02791.x. [DOI] [PMC free article] [PubMed] [Google Scholar]
- 45.Deng L, Ignacio-Espinoza JC, Gregory AC, Poulos BT, Weitz JS, Hugenholtz P, Sullivan MB. 2014. Viral tagging reveals discrete populations in Synechococcus viral genome sequence space. Nature 513:242–245. doi: 10.1038/nature13459. [DOI] [PubMed] [Google Scholar]
- 46.Sullivan MB, Waterbury JB, Chisholm SW. 2003. Cyanophages infecting the oceanic cyanobacterium Prochlorococcus. Nature 424:1047–1051. doi: 10.1038/nature01929. [DOI] [PubMed] [Google Scholar]
- 47.Suttle CA, Chan AM. 1994. Dynamics and distribution of cyanophages and their effect on marine Synechococcus spp. Appl Environ Microbiol 60:3167–3174. [DOI] [PMC free article] [PubMed] [Google Scholar]
- 48.Pagarete A, Chow C-ET, Johannessen T, Fuhrman JA, Thingstad TF, Sandaa RA. 2013. Strong seasonality and interannual recurrence in marine myovirus communities. Appl Environ Microbiol 79:6253–6259. doi: 10.1128/AEM.01075-13. [DOI] [PMC free article] [PubMed] [Google Scholar]
- 49.Sharon I, Battchikova N, Aro E-M, Giglione C, Meinnel T, Glaser F, Pinter RY, Breitbart M, Rohwer F, Béjà O. 2011. Comparative metagenomics of microbial traits within oceanic viral communities. ISME J 5:1178–1190. doi: 10.1038/ismej.2011.2. [DOI] [PMC free article] [PubMed] [Google Scholar]
- 50.Childs LM, Held NL, Young MJ, Whitaker RJ, Weitz JS. 2012. Multiscale model of CRISPR-induced coevolutionary dynamics: diversification at the interface of Lamarck and Darwin. Evolution 66:2015–2029. doi: 10.1111/j.1558-5646.2012.01595.x. [DOI] [PMC free article] [PubMed] [Google Scholar]
- 51.Parsons RJ, Breitbart M, Lomas MW, Carlson CA. 2012. Ocean time-series reveals recurring seasonal patterns of virioplankton dynamics in the northwestern Sargasso Sea. ISME J 6:273–284. doi: 10.1038/ismej.2011.101. [DOI] [PMC free article] [PubMed] [Google Scholar]
- 52.Dutilh BE, Cassman N, McNair K, Sanchez SE, Silva GGZ, Boling L, Barr JJ, Speth DR, Seguritan V, Aziz RK, Felts B, Dinsdale EA, Mokili JL, Edwards RA. 2014. A highly abundant bacteriophage discovered in the unknown sequences of human faecal metagenomes. Nat Commun 5:4498. [DOI] [PMC free article] [PubMed] [Google Scholar]
- 53.Våge S, Storesund JE, Thingstad TF. 2013. SAR11 viruses and defensive host strains. Nature 499:E3–E4. doi: 10.1038/nature12387. [DOI] [PubMed] [Google Scholar]
- 54.Lewis K. 2007. Persister cells, dormancy and infectious disease. Nat Rev Microbiol 5:48–56. doi: 10.1038/nrmicro1557. [DOI] [PubMed] [Google Scholar]
- 55.Deatherage DE, Barrick JE. 2014. Identification of mutations in laboratory-evolved microbes from next-generation sequencing data using Breseq, p 165–188. In Sun L, Shou W (ed), Engineering and analyzing multicellular systems. Springer, New York, NY. [DOI] [PMC free article] [PubMed] [Google Scholar]
- 56.Deng L, Zhu H, Chen Z, Liang YX, She Q. 2009. Unmarked gene deletion and host–vector system for the hyperthermophilic crenarchaeon Sulfolobus islandicus. Extremophiles 13:735–746. doi: 10.1007/s00792-009-0254-2. [DOI] [PubMed] [Google Scholar]
- 57.Brock TD, Brock KM, Belly RT, Weiss RL. 1972. Sulfolobus: a new genus of sulfur-oxidizing bacteria living at low pH and high temperature. Archiv Mikrobiol 84:54–68. doi: 10.1007/BF00408082. [DOI] [PubMed] [Google Scholar]
- 58.Clokie MRJ, Kropinski A (ed). 2009. Bacteriophages: methods and protocols, vol. 1 Humana Press, New York, NY. [Google Scholar]
- 59.Cadillo-Quiroz H, Didelot X, Held NL, Herrera A, Darling A, Reno ML, Krause DJ, Whitaker RJ. 21 February 2012. Patterns of gene flow define species of thermophilic archaea. PLoS Biol 10(2):e1001265. doi: 10.1371/journal.pbio.1001265. [DOI] [PMC free article] [PubMed] [Google Scholar]
Associated Data
This section collects any data citations, data availability statements, or supplementary materials included in this article.
Supplementary Materials
Adsorption dynamics of SSV9 on RJW002. Decrease of free SSV9 infectious particles in the medium after the addition of host RJW002, nonhost Sulfolobus acidocaldarius, and virus alone. Dashed line indicates values used for the final titer in the adsorption rate constant calculation. Lines and error bars show mean results ± 1 standard deviation (SD) (n = 3). Download
SSV9 can replicate in CRISPR-Cas-deficient cultures, but infection is cleared in immune cultures. (a) SSV9 genome abundance was determined by qPCR of infected cultures. (b and c) Virus decay was measured by determining infectious particles (b) and by SSV9 genome abundance in flasks with no cells added (c). Dashed lines indicate detection limit of each technique. Data points below the dashed line denote that no signal was detected. Lines and error bars show mean results ± 1 SD (n = 3). Download
Challenge of CRISPR-mediated immune cultures with SSV9 induces dormancy. Results from two additional independent experiments show growth of SSV9-challenged cultures. Solid lines represent the average results from at least two technical replicates within each experiment. Lines and error bars show mean results ± 1 SD. Download
Dormant cells are observed in immune and immune-deficient cultures after challenge with SSV9. (a) Dormant (empty) cells are observed in cultures of RJW002 and the Δcas6 mutant in the first 48 hpi, but RJW002 cultures recover by 72 hpi. (b) Representative low-magnification images of SSV9-challenged RJW002 and the Δcas6 mutant at 48 hpi, where the majority of cells look dormant (empty). Download
Sulfolobus islandicus strains used in this study.
Plasmids and viruses used in this study.
Primers used in this study. aAdded restriction sites are underlined.
Unique mutations present in the immune-deficient (ΔA1, Δcas3, and Δcas6) strains. Gray boxes denote genes or loci that were intended for deletion. Boldface font denotes nonsynonymous mutations or deletions and duplications in coding regions. CR, mutation within the CRISPR-Cas region of the chromosome, including the type I and type III systems in RJW002. This region spans positions 823,400 to 872,588 of the Sulfolobus islandicus M.16.4 chromosome (see Table S1).