

ABSTRACT
The Epstein-Barr virus protein latent membrane protein 1 (LMP1) has two NF-κB activating domains within its intracellular carboxy terminus (carboxy-terminal activating region 1 [CTAR1] and CTAR2). LMP1-CTAR1 is required for B-lymphocyte transformation, is capable of transforming rodent fibroblasts, and uniquely activates phosphoinositol (PI3) kinase, the noncanonical NF-κB pathway, and expression of the epidermal growth factor receptor (EGFR). In this study, the effects of LMP1-CTAR1 on cellular gene expression were determined by high-throughput sequencing. Additionally, the binding of bcl3 was determined using chromatin immunoprecipitation (ChIP) and sequencing. LMP1-CTAR1 induced few changes in transcription with more genes showing decreased expression. Ingenuity pathway analysis indicated significant enrichment for genes involved in cancer and cellular movement, survival, growth, and proliferation pathways. ChIP in combination with high-throughput sequencing (ChIP-Seq) identified bcl3 binding for more than 2,000 genes in LMP1-CTAR1-expressing cells with more than 90% of the peaks at genes detected within the probable promoter region. Only a small subset of the genes with significant changes in expression had corresponding peaks in the bcl3 ChIP. However, both NFKB2 and PI3 kinase were identified in the bcl3 ChIP. Additionally, many of the predicted upstream regulators for the changes in expression were identified in the bcl3 ChIP. Analysis of the proteins in the NF-κB pathway revealed many changes identified by the high-throughput RNA sequencing (RNA-Seq) and bcl3 ChIP that would likely activate noncanonical NF-κB signaling and possibly inhibit canonical NF-κB signaling. These findings suggest that the two LMP1 signaling domains modulate their combined activity and that the bcl3 transcription factor is likely responsible for some of the unique effects of CTAR1 on cellular expression.
IMPORTANCE
The Epstein-Barr virus protein latent membrane protein 1 (LMP1) has potent effects on cell growth. LMP1 has two regions, carboxy-terminal activating region 1 (CTAR1) and CTAR2, that distinctly activate NF-κB, a transcription factor complex involved in activation of important host genes. In this study, analysis of the effects on cellular gene expression revealed that CTAR1 significantly affected cellular expression in part through effects on a specific form of NF-κB. The data suggest that LMP1 can activate a distinct subset of host gene expression through its CTAR1 domain which in combination with other signaling effects induced by the CTAR2 domain likely affects cell movement, survival, and growth.
INTRODUCTION
The Epstein-Barr virus (EBV) infects both lymphoid and epithelial cells and is associated with distinct malignancies that develop in both cell types (1). EBV is consistently detected within all cells of the major malignancy nasopharyngeal carcinoma (NPC), and the viral oncoprotein latent membrane protein 1 (LMP1) is frequently expressed (2). LMP1 has profound effects on gene expression through its effects on multiple signaling pathways (3). It is considered a member of the tumor necrosis factor receptor (TNFR) family and interacts with TNFR-associated factors (TRAFs) to constitutively activate NF-κB, Jun N-terminal protein kinase (JNK), and phosphoinositol kinase (PI3K) (4, 5). LMP1 is required for B-cell transformation (6).
LMP1 has two domains that both activate NF-κB, carboxy-terminal activating domains 1 and 2 (CTAR1 and CTAR2) (7). LMP1-CTAR1 is sufficient for fibroblast transformation, while CTAR2 is dispensable (5, 6). CTAR1 also uniquely induces expression of several cellular genes, including the epidermal growth factor receptor (EGFR), TRAF1, ICAM1, and EBI3 (8, 9). Activation of NF-κB is complex and has two primary pathways that mediate activation. The canonical pathway is regulated by the IκB kinase (IKK) complex that consists of IKKα, IKKβ, and IKKχ (also called NEMO) (10). This complex phosphorylates the inhibitor of NF-κB, IkBα, that is sequestered in the cytoplasm. This phosphorylation induces IkBα degradation and results in the release of dimers of p50 with p65 (RelA). The noncanonical pathway is thought to be largely regulated by NIK which phosphorylates and activates the IKKα kinase, leading to the processing of the p100 precursor to p52 which then associates with RelB to bind and activate transcription (11). LMP1-CTAR2 has the strongest NF-κB activation properties in reporter assays, while CTAR1 uniquely activates noncanonical NF-κB signaling and strongly induces the processing of p100 to p52 (12–14).
The effect of activation of NF-κB by LMP1 has been particularly informative in the C33 cell line. This cell line has very low levels of endogenous NF-κB activity, and expression of LMP1 in C33 cells revealed that LMP1 induced multiple distinct NF-κB forms using electrophoretic mobility shift assays (EMSA) including abundant p50 dimers, p50/p52 dimers, and p65 (12, 15). Additionally, LMP1-CTAR1 induced high levels of expression of the epidermal growth factor receptor in C33 cells, and studies using chromatin immunoprecipitation (ChIP) indicated that CTAR1 induced a complex containing p50 dimers and the transactivator bcl3 on the EGFR promoter (8, 16). These effects are mediated in part through the increased expression of bcl3 that is induced by CTAR1 through effects on Stat3 (17). Stat3 is phosphorylated on both tyrosine and serine; however, previous studies using ChIP and an antibody to phosphorylated Ser474 detected Stat3 on the BCL3 promoter and within a BCL3 intron (17). Importantly, a recent study has indicated that p50/bcl3 is the major form of NF-κB detected in NPC (18).
In the study reported here, the unique effects of LMP1-CTAR1 on cellular gene expression were further analyzed using mRNA sequencing. Additionally, the binding of bcl3, p50, and phosphorylated Stat3 (pStat3) was determined using ChIP in combination with high-throughput sequencing (ChIP-Seq). More than 13,000 genes were identified by high-throughput RNA sequencing (RNA-Seq) with a read per kilobase per million (RPKM) of >0.1. Ingenuity pathway analysis of the genes that were changed more than 2-fold revealed significant enrichment for genes involved in cancer and pathways related to cellular movement, survival, growth, and proliferation and cell-to-cell signaling. Multiple components that regulate the NF-κB pathway were affected. ChIP-Seq identified CTAR1-specific bcl3 binding for more than 1,000 genes with approximately 90% of the peaks detected within the probable promoter region. Analysis of the genes identified by the bcl3 ChIP indicated that many of the genes contributed to regulation of the integrin signaling, protein ubiquitination, epithelial mesenchymal transition pathways, extracellular signal-regulated kinase (ERK)/mitogen-activated protein kinase (MAPK) pathway, and the stat3 pathway. Interestingly, TRAF1, ID proteins, NFKB1, and NFKB2 were identified in the bcl3 ChIP, confirming that some of the unique effects of CTAR1 on cellular gene expression are mediated by this important NF-κB member.
RESULTS
Identification of LMP1-CTAR1 effects on expression.
The effect of LMP1-CTAR1 on cellular gene expression in C33 cells has been previously analyzed using expression microarray analysis (19). This approach revealed few changes in gene expression greater than 2-fold and did not identify the EGFR, although EGFR transcription was determined to be increased 8-fold using quantitative PCR and 20-fold by RNase protection. To identify other changes using current, more-sensitive technology, total RNA was prepared from three preparations of C33 cells expressing LMP1-CTAR1 or the pBabe vector control. The RNA was used to prepare 6 cDNA libraries that were bar coded and pair end sequenced. The sequences were aligned to the human genome (hg19) using the TOPHAT program in the Galaxy suite. Aligned reads were mapped to more than 23,000 cellular genes using the Partek Genomics Suite. Of the 13,292 genes with expression greater than 0.1 reads per million per kilobase (RPMK), 120 were increased ≥2-fold with a P of <0.05, while 244 were increased ≥1.5-fold. Decreased expression was identified with 211 genes changed ≥2-fold and 280 genes decreased ≥1.5-fold. Changes in expression were compared to other studies that analyzed the effects of LMP1 on cellular expression or analyzed cellular expression in LMP1-positive or -negative NPC samples (see Table S1 in the supplemental material) (19–27). Multiple genes that have been previously shown to be decreased by array analysis in other systems had significantly decreased expression in the presence of LMP1-CTAR1 including TNF superfamily member 10 (TNFSF10) (−44-fold), glycoprotein M6A (GPM6A) (−13-fold), laminin α1 (LAMA1) (−12-fold), actin binding LIM protein 1 (ABLIM1) (−5-fold), and TNFR superfamily 19 (TNFRSF19) (−4.6-fold) (Table S1). Previously identified genes with increased expression included BIRC3 (cIAP2) (+182-fold), ENPP2 (+47-fold), EGFR (+9-fold), RGS2 (+8.5-fold), NFKB2 p100 (+6.6-fold), the ephrin receptor B1 (EPHB1) (+4.7-fold), NFKBIA (IκBα) (+4.5-fold), RELB (+3-fold), and NFKBIZ (+2.9-fold) (Table S1). The significantly increased expression of NFKB2 and RELB suggests that LMP1 activates the noncanonical pathway not only through inducing the processing of p100, but also through effects on the expression of p100 and RELB.
Ingenuity pathway analysis (IPA) of all genes changed 2-fold with significant P values of <0.05 identified cancer as the most significant disease or disorder with cellular proliferation, cellular movement, and cell signaling pathways predicted to be activated (Table 1). IPA predicted cell death/apoptosis of tumor cells and cellular protrusions to be negatively regulated. These functions had activation z scores where the absolute value greater than 2 is considered highly statistically significant. IPA analysis also indicated that the affected targets could represent potential activation of multiple pathways. Canonical pathways that were statistically significant included inhibition of matrix metalloproteases, death receptor signaling, caveolar mediated endocytosis, HIF1α signaling, TNF signaling, NF-κB, and PTEN signaling (Fig. 1). Not unexpectedly considering LMP1 is a constitutively activated member of the TNF receptor family, both TNFR1 and TNFR2 were identified as canonical pathways (4). Activation of the HIF1α pathway has previously been shown to be activated by LMP1 and the genes identified as CTAR1-specific targets in the HIF1α pathway included MMP3, MMP14, MMP10, and caveolin (28).
TABLE 1 .
Disease and function analysis of 2-fold significantly changed genes by RNA-Seq
| Category | Disease and function | P value | Activation z score and predicted activation | Genes |
|---|---|---|---|---|
| Cancer | Cancer | 5.16E−12 | −0.231 | ABLIM1, ACTA2, ACTL8, ADAMTS1, ADAMTS3, ADAMTSL3, ADM, ALCAM, ALDH1A1, ANGPT1, ANPEP, ANXA1, APOBEC3B, ARAP2, AREG, ARHGAP18, ASXL3, ATP2B4, B3GAT1, BAMBI, BICC1, BIRC3, C11orf63, C1QTNF9B-AS1, CADM1, CAV1, CD36, CDC20B, CDCA7L, CDH19, CHRDL1, CILP2, CNTFR, COL3A1, COL9A2, COTL1, CPA6, CPED1, CRAT, CRIP1, CSAG4, CXorf57, CYLD, DACH2, DCP1B, DDX58, DDX60L, DGAT2, DIRAS3, DKK1, DLX6, DMD, DNM3, DPPA2, DSEL, DSG2, EFHD2, EGFR, EGLN3, EMB, EMP2, ENPP2, EPHA5, EPHA8, EPHB1, EPHX2, ERAP2, FANK1, FAT3, FBXL7, FBXO8, FERMT1, FES, FGF12, FXYD5, FZD1, GAGE1, GAGE13, GALNT14, GAP43, GAS1, GBE1, GCNT4, GLI1, GLRX2, GMPR, GNAL, GNAO1, GNMT, GPM6A, GPR37, GPRC5A, GRB10, GREM1, GRPR, HHIP, HMX2, HORMAD1, HOXA5, HOXB6, HPGD, HRASLS, HSPB6, IFIH1, INPP1, IQCA1, ITGAV, ITGB8, JAG1, JAM2, KCNJ8, KCNK1, KIRREL, KITLG, KLHDC8A, LAMA1, LGALS3, LGI2, LPCAT2, LRRC4B, LRRCC1, MACC1, MAGEA1, MAGEA12, MAP2, MDFI, MET, MFAP5, MLKL, MMP10, MMP14, MMP3, MYOF, NAV1, NCAM2, NFKB2, NFKBIA, NID1, NMBR, NPFFR2, NPTX1, NPW, NRCAM, NRIP1, NTRK3, OLFM1, OSR1, OTOL1, PAPLN, PAPSS2, PARP8, PCDHB5, PDE1A, PDGFRA, PDPN, PI15, PKD1L1, PLK2, PLXDC2, PMAIP1, PREX2, PROK2, PRRG1, PRRX1, PSMB9, PTGS2, PTPRD, PVRL3, RALYL, RARB, RBP1, RDH10, RELB, RGS2, RGS5, RNF128, RNF217, ROR1, RORB, S100A10, S100A2, SCG2, SDPR, SERPINE2, SERPING1, SERTAD4, SGCG, SGK1, SHH, SKAP1, SLAIN1, SLC1A6, SLC38A4, SLC7A7, SLC9A2, SLIT2, SLITRK1, SLITRK6, SNX7, SORL1, SPRY4, SSPN, STK32B, SULF2, TEK, TENM1, TEX14, TFPI, TFPI2, THRB, TIMP3, TMC1, TMC4, TMX4, TNFRSF19, TNFSF10, TOM1L2, TP53AIP1, TRIB2, TSNAXIP1, TTBK1, TWISTNB, USP44, VASH2, VGLL3, VSTM2L, VSTM4, WLS, ZFP28, ZFPM2, ZNF160, ZNF222, ZNF28, ZNF329, ZNF462, ZNF468, ZNF471, ZNF600, ZNF606, ZNF611, ZNF667, ZNF781, ZNF788, ZNF804A, ZSCAN18 |
| Cellular development, cellular growth and proliferation | Proliferation of tumor cell lines | 4.00E−04 | 2.472 Increase | ADAMTS1, ADM, ALCAM, ALDH1A1, ANXA1, AREG, B3GAT1, C1QTNF9B-AS1, CAV1, DDX58, DIRAS3, DKK1, EGFR, FES, GAP43, GLI1, GNMT, HMX2, HPGD, HSPB6, ITGAV, ITGB8, JAG1, KITLG, LGALS3, MET, MMP14, NFKBIA, NRIP1, NTRK3, PDGFRA, PTGS2, RARB, RELB, ROR1, S100A10, SGK1, SHH, TEK, TFPI2, THRB, TIMP3, TNFSF10, TP53AIP1, TRIB2, VASH2 |
| Cellular movement | Invasion of epithelial cell lines | 1.62E−04 | 2.213 Increase | AREG, EGFR, GLI1, NFKBIA, PTGS2 |
| Cell signaling | Cell surface receptor-linked signal transduction | 3.59E−04 | 2.207 Increase | ADAMTS1, ANGPT1, CAV1, COL3A1, GAS1, GLI1, HHIP, ITGAV, PRRX1, PTPRD, SERPINE2, SHH, TEK |
| Cell death and survival | Apoptosis of tumor cell lines | 4.56E−05 | −2.575 Decrease | ADM, ALCAM, ANKRD1, AREG, BIRC3, CAV1, CYLD, DDX58, DIRAS3, DKK1, DSG2, EGFR, GAS1, GLI1, GRB10, HOXA5, ITGAV, JAG1, KITLG, LGALS3, MET, MMP14, NFKB2, NFKBIA, NFKBIZ, NTRK3, PLK2, PMAIP1, PTGS2, RARB, RELB, ROR1, SEMA3A, SGK1, SH3RF1, SHH, SULF2, TIMP3, TNFRSF6B, TNFSF10, TP53AIP1, VASH2 |
| Cell morphology, cellular assembly and organization | Formation of cellular protrusions | 3.01E−07 | −2.212 Decrease | ANPEP, AREG, CAV1, CRIP1, DNM3, EGFR, EPHA8, EPHB1, FES, GAP43, GNAO1, GPM6A, ITGB8, KITLG, LAMA1, LRRC16A, MAP2, MET, NFKBIA, NRCAM, NTRK3, PDGFRA, PDPN, PREX2, PVRL3, RELB, ROR1, SEMA3A, SGK1, SHH, SLIT2, SLITRK1, SLITRK6, SULF2, TEX14, TNFRSF6B |
FIG 1 .

Canonical pathways associated with genes with 2-fold expression change by RNA-Seq in CTAR1-expressing C33a cells. Significant canonical pathways determined by IPA analysis of the genes with 2-fold change in expression by RNA-Seq in the CTAR1-expressing cells are shown. The height of the bars reflects the P value, and the orange boxes reflect the ratio of the number of genes in the data set that are represented in the pathway.
IPA was also employed to identify genes that would likely regulate the genes shown to be affected by CTAR1. Genes identified as potential upstream regulators for genes changed 1.5-fold in transcription included TNF (P value = 1.89E−24), but also included CHUK (IKKα), TRAF2, and glutathione synthase 3β (GSK3B) which are predicted to be activated, and MAP3K7 (TAK1) which is predicted to be inhibited (Table 2). The significant z score for CHUK (IKKα) likely reflects its critical role in activation of the noncanonical NF-κB pathway. Interestingly, CD40 was also identified as a likely activated upstream regulator. CD40 and LMP1 are thought to be closely related, as both bind the same TRAF molecules and LMP1 can partially substitute for CD40 loss in genetically engineered mice (29, 30). Other NF-κB family members, NFKB1 p105, MAP3K14 (NIK), NFKBIA (IκBα), and NFKB2 p100 were also identified as possible upstream regulators with less significant z scores. Additional potential upstream regulators with highly significant P values, indicative of considerable overlap with genes in the target data set, included HRAS, STAT3, CTNNB1 (β-catenin), PTEN, EGR1, PIK3R1, MAP3K1 (MEK), MAPK1 (ERK2), VEGFA, ID1, TRAF3, ERBB4, PRKCδ, and JUNB. Activations of STAT3, ERK, and PI3 kinase have been previously shown to be induced by LMP1-CTAR1 (5, 31, 32). LMP1-CTAR1 also binds TRAF3 and increases expression of ID1. These data strengthen our current understanding of LMP1 signaling and additionally identify potential targets that are affected by LMP1-CTAR1. LMP1 has been suggested to modulate β-catenin, and this analysis identifies multiple other proteins that are regulated similarly to β-catenin through potential effects on GSK3B, in addition to many genes regulated by β-catenin (33, 34) (Table 2).
TABLE 2 .
Predicted upstream regulators of genes with 1.5-fold expression change in CTAR1-expressing cells
| Upstream regulator | Predicted activation state | z score | P value of overlap | Target molecules in data set |
|---|---|---|---|---|
| MAP3K7 (TAK1)a | Inhibited | −2.14 | 3.09E−05 | BIRC3, CH25H, IFIH1, ITGB1, MMP3, PTGS2, RGS2, TNFSF10, VHL |
| TNFb | Activated | 2.04 | 1.89E−24 | ADM, ALCAM, AMH, ANGPT1, ANPEP, ANXA1, APLN, APOBEC3B, ATP2A2, BIRC2, BIRC3, BTG2, CAT, CAV1, CCND2, CD36, CDKN2A, CDKN2C, CEBPA, CEBPB, CH25H, COL3A1, COTL1, CSF1, CTNNB1, CYBA, CYLD, CYR61, DAG1, DDX58, DKK1, DMD, EGFR, EGR1, EMP2, ENPP2, FERMT1, FGFR1, GNAI1, GPR176, HPGD, ID1, IFIH1, IGFBP2, IGFBP4, IL1R1, IL4R, ITGAV, ITGB1, JAG1, JUNB, KITLG, KLF5, KLF6, LGALS3, LRP6, MET, MIF, MMP10, MMP14, MMP3, NEFH, NFKB1, NFKB2, NFKBIZ, NID1, NME1, NRIP1, PDGFRA, PDPN, PDX1, PHLDA1, PLK2, PMAIP1, PROK2, PSMB9, PTEN, PTGS2, RASD1, RBP1, RELB, RGS2, RGS5, ROBO1, SDC4, SERPINE2, SGK1, SHH, SIRT1, SNAI1, SOCS1, SOD2, SP3, STAT1, TAPBP, TEK, TFPI, TFPI2, TIMP3, TJP1, TNFRSF6B, TNFSF10, TRAF2, TRAF3, TRAF6, VEGFA, VEGFC, VIM, WLS, WTAP, YY1 |
| CHUK (IKKα)b | Activated | 2.08 | 8.20E−07 | CEBPB, CH25H, COL18A1, CSF1, CYBA, ENPP2, JUNB, KLF5, MFAP5, MMP3, NFKB2, NID1, PTGS2, RBP1, RELB, SERPINE2, SGK1, VEGFA, VEGFC |
| TRAF2a | Activated | 2.36 | 2.70E−06 | ADM, BIRC2, BIRC3, CDKN2A, CYLD, EGFR, ITGB1, LRRC16A, NFKB1, PLBD1, TRAF2 |
| GSK3Ba | Activated | 2.45 | 8.34E−06 | ATP2A2, BIRC2, BIRC3, CTNNB1, GLI1, NFKBIZ, PDX1, PTGS2, SNAI1, SYN1, TNFSF10 |
| CD40b | Activated | 2.02 | 3.22E−07 | ANPEP, BIRC3, CCND2, CSF1, IL4R, ITGB1, LGALS3, MET, MMP14, MMP3, NEFH, NFKB1, NFKB2, PSMB9, PTGS2, TAPBP, TNFSF10, TP53AIP1, TRAF2, VEGFA |
| NFKB1c | 1.64 | 8.82E−09 | ANKRD1, BIRC3, BTG2, CCND2, CSF1, EGFR, EGR1, ENPP2, GNAO1, JAG1, MMP10, MMP3, NFKB1, NFKB2, NMI, PTGS2, RELB, SDC4, SOD2, STAT1, TNFSF10, TRAF2, VEGFA | |
| MAP3K14 (NIK)b | 1.59 | 3.09E−05 | BIRC3, EGFR, NFKB1, PTEN, PTGS2, RELB, TNFSF10, TRAF3, YAP1 | |
| NFKBIA (IκBα)a | 1.14 | 4.71E−18 | ANKRD1, BIRC2, BIRC3, BTG2, CCND2, CEBPB, CH25H, COL3A1, COL5A2, CSF1, CTNNB1, CYBA, DAG1, EIF4G2, ENPP2, ERAP2, GPR176, HMGA1, HOXB8, ITGB1, JUNB, KLF5, KRT18, MMP14, MMP3, NFKB1, NFKB2, NID1, PIK3R1, PTEN, PTGS2, RBP1, RELB, SDC4, SERPINE2, SGK1, SHH, SMAD4, SOD2, SORL1, TIMP3, TNFRSF10A, TNFSF10, TRAF2, VEGFA, VEGFC, WBP5, YAP1 | |
| NFKB2a | 4.18E−02 | BIRC3, NFKB2, PTGS2, SOD2 | ||
| HRASc | 0.61 | 3.19E−16 | ADM, AREG, ATP2A2, BTG2, CAV1, CCND2, CDKN2A, CDKN2B, CEBPB, COL18A1, COL3A1, COL5A2, CSF1, CTNNB1, EGFR, EGR1, EIF2D, FERMT2, FZD1, HNRNPA2B1, HOXB6, HRAS, HRASLS, IGFBP4, ITGAV, ITGB1, JUNB, KLF5, KRT18, MET, MMP14, MMP3, NID1, PDGFRA, PSMB9, PTEN, PTGS2, RARB, SERPINE2, SH3RF1, SIRPA, SMAD4, SNAI1, SOX5, SP3, SYN1, TIMP3, TNFRSF10A, TOM1, VEGFA, VIM, YAP1 | |
| STAT3b | 0.18 | 5.14E−09 | ADM, AREG, CAT, CCND2, CDKN2A, CEBPA, CEBPB, COL3A1, EGR1, FERMT2, IFIH1, IL1R1, IL4R, JAG1, JUNB, MMP3, NFKB1, PEG10, PHLDA1, PMAIP1, PROK2, PSMB9, PTGS2, SERPINE2, SGK1, SHH, SNAI1, SOCS1, SOD2, STAT1, TFPI2, TNFSF10, VEGFA, VIM | |
| CTNNB1 (β-catenin)c,d | 0.15 | 1.29E−12 | ACTA2, ALCAM, ALDH1A1, ANXA1, BAMBI, CCND2, CDKN2A, CDKN2B, COL27A1, CRAT, CRIP1, CTNNB1, CYR61, DKK1, EGFR, EPHA5, FGF20, FLOT2, GAP43, GLI1, GNAO1, GREM1, HHIP, HOXA5, IGFBP2, IL1R1, ISL1, ITGB1, KLF5, LGALS3, MMP14, MMP3, NPTX1, NRCAM, POLR2A, POLR2E, PTGS2, SERPINE2, SGK1, SHH, SNAI1, SOX5, TIMP3, TJP1, VEGFA, VIM, YAP1 | |
| PTENc,d | −1.06 | 5.28E−09 | ADM, ANGPT1, ANXA1, BTG2, CA12, CDK10, CDKN2A, CDKN2B, CTNNB1, DEGS1, EGFR, FES, IGFBP2, IL4R, JAG1, KLF5, KLF6, LGALS3, MET, MMP14, MMP3, NFKB1, PIK3R1, PTEN, PTGS2, SDC4, SHH, SMAD4, SMARCA4, TNFSF10, TOM1, VEGFA, VEGFC | |
| EGR1c | 1.68 | 2.15E−08 | ATP2A2, CAV1, CCND2, CSF1, EGFR, EGR1, JUNB, MMP14, NFKB1, PDX1, PTEN, PTGS2, SGK1, SNAI1, SOCS1, SOD2, SYN1, TNFSF10, VEGFA | |
| PIK3R1c,d | −0.05 | 3.51E−05 | CCND2, PDGFRA, PDX1, PIK3R1, PTEN, PTGS2, SOD2, VEGFA, VEGFC | |
| MAP3K1 (MEK)a | 1.19 | 3.96E−04 | BIRC2, BIRC3, COL3A1, EGR1, MMP3, PTGS2, TNFRSF10A | |
| MAPK1 (ERK2)a | −0.58 | 8.90E−07 | ANPEP, APOL6, CAV1, CTNNB1, DDX58, EGLN3, EGR1, FES, IFIH1, ITGAV, JUNB, L3MBTL1, LGALS3, NMI, PAQR6, PSMB9, PTGS2, SIRT1, SNAI1, SPRY4, STAT1, TJP1, TMEM158, TNFSF10, VIM | |
| VEGFAc | −1.90 | 7.38E−07 | ADAMTS1, ANPEP, CAV1, CDKN2A, CYB5B, CYR61, EGR1, ETS2, FGFR1, GRB10, ID1, IGFBP4, ITGB1, JUNB, NME1, PTGS2, SOD2, TEK, TFPI2, VEGFA | |
| ID1c,d | −1.49 | 8.83E−04 | BMI1, CDKN2A, EGR1, MMP14, SNAI1, VIM | |
| TRAF3b | −0.86 | 4.22E−05 | ADM, BIRC3, EGFR, LRRC16A, MET, NFKB2, NFKBIA, PLBD1, RELB | |
| ERBB4c | 1.39 | 3.11E−09 | ACTA2, BTG2, CADM1, COL3A1, COL5A2, CTNNB1, EGFR, EGR1, ERBB4, GAP43, IGFBP4, NID1, PTGS2, SERPINE2, TIMP3 | |
| PRKCDb | 1.17 | 1.08E−04 | BIRC2, BIRC3, CEBPB, GLI1, JUNB, KLF5, NFKB2, PTGS2, RELB, VEGFA | |
| JUNBc,d | 0.82 | 2.40E−03 | CAV1, CDKN2A, ITGAV, JUNB, MMP10, MMP3, RELB, SGK1, SNAI1 |
ChIPed by bcl3 in CT1-expressing cells with a FDR of >10.
Not ChIPed by bcl3 in CT1-expressing cells.
ChIPed by bcl3 in CT1-expressing cells with FDR of <10.
bcl3 peak overlaps ENCODE bcl3 peak.
Chromatin immunoprecipitation and sequence alignment.
Based on the considerable induction of EGFR in C33 cells and the identification of p50 and bcl3 bound to the EGFR promoter and the induction of bcl3 by activated Stat3, additional binding sites for bcl3, p50, or pStat3, were mapped using ChIP-Seq (16, 17). Chromatin immunoprecipitation (ChIP) was performed from two biological replicates of C33 cells expressing CTAR1 using antibodies to p50, bcl3, and pStat3. Previously known binding sites within the EGFR promoter were precipitated with the p50 and bcl3 antibodies and from sites in the introns of BCL3 for pStat3 (Fig. 2).
FIG 2 .
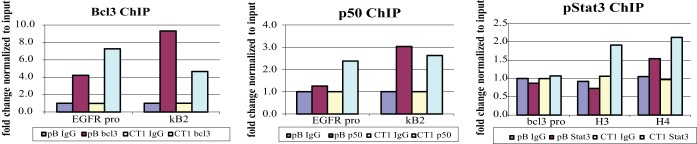
Quantitative PCR of known binding sites of the transcription factors on chromatin. To confirm the success of the ChIP, the sample chromatin from the pBabe (pB)- and CTAR1 (CT1)-expressing cells was subjected to quantitative PCR for known target/binding sites of the transcription factors. For the bcl3 and p50 ChIPs, primer pairs were used to amplify known binding sites within the EGFR promoter, EGFR-pro and KB2. For the pStat3 ChIP, primer pairs were used to amplify known binding sites within the bcl3 gene, the bcl3-promoter and intronic sites HS3 and HS4.
Libraries from immunoprecipitated DNA were prepared, sequenced, and aligned to the human genome using Bowtie. Approximately 11 million reads were mapped in both the pBabe (pB) vector control and CTAR1 (CT1)-expressing cells from DNA precipitated with bcl3 antibody. From this, 5,860 peaks with a false discovery rate (FDR) of less than 10 were identified in the pB-containing cells of which 4,520 peaks (77%) localized to genes, while 2,095 peaks were identified in the CTAR1-expressing cells with 96% localized to genes (Fig. 3A). Even though fewer binding sites for bcl3 were identified in the CT1 ChIP, 25% overlapped a bcl3 peak in ENCODE, while only 14% of the sites identified in pB overlapped known bcl3 binding sites (Fig. 3A). Of the 2,012 bcl3 peaks in CTAR1-expressing cells that mapped to genes, 1,488 peaks were identified in common with the control cells, and 524 peaks were unique to CTAR1. The 4,520 peaks identified in the pB-containing cells included the 1,488 peaks in common with CTAR1 and an additional 3,032 peaks that were detected only in the pB-containing cells (Fig. 3B). bcl3 was detected on a total of 3,921 genes in the vector control cells, with bcl3 binding to 1,584 of these genes in CT1-expressing cells either at the same site or a different site within the gene. bcl3 also bound to an additional 2,337 genes in pB-containing cells (Fig. 3C). A number of the genes had multiple binding sites for bcl3, reflected in the total number of peaks being more than the genes bound by bcl3 (Fig. 3B and C). A total of 2,589 genes were bound by bcl3 in the CTAR1-expressing cells with 1,005 genes uniquely bound by bcl3 in these cells. The greater number of genes over the number of peaks in the CTAR1-expressing cells reflects the possible binding to more than one gene at the same site due to genes on both strands or more than one gene in the same direction. Many of the bcl3 peaks in the CTAR1-expressing cells were detected within the promoter regions with another gene on the opposite strand. Thus, one binding site could affect more than one gene (Fig. 3B and C). Both of these analyses indicate that LMP1 induces a shift in the binding of bcl3 to additional and fewer genes and that a portion of the constitutively bound bcl3 remains bound in the presence of LMP1.
FIG 3 .

Distribution of bcl3 peaks. (A) Distribution of peaks with FDRs of <10 across the genome, those mapped to genes (within 2 kb of start site or within intron or exon) and those that overlap ENCODE bcl3 peaks. (B) Overlap of bcl3 peaks between the pB-containing and CT1-expressing cells. (C) Overlap of genes ChIPed by bcl3 in the pB-containing and CT1-expressing cells.
In contrast to the ChIP-Seq data with bcl3, considerable p50 and pStat3 binding was detected across the genome; however, none of the peaks for either p50 or Stat3 had an FDR of <10. Although this decreases the confidence of the peaks identified, the high FDR likely reflects both the quality of the antibodies used for ChIP-Seq and the considerable number of peaks. The transcription binding of p50, Stat3, and bcl3 at sites overlapping those in ENCODE are listed for the genes identified in the RNA-Seq analysis in Table S1 in the supplemental material.
Effects of bcl3 on transcription regulation.
To identify binding to the promoters of specific genes, the promoter was defined to include from position −2000 to the transcription start site. Approximately 88% of the LMP1-CTAR1 enriched bcl3 bound sequence peaks were detected within the promoter with only 1% within an exon, 4% within an intron, and 7% intergenic. In contrast, only 38% of the peaks in the pB-containing control cells were detected within the promoter, 32% within an intron, and 23% intergenic (Fig. 3A). Analysis of genes previously linked to CTAR1 included ID1 and ID3, two genes known to be uniquely induced by LMP1-CTAR1. Although the expression of these genes was essentially unchanged, both genes have peaks with FDRs of <10 within the promoter in the bcl3 ChIP-Seq with peaks that overlap those in the ENCODE data set (Table 3). ID1, ID2, ID3, and ID4 were bound by bcl3 in both the LMP1-CTAR1-expressing and pB-containing cells; however, the peaks had many more reads in the CTAR1-expressing cells, and all had low FDRs (Table 3). Numerous members of the NF-κB pathway were bound by bcl3 in the CTAR1-expressing cells, including the IκB kinase (NEMO), the NF-κB inhibitors IκBα, IκBβ, IκBδ, IκBε, IκBζ, TBK, NFKB1 (p50), NFKB2 (p52), and RelA. Even though the peaks called for some of these genes had FDRs greater than 10, the peaks for IκBα, IκBβ, IκBδ, IκBζ, NFKB1, and NFKB2 overlapped bcl3 sites identified in ENCODE. bcl3 binding was also detected on several MAPK members, including TAK1, ERK2, and MAP3K8 (COT) (FDRs of >10), as well the PI3K members PIK3R1 and PIK3R3. The bcl3 sites in MAP3K8 and PIK3R1 also overlapped ENCODE bcl3 peaks. Additionally, sites near TRAF1, TRAF2, and TRAF6 were detected in the bcl3 ChIP. GSK3B, ICAM1, and RIPK1 were also identified by bcl3 ChIP with the sites for GSK3B and RIPK1 overlapping ENCODE peaks (Table 3). Additional genes that have been previously linked to CTAR1 that had slightly less significant P values in the RNA-Seq data but were not ChIPed by bcl3 included TNFAIP3 (A20) (+4.6-fold), TRAF3 (+1.4-fold), and TRAF5 (+1.2-fold) (Table 3). Of note, many of the genes that had bcl3 peaks overlapping ENCODE bcl3 peaks had only slight expression changes detected by RNA-Seq (Table 3). This may indicate that bcl3 can bind sites but requires additional factors to modulate transcription. Genes with changes in expression with significant P values in the RNA-Seq and bcl3 sites identified in ENCODE included NFKBIA, NFKBIZ, NFKB2, and MAP3K8.
TABLE 3 .
RNA-Seq and ChIP data on genes involved with LMP1 signaling
| Peak overlaps ENCODE peak | Gene | P value by RNA-Seq | Fold change (CT1 vs pB) by RNA-Seq | No. of reads in CT1 by peak calling | FDR | No. of reads in pB for the same peak as for CT1 by peak calling | FDR |
|---|---|---|---|---|---|---|---|
| bcl3 | ID1 | 0.69 | −1.15 | 134 | 2 | 28 | 2 |
| bcl3 | ID2 | 0.47 | 1.25 | 103 | 4 | 30 | 2 |
| bcl3 | ID3 | 0.86 | 1.06 | 184 | 2 | 40 | 3 |
| ID4 | 0.09 | 1.42 | 167 | 5 | 46 | 2 | |
| CHUK (IKKα) | 0.68 | 1.04 | |||||
| IKBKB (IKKβ) | 0.19 | 1.10 | 10 | 4 | |||
| IKBKE (IKKε) | Not expressed | ||||||
| IKBKG (NEMO/IKKγ) | 0.66 | −1.06 | 64 | >10 | |||
| MAP3K14 (NIK) | 0.05 | 1.97 | |||||
| bcl3 | NFKBIA (IκBα) | 0.05 | 4.50 | 113 | >10 | ||
| bcl3 | NFKBIB (IκBβ) | 0.85 | −1.02 | 48 | >10 | ||
| bcl3 | NFKBID (IκBδ) | 0.71 | 1.11 | 98 | 7 | 19 | 6 |
| NFKBIE (IκBε) | 0.23 | 1.27 | 62 | >10 | |||
| bcl3 | NFKBIZ (IκBζ) | 0.01 | 2.98 | 77 | 9 | 53 | 3 |
| TBK1 | 0.44 | 1.06 | 105 | 5 | 100 | 3 | |
| bcl3 | TAB1 | 0.14 | −1.18 | 62 | >10 | ||
| bcl3 | NFKB1 (p50) | 0.19 | 1.42 | 113 | 8 | ||
| bcl3 | NFKB2 (p52) | 0.003 | 6.65 | 109 | >10 | ||
| bcl3 | RELA | 0.35 | −1.04 | 135 | 5 | ||
| RELB | 0.01 | 3.00 | |||||
| MAP2K3 (MEK3) | 0.19 | −1.16 | 80 | >10 | |||
| MAP2K6 (MEK6) | 0.11 | −1.90 | |||||
| MAP3K7 (TAK1) | 0.37 | −1.10 | 54 | >10 | |||
| MAPK1 (ERK2) | 0.003 | −1.20 | 101 | >10 | |||
| bcl3 | MAP3K8 (COT) | 0.04 | 1.70 | 124 | >10 | ||
| bcl3 | PIK3R1 | 0.24 | −1.13 | 139 | 3 | 47 | 2 |
| PIK3R3 | 0.16 | 1.33 | 156 | 3 | 35 | 6 | |
| RB1 | 0.58 | 1.07 | 47 | >10 | |||
| TRAF1 | 0.32 | 1.60 | 75 | >10 | |||
| TRAF2 | 0.21 | 1.14 | 118 | >10 | |||
| TRAF3 | 0.18 | 1.39 | |||||
| TRAF5 | 0.17 | 1.23 | |||||
| TRAF6 | 0.81 | −1.04 | 70 | 7 | 20 | 4 | |
| BCL3 | 0.48 | 1.24 | 111 | >10 | |||
| bcl3 | GSK3B | 0.77 | 1.03 | 119 | >10 | ||
| ICAM1 | 0.06 | 2.5 | 36 | >10 | |||
| bcl3 | RIPK1 (RIP) | 0.98 | −1.01 | 131 | 4 | 41 | 3 |
| TNFAIP3 (A20) | 0.07 | 4.64 | |||||
| EGFR | 0.03 | 9.0 |
Visual inspection of the mapped reads in the bcl3 ChIP-Seq in comparison to the peaks identified by the MACS (model-based binding analysis for ChIP sequencing) program and with peaks for bcl3 from ENCODE revealed surprising differences (Fig. 4). NFKB2 (p100/p52) was increased 6.6-fold at the transcriptional level with a P value of 0.003. Examination of the mapped reads across NFKB2 indicated two strong peaks, which were called as a single peak with an FDR of >10, that overlapped with peaks from ENCODE (Fig. 4). NFKB1 (p105/p50) was increased only 1.42-fold with a not significant P value of 0.19. However, a large, wide peak for bcl3 was identified by MACS with an FDR of 8; this peak overlapped with the ENCODE peak. NFKB1A (IkBα) increased 4.5-fold transcriptionally (P = 0.05) and also had a broad peak with an FDR of >10 that overlapped with two peaks identified in ENCODE. In contrast, the ID proteins, ID1, -2, and -3, all had strong peaks called by MACS with low FDRs but were not significantly affected as determined by RNA-Seq. TRAF1, which has been previously shown to be uniquely induced by LMP1-CTAR1, was increased 1.6-fold by RNA-Seq with a not significant P value. TRAF1 had a strong, clear peak at the promoter identified by MACS with an FDR of >10 that did not overlap with two ENCODE sites, one of which was 4 kb 5′ to the promoter and the other was within an exon. Similarly, ICAM1 which has been shown to require CTAR1 was increased 2.5-fold by RNA-Seq with a P value of 0.06 and had two peaks, one of which was called by MACS with an FDR of >10 and the other overlapped a site identified in ENCODE. In keeping with previous studies, the transcription of EGFR was increased 9-fold. Both p50 and bcl3 have been previously shown to bind the EGFR and were identified in this study in the initial PCR of the ChIPed chromatin for known binding sites; however, peaks for bcl3 or p50 were not identified by the MACS program. Visual inspection of the bcl3 binding for EGFR identified a major broad peak that extended into the first kilobase of the gene. A smaller peak with approximately 5-fold enrichment was also present at the promoter that spanned the sequences used for the initial chromatin PCR. This initial amplification detected 4- to 7-fold enrichment in the LMP-CTAR-expressing cells. Thus, the peak observed by ChIP-Seq was in agreement with the initial analyses but was not statistically significant. These findings suggest that many potential binding sites may be called with poor statistics (FDRs) and that visual inspection of peaks for genes significantly affected transcriptionally may provide additional insight.
FIG 4 .

Visualization of bcl3 peaks called by MACS. A representation of peaks called for bcl3 in the CT1-expressing and pB-containing cells, showing the height of the peak, location on the genome, gene bound, and bcl3 peaks in the ENCODE database. The gene is listed with the fold change by RNA-Seq and the FDR of the peak called by MACS for the CT1-expressing cells. For the EGFR gene, the locations of primers used to check chromatin for known NF-κB sites are shown.
All genes whose expression was changed at least 1.5-fold that are listed in Table S1 in the supplemental material were visually inspected. Genes identified by ChIP with an FDR of <10 are presented in one column, while genes identified with an FDR of >10 that had major peaks are listed in an adjacent column. Interestingly, for genes with an FDR of <10, the CTAR1 peaks had an average increase of 9-fold (ranging from 4 to 20) over the background IgG, while the pB peaks averaged 3-fold over IgG (ranging from 2 to 5). This difference in peak intensity is exemplified by the peaks for ID2 (Fig. 4). The strong, broad peak based on 120 reads for CTAR1 had an FDR of 4, while the small pB peak, based on 30 reads, had an FDR of 2 (Table 3). For peaks with FDRs of >10, the CTAR1 peaks averaged 7.2-fold (ranging from 4 to 17) over IgG, while the pB peaks averaged 3-fold (ranging from 2 to 4). This visual inspection revealed that the small pB peaks were much more likely to have low FDRs compared to the high, broad peaks induced by CTAR1 (Table S2). Comparing the visually curated peaks with genes with significant changes in expression revealed that pB and CTAR1 had approximately the same percentage of genes (11% and 13%, respectively) with decreased expression and ChIPed by bcl3. In contrast for genes with increased expression, manual curation of peaks indicated that for CTAR1 approximately 25% of genes with increased expression were bound by bcl3, while pB had only 8% of genes with increased expression bound by bcl3 (Table S2). This analysis suggests that in the presence of CTAR1, binding of bcl3 increases transcription.
Based on the greater confidence in the bcl3 data, IPA analysis was used to further characterize the pathways potentially regulated through bcl3 based on genes with peaks with FDRs of <10. Common significant canonical pathways shared between the vector control cells and the CTAR1-expressing cells included integrin signaling, protein ubiquitination, molecular mechanisms of cancer, PI3K/AKT signaling, and ERK/MAPK signaling, with additional genes involved in these pathways detected with bcl3 only in CTAR1-expressing cells (Table 4). Additionally, several canonical pathways that were only specifically significant in the CTAR1-expressing cells for bcl3 genes with FDRs of <10 were identified. These pathways included STAT3, TGF signaling, and the regulation of epithelial-mesenchymal transition (Table 4).
TABLE 4 .
Significant canonical pathways of bcl3 ChIPed genesa
| Ingenuity canonical pathway | P value | Ratiob | Genesc |
|---|---|---|---|
| Integrin signaling | 1.3E−06 | 2.18E−01 44/202 | RAP1B, RAP2B, RAP2A, RALA, ARPC1B, ARHGEF7, PIK3R1, ARPC5, SOS2, RHOT2, HRAS, CRK, BCAR1, PTEN, NCK2, ARF6, ACTR3, PPP1R12A, MAP2K2, SOS1, RHOU, TSPAN4, RHOF, MAP2K1, ACTN1, ITGB1, PIK3C2B, ACTR2, NRAS, ASAP1, ARPC5L, CRKL, ACTB, TNK2, BCAR3, ACTG1, GIT1, RAC3, PIK3R3, RRAS2, ARPC1A, CAPN7, FNBP1, ARPC4 |
| Protein ubiquitination pathway | 1.3E−06 | 2.04E−01 52/255 | FZR1, USP45, PSMA7, USP20, UBE2V2, FBXW7, USP48, USP7, UBE2D4, USP10, UBE2E3, DNAJC9, DNAJC19, BIRC6, USP19, DNAJC25, UBE2S, DNAJB14, TRAF6, UBE2G2, USP32, ZBTB12, RBX1, UBE2G1, SMURF2, VHL, UBE2I, USP21, DNAJC10, DNAJA1, USP39, ANAPC1, UBE2F, SMURF1, UCHL1, USP3, USP13, DNAJC4, USP42, HSPE1, AMFR, UBE2M, PSMD13, PSMA1, HSPD1, USP22, UBE2E2, USP46, UBA1, USP34, UBE2D3, BIRC2 |
| Epithelial adherens junction signaling | 1.6E−06 | 2.4E−01 35/146 | EPN3, RAP1B, MYH10, ARPC1B, TGFBR3, ARPC5, HRAS, CRK, PTEN, NOTCH2, ACTR3, BAIAP2, TUBA1C, JUP, CTNNB1, ACTN1, ACTR2, EPN1, TUBB3, NRAS, ARPC5L, TUBB4B, ACTB, FGFR1, TUBB2A, ACVR1, ACTG1, TUBA1B, RRAS2, ARPC1A, TUBB6, FER, SSX2IP, ARPC4, ACVR2A |
| Molecular mechanisms of cancer | 8.9-06 | 1.75E−01 65/365 | RAP2B, CDKN2A, JAK1, BAD, APH1B, FZD3, PIK3R1, SOS2, TAB2, HRAS, MYC, BBC3, MAP2K2, ARHGEF11, RASA1, RALGDS, PIK3C2B, SMAD2, CASP3, RALBP1, RELA, RAC3, PIK3R3, PTPN11, RABIF, IRS1, PLCB3, CYCS, FNBP1, RAP1B, RAP2A, RALA, ARHGEF7, LRP6, RHOT2, CRK, NFKB1, E2F3, CDKN2B, PRKAG1, EP300, CASP6, BMPR1A, SOS1, SMO, RHOU, SMAD4, CTNNB1, RHOF, MAP2K1, PRKDC, CDC25C, NRAS, ARHGEF12, GNAS, DVL1, GNAQ, BAX, SIN3A, NBN, FZD8, RRAS2, BCL2L11, BIRC2 |
| Remodeling of epithelial adherens junctions | 2.8E−06 | 3.09E−01 21/68 | ACTR2, TUBB3, RALA, ARPC1B, ARPC5L, TUBB4B, ACTB, MAPRE1, TUBB2A, ARPC5, TUBA1B, ACTG1, ARF6, ACTR3, ARPC1A, TUBB6, TUBA1C, MAPRE2, CTNNB1, ACTN1, ARPC4 |
| PI3K/AKT signaling | 7.2E−04 | 2.03E−01 25/123 | ITGB1, RELA, NRAS, JAK1, BAD, PIK3R1, SOS2, YWHAZ, HRAS, INPPL1, NFKB1, PTEN, YWHAQ, SYNJ2, PIK3R3, PPP2CB, RRAS2, MAP2K2, TSC2, SOS1, FOXO3, RPS6KB2, CTNNB1, MAP2K1, MCL1 |
| ERK/MAPK signaling | 5.6E−03 | 1.66E−01 31/187 | RAP1B, PPP1CC, BAD, PIK3R1, SOS2, HRAS, CRK, BCAR1, PRKAG1, EP300, YWHAQ, MYC, MAP2K2, CREB1, SOS1, STAT1, MAP2K1, JMJD7-PLA2G4B, ITGB1, PIK3C2B, NRAS, VRK2, CRKL, YWHAZ, HIST2H3C (includes others), RAC3, PIK3R3, PPP2CB, PPP1R3D, RRAS2, PPP1R12A |
| STAT3 pathwayd | 1.0E−03 | 2.33E−01 17/73 | SOCS1, NRAS, PTPN2, TGFBR3, FGFR1, HRAS, IGF2R, MYC, MAP3K12, MAP3K10, RRAS2, MAP2K2, BMPR1A, PDGFRA, FGFRL1, SOCS7, MAP2K1 |
| TGF-β signalingd | 3.1E−03 | 2.07E−01 18/87 | SMAD2, NRAS, SOS2, ACVR1, HRAS, SMURF1, EP300, TRAF6, RRAS2, AMH, MAP2K2, BMPR1A, RUNX2, SOS1, SMAD4, SMURF2, MAP2K1, ACVR2A |
| Regulation of the EMT pathwayd | 2.3E−03 | 1.74E−01 32/184 | RELA, ID2, JAK1, FZD3, PIK3R1, SOS2, HRAS, NFKB1, SMURF1, NOTCH2, MAP2K2, SOS1, SMO, SMAD4, CTNNB1, MAP2K1, SMAD2, PIK3C2B, NRAS, FGFR1, EGR1, DVL1, PYGO2, PIK3R3, FZD8, DVL2, RRAS2, PTPN11, APH1B, FGFRL1, FGF22, MAP2K5 |
A total of 2,589 genes were unique and common to CTAR1-expressing cells. A total of 3,921 genes were unique and common to pB-containing cells.
Ratio indicates the percentage of genes in a pathway that were also ChIPed by bcl3 in CT1-expressing cells (expressed exponentially); number of genes ChIPed in CTAR1-expressing cells/number of genes in the pathway.
Genes unique to CTAR1-expressing are shown in bold type.
Pathway statistically significant to CTAR1-expressing cells and not vector control (pB-containing) cells.
The ChIP-Seq data identified numerous genes (2,589 in CTAR1-expressing cells) that had bcl3 binding with an FDR of <10, but only a small subset of these genes had significant expression changes by RNA-Seq (1.0%). Of the 524 genes with expression changes of ≥1.5-fold, only 25 had corresponding peaks in the bcl3 ChIP. To ascertain whether any of the remaining 499 genes with significant expression changes (≥1.5-fold) that were not ChIPed but were potentially regulated indirectly through bcl3, IPA analysis was utilized to identify possible upstream regulators of these genes. IPA identified 785 possible upstream regulators for these genes of which 159 (20%) were ChIPed by bcl3 in CTAR1-expressing cells. As indicated in Table 2, many of the major predicted upstream regulators for all 1.5-fold genes were ChIPed by bcl3. Genes that were identified with an FDR of <10 included NFKB1, HRAS, CTNNB1 (β-catenin), PTEN, EGR1, PIK3R1, ID1, and ERBB4. Additional potential regulators that were predicted and had bcl3 peaks with an FDR of >10 included TRAF2, GSK3B, NFKBIA (IκBα), MAP3K1 (MEK), and MAPK1 (ERK2). These findings suggest that LMP1-CTAR1-mediated effects on bcl3 are responsible for multiple CTAR1-specific effects on expression. Other potential regulators that were identified with significant P values but were not bound by bcl3 included TRAF3, STAT3, MAP3K14 (NIK), and PRKCD (PKCδ) (Table 2). These potential regulators are in agreement with identified properties of LMP1-CTAR1, which is known to bind TRAF2 and TRAF3 and activate NIK and protein kinase Cδ (PKCδ) (4, 32, 35).
DISCUSSION
This is the first comprehensive RNA-Seq analysis of genes whose expression is modulated only by the CTAR1 domain of LMP1 in the C33 cell line. LMP1-CTAR1 has the unique ability to activate the noncanonical pathway of NF-κB, represented by p52/relB dimers. In the C33 cell line that has little endogenous activation of NF-κB, electrophoretic mobility shift assays (EMSA) had revealed that CTAR1 induced at least 3 distinct complexes, including a prominent p50/p50 homodimer. Additionally, several genes have been shown to be uniquely activated by LMP1-CTAR1, including EGFR, TRAF1, and ICAM1. Both TRAF1 and ICAM1 were increased more than 1.5-fold in the RNA-Seq analysis and bound by bcl3, but with poor FDRs. Surprisingly, transcription of EGFR was increased 9-fold, and both p50 and bcl3 were identified by initial PCR of the ChIPed chromatin for known binding sites; however, peaks for bcl3 or p50 were not called with the MACS program. This disparity with the ability to identify the EGFR promoter between ChIP and the ChIP-Seq data may reflect the complexity of the ChIP-Seq data and the bioinformatics analysis.
LMP1-CTAR1, but not LMP1-CTAR2, is also sufficient for transformation of rodent fibroblasts and has the unique ability to activate PI3 kinase, which is required for rodent fibroblast transformation (5). In this study, the robust analysis of the effects on cellular transcription determined by high-throughput RNA sequencing revealed that the transcription of most genes was not affected by LMP1-CTAR1 and that more genes had reduced expression than increased expression. Importantly, analyses of the pathways represented by these genes are in concordance with many of the biological effects of LMP1 expression. It is known that LMP1-CTAR1 binds multiple ubiquitin ligases, including TRAF2, -3, and -5 and A20 (4, 36). Thus, ubiquitin-mediated changes in protein levels or location may contribute to the potent biological effects of LMP1-CTAR1.
Several genes whose expression was increased by LMP1-CTAR1 were also identified in a similar screen of LMP1-CTAR2 (TES2) in 293 cells using expression microarrays (27). The LMP1-CTAR1 effects on transcription were considerably less compared to CTAR2-mediated transcriptional effects which were almost entirely regulated by NF-κB (27). Additionally, many genes affected by CTAR1 had expression changes opposite to those identified in cells expressing CTAR2 (TES2) (see Table S1 in the supplemental material). Of the top 32 genes with the greatest fold increase, ranging from 182-fold to 5-fold in CTAR1-expressing cells, only 4 were increased by CTAR2 (Table S1). Of the approximately 100 genes whose expression was decreased in the presence of CTAR1 from 525-fold to 5-fold, only 9 genes were affected by CTAR2, and of these, expression of 8 genes actually increased (27). These comparisons suggest that CTAR1 and CTAR2 have very distinct effects on cellular gene expression. The decreased effects of LMP1-CTAR1 on transcription compared to LMP1-CTAR2 may indicate that CTAR1 mediates many of its effects posttranscriptionally.
Comparison of the genes identified in the RNA-Seq analysis with those genes identified by ChIP-Seq indicated that a subset of CTAR1-regulated genes is potentially regulated by bcl3. Genes bound by bcl3 in the vector control cells were equally upregulated or downregulated, while binding of bcl3 in the LMP1-CTAR1-expressing cells was much more likely to upregulate gene expression (see Table S2 in the supplemental material). Importantly, many of the genes whose expression was affected had predicted upstream regulators that were ChIPed by bcl3 or cellular proteins known to be modulated by LMP1-CTAR1, including TRAF2, TRAF3, β-catenin, and PI3 kinase (Table 2). Interestingly, the ubiquitin ligase CYLD, which negatively regulates bcl3 nuclear localization, was increased 2.7-fold in the RNA-Seq analysis (Table S1) (37). The potential decrease in bcl3 nuclear accumulation may be responsible for the detection of fewer genes that were bound by bcl3 in the CTAR1-expressing cells. The predicted activation of TRAF2 and the upregulation of NIK would result in the activation of the noncanonical NF-κB pathway, and also, both p52 and relB expression were increased by LMP1-CTAR1 (Fig. 5). These findings suggest that the noncanonical pathway represented by p52/relB may be responsible for many of the transcriptional effects of CTAR1.
FIG 5 .

LMP1 signaling through CTAR1. LMP1-CTAR1 binds TRAF1, -2, -3, and -5. TRAF2 and -3 recruit cIAP1 (Birc2) which targets TRAF3 for degradation, thereby releasing NIK from TRAF3 negative regulation. NIK is ubiquitinated and stabilized and now available to activate IKKα, which in turn phosphorylates p100 leading to p100 processing to p52, and its subsequent translocation with RelB into the nucleus where the complex will bind DNA and increase transcription of the bound genes. Through activation of PI3K by CTAR1, the increased levels of Map3K8 (Cot) are activated leading to phosphorylation and activation of NIK and its downstream effects. Activated Map3K8 also leads to the processing of p105 to p50 and its subsequent translocation to the nucleus where it can bind with bcl3 to turn on transcription or when bound as homodimers or heterodimers with p52, suppress transcription. The increased CYLD expression would lead to deubiquitination of bcl3 and prevent bcl3 nuclear accumulation. A decrease in canonical NF-κB signaling would result from the decreased expression of TAK1 and the increased expression of IκBα. Genes ChIPed by bcl3 with a FDR of ≤10 and/or match ENCODE peak are indicated by an asterisk. Solid green or red arrows reflect changes in expression with P < 0.05 in RNA-Seq data. Dashed green or red arrows reflect changes in expression with P > 0.05 in RNA-Seq data.
The ChIP data with p50 and STAT3 had poor false discovery rates with no genes identified with an FDR of <10. These data are likely indicative both of antibody quality and broad nonspecific DNA binding. However, several factors suggest that much of the data is specific. Surprisingly, the pattern of binding between LMP1-CTAR1-expressing cells and the vector control cells was considerably different such that only one of the p50 identified peaks was in common with the peaks in the vector control cells. This finding suggests that LMP1-CTAR1 completely altered the binding sites of p50 (data not shown). Sequence alignment of the sequences bound to p50 identified 7,746 peaks that contained p50 peaks induced in the presence of LMP1-CTAR1 compared to 1,594 peaks detected by p50 in the control cells. Additionally, many of the genes bound in LMP1-CTAR1-expressing cells had multiple p50 sites. Comparison with ENCODE data which is based on ChIP of p65 (relA) revealed that 50% of the pBabe p50 ChIPed sites matched p65 sites (data not shown). In contrast, of the LMP1-CTAR1-induced p50 sites, only 6% have been previously identified by ChIP for NF-κB p65 in ENCODE. This suggests that p65 is the binding partner for p50 in the pBabe-containing cells representing canonical NF-κB signaling, while other NF-κB members are the likely binding partners for p50 in CTAR1-expressing cells. These peaks could represent binding of p50 homodimers or p50 with relB or p52, both of which were increased by CTAR1 expression (Table 3). The expression of many genes was decreased in the presence of CTAR1 despite the increased expression of p50 and p52. This finding may reflect the binding of heterodimers of p50/p52 or homodimers of p50/p50 which can bind DNA yet lack a transcriptional transactivation domain and are thought to inhibit transcription (Fig. 5) (38).
Similarly to the dramatic effects of LMP1-CTAR1 on p50 binding, 6,327 peaks were identified as serine phosphorylated Stat3 binding sites in CTAR1-expressing cells, and 3,382 peaks in the vector control cells with only 27 of these peaks in common between the CTAR1-expressing cells and the vector control cells. This again suggests unique effects on the transcription factor STAT3 in the presence of LMP1. Only 6% of these pStat3 sites in the CTAR1-expressing cells have been identified as Stat3 sites in ENCODE which used antibody for total Stat3. This likely suggests that serine phosphorylated Stat3 represents a discrete subset of Stat3 binding or that the phospho-serine Stat3 site is less accessible to antibody.
The MEME Suite was used to identify any motifs in the collection of the bcl3, p50, and pStat3 precipitated sequences (39). A consensus site was not identified within the bcl3 peaks possibly due to the broadness of the peaks; however, the consensus NF-κB1 site was identified for the p50 precipitated sequences in the CTAR1-expressing cells (see Fig. S1 in the supplemental material). Interestingly, the identified consensus site for p50 matched the recently identified CTAR1-mediated change in the p50 binding site (40). The unbiased MEME predictions and the completely distinct binding between the CTAR1-expressing cells and the vector control cells suggest that the p50 and pStat3 ChIP data are reflective of actual binding (Fig. S1). Table S1 reveals that many of the genes with decreased expression in the LMP1-CTAR1-expressing cells had p50 and pStat3 binding sites that have been authenticated in ENCODE. In contrast, genes with increased expression were more likely to be detected by bcl3.
The multiple effects of LMP1-CTAR1 are summarized in Fig. 5. Significant transcriptional upregulation was detected for NFkB2/p100, RelB, and NIK which are the major components in the noncanonical NF-κB pathway. Additionally, cIAP, A20, and MAP3K8 (COT) were also upregulated and likely contribute to the activation of this pathway. Less significant transcriptional increases were also indicated for TRAF1, -2, -3, and -5, which are known to directly bind LMP1-CTAR1. Interestingly, the transcriptional profile suggests potential negative regulation of canonical NF-κB with considerable increased expression of IκBα and NFKBIZ (IκBζ), a novel member of the IκB family, shown to inhibit transactivation and DNA binding of p65 (Table 3) (41). IPA also predicted negative regulation of TAK1, which has been shown to activate the IKK complex (42). Additionally, there were no significant changes in expression of members of the IKK complex, or TRAF6 and RIP, both of which uniquely interact with LMP1-CTAR2.
The bcl3 ChIP also indicated that this transcription factor contributes to many of the unique properties of LMP1-CTAR1. bcl3 peaks that overlap ENCODE bcl3 peaks were detected for NFKB2 (p100), COT, and IκBα The ID proteins previously shown to be induced by CTAR1 were also detected in the bcl3 ChIP with sites that overlap ENCODE bcl3 peaks. LMP1-CTAR1 also activates PI3 kinase, and both PIK3R1 and PIK3R3 were bound by bcl3. In summary, these data indicate that some of the very distinct properties of LMP1-CTAR1 are linked to its effects on bcl3 with IPA prediction that the LMP1-CTAR1 effects are reflective of changes induced by TNF, PI3 kinase, NFkB1 and NFkB2, CD40, NIK, TRAF3, GSK-3β, and β-catenin, all of which are known to be affected by LMP-CTAR1. Although relatively few genes had significant changes in transcription, these effects are predicted to affect pathways critical to cell growth. These data also suggest the potential importance of the transcriptional inhibition due to p50/p50- and p50/p52-mediated repression (Fig. 5). It is surprising that many of the significant biological properties of LMP1 reside in the CTAR1 domain despite the significant transcriptional effects induced by CTAR2 through canonical NF-κB signaling. It is known that LMP1-CTAR1 binds multiple TRAFs that are ubiquitin ligases and also binds the dual ubiquitinating/deubiquitinating A20 protein which was transcriptionally increased 4.6-fold. This understanding and the limited number of transcriptional changes suggest that LMP1-CTAR1 likely has considerable effects on the cellular proteome not only through changes in protein abundance but also potentially through unique ubiquitin linkages that affect both cellular location and formation of protein complexes.
MATERIALS AND METHODS
Cell culture and cell lines.
C33A, cervical carcinoma, stable cell lines expressing CTAR1 (amino acids 1 to 231) or vector control pBabe were established as previously reported (19) and were cultured in Dulbecco’s modified Eagle’s medium (Gibco) supplemented with 10% fetal bovine serum (Sigma) and antibiotic/antimycotic (Gibco) and 1 µg/ml puromycin (Sigma) at 37°C with 5% CO2.
ChIP analysis.
Chromatin immunoprecipitation (ChIP) analysis was performed for two biological replicates using a ChIP kit (Millipore Magna ChIP A/G) according to the manufacturer’s protocol. Briefly, cells were cultivated in 150-mm plates to 90% confluence. The cells were fixed for 10 min in 1% freshly made formaldehyde, washed with phosphate-buffered saline (PBS), and lysed for 15 min on ice in lysis buffer provided in the kit. Chromatin was sheared by sonication to an average size of ~200 to 500 bp and clarified. Chromatin was incubated with normal rabbit immunoglobulin G, with anti-bcl3 (sc-185x; Santa Cruz), anti-p50 (ab7971-1; Abcam), or anti-phospho-STAT3 (Ser727) (Cell Signaling 9134) at 4°C overnight on a nutator. Protein A/G magnetic beads were added, and the samples were incubated at 4°C for 2 h on a nutator. The antibody/DNA/magnetic bead complexes were thoroughly washed, the protein/DNA complexes were eluted, and the cross-linking was reversed by proteinase K digestion for 2 h at 62°C to free the DNA. Sample DNAs were purified for further analysis according to the manufacturer’s protocol. For ChIP-seq samples, DNA from ChIP was submitted to the University of North Carolina High Throughput Sequencing Facility for library preparation and high-throughput sequencing. Single-end 50-bp sequences were generated from each library using the Illumina HiSeq 2000 platform.
PCR of known target sites.
To confirm the success of the ChIP, the sample DNAs were subjected to quantitative PCR for known target/binding sites of the transcription factors. PCR was performed with Quantifast SYBR green kit (Qiagen). For the bcl3 and p50 ChIPs, primer pairs used to amplify known binding sites within the EGFR promoter were as follows: 5′ GGGGACCCGAATAAAGGAGCAGTTT 3′ and 5′ CTGAGGAGTTAATTTCCGAGAGGGG 3′ for EGFR-pro and 5′ AGGGTCCCGTAGTGCTGCA 3′ and 5′ ACTGGCCGAGCCTTAGAGCCA 3′ for KB2. For the pStat3 ChIP, primer pairs used to amplify known binding sites within the bcl3 gene were as follows: 5′ TGACCCGGACTCAACCCCAG 3′ and 5′ TCTCCTCCCCTCCTCTCCCTC 3′ for bcl3-promoter, 5′ CGCTTCCTCCAACCTTAACC 3′ and 5′ TGCCCAGTCCCTAACCTCTT 3′ for HS3, and 5′ CATTCGAGGATGGAAGTTGG 3′ and 5′ CAGGGTTAAGTGAGGGCAGA 3′ for HS4.
ChIP-Seq analysis.
The resulting sequences were mapped to the reference human genome (University of California Santa Cruz [UCSC]) hg19 using Bowtie, a short-read aligner, in Galaxy (43). Binding sites (peaks) were identified using the MACS (model-based binding analysis for ChIP sequencing) program, a Poisson-based method, with a P value cutoff of 10−5. Only binding sites within the full-length RefSeq gene, exon, intron, and promoter region defined as ≤2 kb from the transcriptional start site were retained. To annotate the peaks, the gene information tracks, UCSC gene, available at UCSC genome browser was utilized. ENCODE peaks for the transcription factors bcl3, NF-κB (RelA), and Stat3, also available at UCSC table browser were utilized for comparison of peaks identified in this study to previously identified transcription factor regulation sites (ENCODE Uniform TFBS, ENCODE/SYDH [Stanford/Yale/USC/Harvard], and ENCODE/HAIB [Hudson Alpha Institute]). Peaks were visualized using Integrative Genomics Viewer (IGV).
Binding motif identification.
To find statistically enriched sequence motifs within the ChIP-Seq peak regions, the MEME web application was utilized (http://meme.nbcr.net/meme). The position weighted matrix (PWM) generated by MEME was then represented in the log format using Web logo http://weblogo.berkley.edu/logo.cgi to generate consensus sequences for multiple cellular bcl3, p50, or pStat3 binding sites. To determine whether the enriched motifs potentially overlapped known transcription factor recognition motifs, the identified motifs were matched with JASPER core database (http://jaspar.genereg.net) using the TOMTOM program in MEME.
RNA-Seq.
Total RNA was purified using RNeasy kit (Qiagen) and then treated with DNase. Illumina RNA TruSeq libraries (average size, 300 bp) were prepared from triplicate RNA samples by the University of North Carolina Genomics Core and were sequenced by the North Carolina High Throughput Sequencing Facility. Paired-end 50-bp sequences were generated from each library using the Illumina HiSeq 2000 platform. The resulting sequences were mapped to the human genome (hg19) using Tophat for Illumina in Galaxy. The resulting mapped reads were mapped to annotated genes and statistically analyzed with Partek Genomics Suite.
Ingenuity analysis.
For pathway analysis, all genes annotated in ChIP-Seq and RNA-Seq were analyzed using Ingenuity Systems IPA software.
SUPPLEMENTAL MATERIAL
NFKB1 (p50) site identified by MEME analysis from MACS peaks (FDR of >10) called for p50 in CTAR1-expressing cells. Peak sequences identified by MACS for p50 were analyzed by MEME to identify statistically enriched sequence motifs within the bound sequences. The enriched motifs were further analyzed for consensus binding motifs of known transcription factors. The consensus p50 binding site was identified in the CT1 p50-bound sequences. Download
All significant 1.5-fold changes in RNA-Seq library from CTAR1-expressing cells used for ChIP with bcl3, p50, and pStat3.
Expression data and bcl3 ChIP data for genes uniquely bound by bcl3 in either pBabe (pB) vector control or CTAR1 (CT1)-expressing cells.
ACKNOWLEDGMENT
This work was supported by Public Health Service grant CA32979 to N.R.-T. from the National Cancer Institute.
Footnotes
Citation Edwards RH, Marquitz A, Raab-Traub N. 2015. Changes in expression induced by Epstein-Barr virus LMP1-CTAR1: potential role of bcl3. mBio 6(2):e00441-15. doi:10.1128/mBio.00441-15.
REFERENCES
- 1.Raab-Traub N. 2007. EBV-induced oncogenesis, p 986–1006. In Arvin A, Campadelli-Fiume G, Mocarski E, Moore PS, Roizman B, Whitley R, Yamanishi K (ed), Human herpesviruses: biology, therapy, and immunoprophylaxis. Cambridge University Press, Cambridge, United Kingdom. [PubMed] [Google Scholar]
- 2.Raab-Traub N. 2002. Epstein-Barr virus in the pathogenesis of NPC. Semin Cancer Biol 12:431–441. doi: 10.1016/S1044579X0200086X. [DOI] [PubMed] [Google Scholar]
- 3.Dawson CW, Port RJ, Young LS. 2012. The role of the EBV-encoded latent membrane proteins LMP1 and LMP2 in the pathogenesis of nasopharyngeal carcinoma (NPC). Semin Cancer Biol 22:144–153. doi: 10.1016/j.semcancer.2012.01.004. [DOI] [PubMed] [Google Scholar]
- 4.Mosialos G, Birkenbach M, Yalamanchili R, VanArsdale T, Ware C, Kieff E. 1995. The Epstein-Barr virus transforming protein LMP1 engages signaling proteins for the tumor necrosis factor receptor family. Cell 80:389–399. doi: 10.1016/0092-8674(95)90489-1. [DOI] [PubMed] [Google Scholar]
- 5.Mainou BA, Everly DN Jr, Raab-Traub N. 2005. Epstein-Barr virus latent membrane protein 1 CTAR1 mediates rodent and human fibroblast transformation through activation of PI3K. Oncogene 24:6917–6924. doi: 10.1038/sj.onc.1208846. [DOI] [PubMed] [Google Scholar]
- 6.Kaye KM, Izumi KM, Li H, Johannsen E, Davidson D, Longnecker R, Kieff E. 1999. An Epstein-Barr virus that expresses only the first 231 LMP1 amino acids efficiently initiates primary B-lymphocyte growth transformation. J Virol 73:10525–10530. [DOI] [PMC free article] [PubMed] [Google Scholar]
- 7.Huen DS, Henderson SA, Croom-Carter D, Rowe M. 1995. The Epstein-Barr virus latent membrane protein-1 (LMP1) mediates activation of NF-kappa B and cell surface phenotype via two effector regions in its carboxy-terminal cytoplasmic domain. Oncogene 10:549–560. [PubMed] [Google Scholar]
- 8.Miller WE, Mosialos G, Kieff E, Raab-Traub N. 1997. Epstein-Barr virus LMP1 induction of the epidermal growth factor receptor is mediated through a TRAF signaling pathway distinct from NF-kappaB activation. J Virol 71:586–594. [DOI] [PMC free article] [PubMed] [Google Scholar]
- 9.Devergne O, Cahir McFarland ED, Mosialos G, Izumi KM, Ware CF, Kieff E. 1998. Role of the TRAF binding site and NF-kappaB activation in Epstein-Barr virus latent membrane protein 1-induced cell gene expression. J Virol 72:7900–7908. [DOI] [PMC free article] [PubMed] [Google Scholar]
- 10.Häcker H, Karin M. 2006. Regulation and function of IKK and IKK-related kinases. SCI STKE 2006:re13. doi: 10.1126/stke.3572006re13. [DOI] [PubMed] [Google Scholar]
- 11.Sun SC. 2012. The noncanonical NF-kappaB pathway. Immunol Rev 246:125–140. doi: 10.1111/j.1600-065X.2011.01088.x. [DOI] [PMC free article] [PubMed] [Google Scholar]
- 12.Paine E, Scheinman RI, Baldwin AS Jr, Raab-Traub N. 1995. Expression of LMP1 in epithelial cells leads to the activation of a select subset of NF-kappa B/Rel family proteins. J Virol 69:4572–4576. [DOI] [PMC free article] [PubMed] [Google Scholar]
- 13.Eliopoulos AG, Caamano JH, Flavell J, Reynolds GM, Murray PG, Poyet JL, Young LS. 2003. Epstein-Barr virus-encoded latent infection membrane protein 1 regulates the processing of p100 NF-kappaB2 to p52 via an IKKgamma/NEMO-independent signalling pathway. Oncogene 22:7557–7569. doi: 10.1038/sj.onc.1207120. [DOI] [PubMed] [Google Scholar]
- 14.Luftig M, Yasui T, Soni V, Kang MS, Jacobson N, Cahir-McFarland E, Seed B, Kieff E. 2004. Epstein-Barr virus latent infection membrane protein 1 TRAF-binding site induces NIK/IKK alpha-dependent noncanonical NF-kappaB activation. Proc Natl Acad Sci U S A 101:141–146. doi: 10.1073/pnas.2237183100. [DOI] [PMC free article] [PubMed] [Google Scholar]
- 15.Miller WE, Cheshire JL, Raab-Traub N. 1998. Interaction of tumor necrosis factor receptor-associated factor signaling proteins with the latent membrane protein 1 PXQXT motif is essential for induction of epidermal growth factor receptor expression. Mol Cell Biol 18:2835–2844. [DOI] [PMC free article] [PubMed] [Google Scholar]
- 16.Thornburg NJ, Raab-Traub N. 2007. Induction of epidermal growth factor receptor expression by Epstein-Barr virus latent membrane protein 1 C-terminal-activating region 1 is mediated by NF-kappaB p50 homodimer/Bcl-3 complexes. J Virol 81:12954–12961. doi: 10.1128/JVI.01601-07. [DOI] [PMC free article] [PubMed] [Google Scholar]
- 17.Kung CP, Raab-Traub N. 2008. Epstein-Barr virus latent membrane protein 1 induces expression of the epidermal growth factor receptor through effects on Bcl-3 and STAT3. J Virol 82:5486–5493. doi: 10.1128/JVI.00125-08. [DOI] [PMC free article] [PubMed] [Google Scholar]
- 18.Chung GT, Lou WP, Chow C, To KF, Choy KW, Leung AW, Tong CY, Yuen JW, Ko CW, Yip TT, Busson P, Lo KW. 2013. Constitutive activation of distinct NF-kappaB signals in EBV-associated nasopharyngeal carcinoma. J Pathol 231:311–322. doi: 10.1002/path.4239. [DOI] [PubMed] [Google Scholar]
- 19.Everly DN Jr, Mainou BA, Raab-Traub N. 2004. Induction of Id1 and Id3 by latent membrane protein 1 of Epstein-Barr virus and regulation of p27/Kip and cyclin-dependent kinase 2 in rodent fibroblast transformation. J Virol 78:13470–13478. doi: 10.1128/JVI.78.24.13470-13478.2004. [DOI] [PMC free article] [PubMed] [Google Scholar]
- 20.Vockerodt M, Morgan SL, Kuo M, Wei W, Chukwuma MB, Arrand JR, Kube D, Gordon J, Young LS, Woodman CB, Murray PG. 2008. The Epstein-Barr virus oncoprotein, latent membrane protein-1, reprograms germinal centre B cells towards a Hodgkin’s Reed-Sternberg-like phenotype. J Pathol 216:83–92. doi: 10.1002/path.2384. [DOI] [PubMed] [Google Scholar]
- 21.Cahir-McFarland ED, Carter K, Rosenwald A, Giltnane JM, Henrickson SE, Staudt LM, Kieff E. 2004. Role of NF-kappa B in cell survival and transcription of latent membrane protein 1-expressing or Epstein-Barr virus latency III-infected cells. J Virol 78:4108–4119. doi: 10.1128/JVI.78.8.4108-4119.2004. [DOI] [PMC free article] [PubMed] [Google Scholar]
- 22.Shair KHY, Raab-Traub N. 2012. Transcriptome changes induced by Epstein-Barr virus LMP1 and LMP2A in transgenic lymphocytes and lymphoma. mBio 3(5):00288-12. doi: 10.1128/mBio.00288-12. [DOI] [PMC free article] [PubMed] [Google Scholar]
- 23.Sengupta S, den Boon JA, Chen IH, Newton MA, Dahl DB, Chen M, Cheng YJ, Westra WH, Chen CJ, Hildesheim A, Sugden B, Ahlquist P. 2006. Genome-wide expression profiling reveals EBV-associated inhibition of MHC class I expression in nasopharyngeal carcinoma. Cancer Res 66:7999–8006. doi: 10.1158/0008-5472.CAN-05-4399. [DOI] [PubMed] [Google Scholar]
- 24.Morris MA, Dawson CW, Wei W, O’Neil JD, Stewart SE, Jia J, Bell AI, Young LS, Arrand JR. 2008. Epstein-Barr virus-encoded LMP1 induces a hyperproliferative and inflammatory gene expression programme in cultured keratinocytes. J Gen Virol 89:2806–2820. doi: 10.1099/vir.0.2008/003970-0. [DOI] [PubMed] [Google Scholar]
- 25.Chen X, Liang S, Zheng W, Liao Z, Shang T, Ma W. 2008. Meta-analysis of nasopharyngeal carcinoma microarray data explores mechanism of EBV-regulated neoplastic transformation. BMC Genomics 9:322. doi: 10.1186/1471-2164-9-322. [DOI] [PMC free article] [PubMed] [Google Scholar]
- 26.Bose S, Yap LF, Fung M, Starzcynski J, Saleh A, Morgan S, Dawson C, Chukwuma MB, Maina E, Buettner M, Wei W, Arrand J, Lim PV, Young LS, Teo SH, Stankovic T, Woodman CB, Murray PG. 2009. The ATM tumour suppressor gene is down-regulated in EBV-associated nasopharyngeal carcinoma. J Pathol 217:345–352. doi: 10.1002/path.2487. [DOI] [PubMed] [Google Scholar]
- 27.Gewurz BE, Mar JC, Padi M, Zhao B, Shinners NP, Takasaki K, Bedoya E, Zou JY, Cahir-McFarland E, Quackenbush J, Kieff E. 2011. Canonical NF-kappaB activation is essential for Epstein-Barr virus latent membrane protein 1 TES2/CTAR2 gene regulation. J Virol 85:6764–6773. doi: 10.1128/JVI.00422-11. [DOI] [PMC free article] [PubMed] [Google Scholar]
- 28.Wakisaka N, Kondo S, Yoshizaki T, Murono S, Furukawa M, Pagano JS. 2004. Epstein-Barr virus latent membrane protein 1 induces synthesis of hypoxia-inducible factor 1 alpha. Mol Cell Biol 24:5223–5234. doi: 10.1128/MCB.24.12.5223-5234.2004. [DOI] [PMC free article] [PubMed] [Google Scholar]
- 29.Hatzivassiliou EG, Kieff E, Mosialos G. 2007. Constitutive CD40 signaling phenocopies the transforming function of the Epstein-Barr virus oncoprotein LMP1 in vitro. Leuk Res 31:315–320. doi: 10.1016/j.leukres.2006.06.023. [DOI] [PubMed] [Google Scholar]
- 30.Uchida J, Yasui T, Takaoka-Shichijo Y, Muraoka M, Kulwichit W, Raab-Traub N, Kikutani H. 1999. Mimicry of CD40 signals by Epstein-Barr virus LMP1 in B lymphocyte responses. Science 286:300–303. doi: 10.1126/science.286.5438.300. [DOI] [PubMed] [Google Scholar]
- 31.Mainou BA, Everly DN Jr, Raab-Traub N. 2007. Unique signaling properties of CTAR1 in LMP1-mediated transformation. J Virol 81:9680–9692. doi: 10.1128/JVI.01001-07. [DOI] [PMC free article] [PubMed] [Google Scholar]
- 32.Kung CP, Meckes DG Jr, Raab-Traub N. 2011. Epstein-Barr virus LMP1 activates EGFR, STAT3, and ERK through effects on PKCdelta. J Virol 85:4399–4408. doi: 10.1128/JVI.01703-10. [DOI] [PMC free article] [PubMed] [Google Scholar]
- 33.Everly DN Jr, Kusano S, Raab-Traub N. 2004. Accumulation of cytoplasmic beta-catenin and nuclear glycogen synthase kinase 3beta in Epstein-Barr virus-infected cells. J Virol 78:11648–11655. doi: 10.1128/JVI.78.21.11648-11655.2004. [DOI] [PMC free article] [PubMed] [Google Scholar]
- 34.Jang KL, Shackelford J, Seo SY, Pagano JS. 2005. Up-regulation of beta-catenin by a viral oncogene correlates with inhibition of the seven in absentia homolog 1 in B lymphoma cells. Proc Natl Acad Sci U S A 102:18431–18436. doi: 10.1073/pnas.0504054102. [DOI] [PMC free article] [PubMed] [Google Scholar]
- 35.Sylla BS, Hung SC, Davidson DM, Hatzivassiliou E, Malinin NL, Wallach D, Gilmore TD, Kieff E, Mosialos G. 1998. Epstein-Barr virus-transforming protein latent infection membrane protein 1 activates transcription factor NF-kappaB through a pathway that includes the NF-kappaB-inducing kinase and the IkappaB kinases IKKalpha and IKKbeta. Proc Natl Acad Sci U S A 95:10106–10111. doi: 10.1073/pnas.95.17.10106. [DOI] [PMC free article] [PubMed] [Google Scholar]
- 36.Fries KL, Miller WE, Raab-Traub N. 1999. The A20 protein interacts with the Epstein-Barr virus latent membrane protein 1 (LMP1) and alters the LMP1/TRAF1/TRADD complex. Virology 264:159–166. doi: 10.1006/viro.1999.9980. [DOI] [PubMed] [Google Scholar]
- 37.Massoumi R, Chmielarska K, Hennecke K, Pfeifer A, Fässler R. 2006. Cyld inhibits tumor cell proliferation by blocking Bcl-3-dependent NF-kappaB signaling. Cell 125:665–677. doi: 10.1016/j.cell.2006.03.041. [DOI] [PubMed] [Google Scholar]
- 38.Cheng CS, Feldman KE, Lee J, Verma S, Huang DB, Huynh K, Chang M, Ponomarenko JV, Sun SC, Benedict CA, Ghosh G, Hoffmann A. 2011. The specificity of innate immune responses is enforced by repression of interferon response elements by NF-kappaB p50. Sci Signal 4:ra11. doi: 10.1126/scisignal.2001501. [DOI] [PMC free article] [PubMed] [Google Scholar]
- 39.Machanick P, Bailey TL. 2011. MEME−ChIP: motif analysis of large DNA datasets. Bioinformatics 27:1696–1697. doi: 10.1093/bioinformatics/btr189. [DOI] [PMC free article] [PubMed] [Google Scholar]
- 40.Zhao B, Barrera LA, Ersing I, Willox B, Schmidt SC, Greenfeld H, Zhou H, Mollo SB, Shi TT, Takasaki K, Jiang S, Cahir-McFarland E, Kellis M, Bulyk ML, Kieff E, Gewurz BE. 2014. The NF-kappaB genomic landscape in lymphoblastoid B cells. Cell Rep 8:1595–1606. doi: 10.1016/j.celrep.2014.07.037. [DOI] [PMC free article] [PubMed] [Google Scholar]
- 41.Totzke G, Essmann F, Pohlmann S, Lindenblatt C, Jänicke RU, Schulze-Osthoff K. 2006. A novel member of the IkappaB family, human IkappaB-zeta, inhibits transactivation of p65 and its DNA binding. J Biol Chem 281:12645–12654. doi: 10.1074/jbc.M511956200. [DOI] [PubMed] [Google Scholar]
- 42.Wu L, Nakano H, Wu Z. 2006. The C-terminal activating region 2 of the Epstein-Barr virus-encoded latent membrane protein 1 activates NF-kappaB through TRAF6 and TAK1. J Biol Chem 281:2162–2169. doi: 10.1074/jbc.M505903200. [DOI] [PubMed] [Google Scholar]
- 43.Langmead B. 2010. Aligning short sequencing reads with Bowtie. Curr Protoc Bioinformatics Chapter 11:Unit 11.7. doi: 10.1002/0471250953.bi1107s32 PubMed. [DOI] [PMC free article] [PubMed] [Google Scholar]
Associated Data
This section collects any data citations, data availability statements, or supplementary materials included in this article.
Supplementary Materials
NFKB1 (p50) site identified by MEME analysis from MACS peaks (FDR of >10) called for p50 in CTAR1-expressing cells. Peak sequences identified by MACS for p50 were analyzed by MEME to identify statistically enriched sequence motifs within the bound sequences. The enriched motifs were further analyzed for consensus binding motifs of known transcription factors. The consensus p50 binding site was identified in the CT1 p50-bound sequences. Download
All significant 1.5-fold changes in RNA-Seq library from CTAR1-expressing cells used for ChIP with bcl3, p50, and pStat3.
Expression data and bcl3 ChIP data for genes uniquely bound by bcl3 in either pBabe (pB) vector control or CTAR1 (CT1)-expressing cells.