Abstract
Background:
The Cancer Drugs Fund (CDF) provides £200 million annually in England for ‘anti-cancer' drugs.
Methods:
We used a controlled pre-/post-intervention design to compare IMS Health dispensing data for 15 cancer drugs (2007–2012) in England vs Wales, stratified by pre-CDF NICE drug approval status (rejected, mixed recommendations, recommended, not appraised).
Results:
The CDF was associated with increased prescribing in England for three of five drugs rejected or with mixed NICE recommendations. The prescribing volume ratios (PVR) ranged from 1.29 (95% CI 1.00, 1.67) for sorafenib to 3.28 (2.59, 4.14) for bevacizumab (NICE rejected) and 0.93 (0.81, 1.06) and 1.35 (1.21, 1.49) for sunitinib and imatinib respectively (mixed recommendations). Post CDF prescribing in England increased for both drugs awaiting NICE appraisal pre-CDF (lapatinib PVR=7.44 (5.81, 9.54), panitumumab PVR=5.40 (1.20, 24.42)) and subsequently rejected. The CDF was not associated with increased prescribing in England of NICE-recommended drugs. The three most recently launched, subsequently recommended drugs were adopted faster in Wales (from pazopanib PVR=0.51 (0.28, 0.96) to abiraterone PVR=0.78 (0.61–0.99)).
Interpretation:
These data indicate that the CDF is used to access drugs deemed not cost-effective by NICE. The CDF did not expedite access to new cost-effective cancer agents prior to NICE approval.
Keywords: NICE, cancer drugs fund, chemotherapy, cost-effective, UK
Cancer is the leading cause of death in the UK. Cancer drugs account for an increasing proportion of developed-country health budgets (Sullivan et al, 2011). Restricted access to cancer drugs has been cited as an important contributor to relatively poor survival from cancer in UK (Wilking and Jonsson, 2005; Lichtenberg, 2009), although this interpretation is controversial (Coleman, 2007). In 2010, the UK health minister pledged to create a Cancer Drugs Fund (CDF) ‘addressing the disparity in patients' access to cancer drugs in England compared with other countries' (Department of Health, 2010). The CDF was conceived ‘so that cancer sufferers and their families could benefit from drugs that their doctors believe could improve their quality of life' (Department of Health, 2010). Specifically, the Fund was to provide access to (a) drugs not yet appraised by NICE, (b) NICE appraised drugs found to be not cost-effective, or (c) drugs used in novel indications or formulations, which had not been licensed.
The CDF was introduced in England in October 2010 (Richards, 2004). A £50 million interim CDF (October 2010 to March 2011,) was superseded by a £200 million annual CDF. The CDF was intended to be a funding ‘stop-gap', pending the introduction of value-based pricing in 2014. However, the Government has announced a further £400 million investment to continue the CDF beyond 2014 (Cancer Research UK, 2013). There is an imperative for NHS funds to be spent efficiently (Department of Health, 2013) and in the current financial climate (Ford, 2013), it is more important than ever to evaluate how ring-fenced money for the CDF has been spent.
Our aim was to explore the impact of the CDF on access to cancer drugs in England, compared with Wales, using secondary-care data relating to the dispensing of 15 high-cost cancer drugs from 2007 to 2012. Specifically, we aimed to test several hypotheses: (a) that drugs which were deemed not cost-effective in some or all indications by NICE would be prescribed more in England than in Wales following the CDF; (b) that prescribing of drugs that NICE recommended before the CDF would not increase faster in England compared with Wales post CDF and (c) that drugs that had no NICE appraisal pre-CDF or were launched around the time of the CDF would demonstrate greater prescribing volumes in England compared with Wales.
Materials and Methods
IMS Health secondary-care data for high-cost cancer drugs were compared between England and Wales from August 2007 to December 2012. IMS Health is an established data source used extensively by pharmaceutical companies, government agencies, policy-makers and researchers (Richards, 2004, 2010; The Information Centre for Health and Social Care, 2012). IMS Health data in this analysis were obtained exclusively from hospital pharmacies. Hospitals provide monthly extracts on a routine basis to IMS relating to the volume of all drugs dispensed, or recorded as being dispensed, by that pharmacy. We excluded private prescription data from our analysis to focus on NHS prescribing.
We reviewed NICE technology appraisal (TA) decisions between 1 March 2000 and 23 January 2012 to identify appraisals of pharmaceuticals for the treatment of cancer. We selected drugs that were prescribed on the CDF in 10 or more cases in each of four regions that published annual reports (NHS London, Yorkshire and Humber, West Midlands and North West) during the period April 2011 to March 2012. We excluded drugs that did not have anti-tumour activity (NHS England, 2013a) and drugs used predominantly in pediatric oncology. This resulted in a list of 24 drugs. We stratified these drugs by tumour type and NICE decision (recommended/not recommended/not appraised). For strata that contained more than one drug, we randomly selected one drug for inclusion. This resulted in a list of 18 drugs. Two further drugs were excluded due to missing or zero prescribing data for more than 25% of the available months since launch (cabazitaxel and ipilimumab) and one additional drug (Paclitaxel) was excluded because it had no NICE appraisal since 2007. The final list of 15 drugs, with NICE TA decisions and cancer indication(s) are included in Box 1.
Box 1. Technology appraisal decisions and cancer drugs 2007–12.
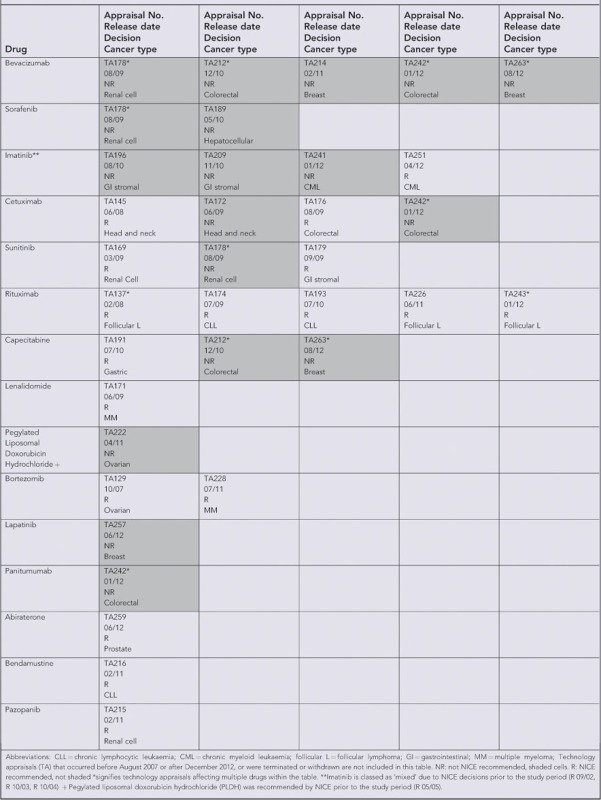
We classified the drugs into five groups according to their pre-CDF NICE appraisal status (Table 1). Group 1 included drugs that had been rejected for all indications. Group 2 included drugs that had mixed recommended and rejected decisions (for different indications). Group 3 included drugs that were recommended for all indications. Group 4 contained all drugs that had no NICE appraisal decision prior to the CDF. Group 5 included new drugs launched within 3 months or after the introduction of the CDF.
Table 1. A priori hypothesis table of cancer drug classification.
| Drug groups | Hypothesis | Explanation | Drugs |
|---|---|---|---|
| Group 1: Rejected by NICE for all indication(s) considered pre-CDF | Relative to pre-CDF prescribing levels, prescribing will increase faster in England compared with Wales following the CDF | Increased prescribing in England since drugs that were previously declined on cost-effectiveness grounds can now be prescribed | Bevacizumab Sorafenib |
| Group 2: Mixed recommended and rejection decisions by NICE for differing indications pre-CDF | Relative to pre-CDF prescribing levels, prescribing will increase faster in England compared with Wales following the CDF | Increased prescribing in England for indications where the drug was previously declined on cost-effectiveness grounds | Imatinib Cetuximab Sunitinib |
| Group 3: Recommended by NICE for all indications considered pre-CDF | Relative to pre-CDF prescribing levels, prescribing will not increase faster in England compared with Wales following the CDF | No difference between English and Welsh prescribing for recommended drugs since these drugs could already be accessed through NHS funding pre-CDF | Rituximab Capecitabine Lenalidomide PLDH Bortezomib |
| Group 4: No NICE appraisal decision pre- CDF | Relative to pre-CDF prescribing levels, prescribing will increase faster in England compared with Wales following the CDF | Drugs without NICE decisions can now be accessed via the CDF leading to increased prescribing in England, but not in Wales | Lapatinib Panitumumab |
| Group 5. Drugs launched immediately prior to or after the CDF | Prescribing for these drugs will increase faster in England compared with Wales | New drugs may be more rapidly adopted in England following the introduction of the Cancer Drugs Fund, compared with Wales where prescribing increases may be delayed pending NICE recommendation. | Abiraterone Bendamustine Pazopanib |
Abbreviations: CDF=Cancer Drugs Fund; NHS= National Health Service; NICE=National Institute for Health and Care Excellence; PLDH=pegylated liposomal doxorubicin hydrochloride.
A priori hypotheses were developed for the influence of the CDF for each of the five group classifications (Table 1). We hypothesised that post CDF prescribing of drugs rejected by NICE for all or some indications (Groups 1 and 2) would increase in England relative to Wales, representing prescribing for indications considered by NICE to be not cost-effective. We hypothesised that there would be no change in post CDF prescribing of drugs approved by NICE for all indications pre-CDF (Group 3) in England relative to Wales. We also hypothesised that relative prescribing of drugs with no NICE appraisal or launch dates around the introduction of the CDF (Groups 4 and 5) would be higher in England relative to Wales due to faster uptake of drugs awaiting appraisal. For groups 1–4 we conducted a controlled before-and-after study comparing prescribing volumes in England and Wales before and after the CDF. For group 5, we compared prescribing volumes in England and Wales post CDF.
Prescribing volumes (milligrams per 1000 population) were plotted using 3 monthly moving averages per head of population (mid-year ONS population estimates) for England and Wales. For each drug, negative binomial regression was used to analyse prescribed volume per head of population. Negative binomial regression was chosen because some count data were overdispersed (Kim and Kriebel, 2009). For drugs in groups 1–4, the number of milligrams prescribed per month between October 2009 and December 2012, offset by population size, was regressed on the independent variables of country (Wales=0, England=1), period (pre-CDF=0, post CDF=1) and an interaction term between country and period (i.e., the prescribing volume ratio (PVR)). A PVR coefficient >1 indicates an increase in post-CDF prescribing in England relative to Wales. For drugs in group 5, the number of milligrams prescribed per month between October 2010 and December 2012, offset by population size, was regressed on the independent variable of country (Wales=0, England=1). A country coefficient >1 indicates faster uptake of prescribing in England than Wales. All analyses were conducted using Stata (version 12.0, StataCorp LP, College Station, TX, USA).
Ethical approval for the use of IMS Health cancer drug dispensing data was granted by the South West Research Ethics Committee.
Results
Group 1 (drugs rejected by NICE pre-CDF)
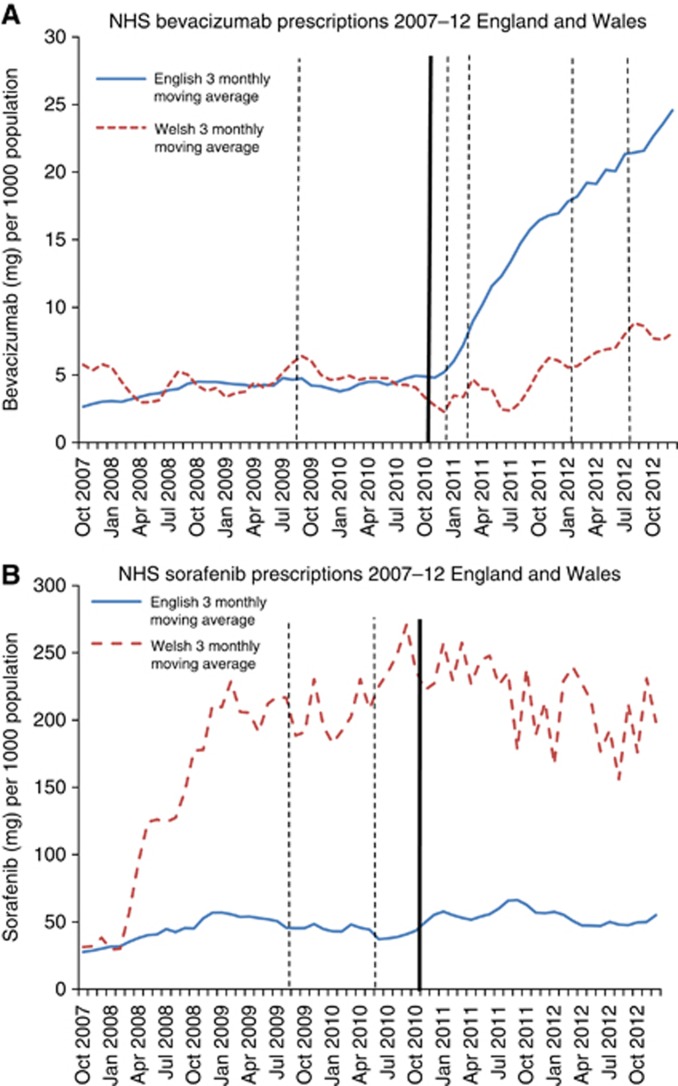
In the year before the CDF, prescribing volumes in England and Wales were similar for bevacizumab but widely different for sorafenib, where rates were much higher in Wales (Figure 1A and B). Post CDF, bevacizumab prescribing increased more than two-fold in England compared with a 63.8% increase in Wales, despite four further NICE ‘not recommended' decisions. The mean prescribing volume of sorafenib in England over the post-CDF period was 25.4% higher than in the 1 year pre-CDF period, compared with only a 2.5% rise in Wales. Regression analyses (Table 2) showed correspondingly strong evidence of a large association between the introduction of the CDF and increased prescribing in England compared with Wales for bevacizumab (PVR=3.28 (95% CI 2.59–4.14), P<0.001), but only marginal evidence of a modest association for sorafenib (PVR=1.29 (95% CI 1.00–1.67), P=0.05).
Figure 1.
Solid trend line (blue): England 3 monthly moving average. Dashed trend line (red): Wales 3 monthly moving average. Thick line-Cancer Drugs Fund established (October 2010). Solid line-NICE recommended decision. Dashed line-NICE not recommended decision. Rejected by NICE for all indications (sorafenib, bevacizumab). (A) Bevacixumab. (B) Sorafenib. The color reproduction of this figure is available on the BJC journal online.
Table 2. Mean prescribing volumes in England and Wales 12 months before and after the introduction of the CDF and PVR estimating the effect of the CDF.
| Drug | Country | Mean over 12-month pre-CDF period (10/2009 to 10/2010) (mg per 1000 pop) | Mean over post CDF period (11/2010 to 12/2012) (mg per 1000 pop) | PVR (95% CI)a | P-Value |
|---|---|---|---|---|---|
|
Group 1: Rejected by NICE for all indications pre-CDF | |||||
| Bevacizumab | E | 4.24 | 13.35 | 3.28 (2.59–4.14) | <0.001 |
| W | 4.56 | 7.47 | 1.0 | ||
| Sorafenib | E | 43.45 | 54.49 | 1.29 (1.00–1.67) | 0.050 |
| W | 214.07 | 219.35 | 1.0 | ||
|
Group 2: Mixed recommended and rejected decisions by NICE pre-CDF | |||||
| Imatinib | E | 643.16 | 616.82 | 1.35 (1.21–1.49) | <0.001 |
| W | 348.00 | 236.76 | 1.0 | ||
| Cetuximab | E | 8.21 | 14.65 | 1.29 (1.04–1.60) | 0.020 |
| W | 9.24 | 14.82 | 1.0 | ||
| Sunitinib | E | 18.70 | 15.27 | 0.93 (0.81–1.06) | 0.266 |
| W | 27.64 | 25.00 | 1.0 | ||
|
Group 3: Recommended for all indications by NICE pre-CDF | |||||
| Rituximab | E | 79.98 | 97.09 | 1.02 (0.93–1.13) | 0.655 |
| W | 85.54 | 98.66 | 1.0 | ||
| Capecitabine | E | 7955.36 | 5922.87 | 0.97 (0.91–1.04) | 0.422 |
| W | 8784.06 | 8698.37 | 1.0 | ||
| Lenalidomide | E | 6.31 | 9.53 | 1.11 (0.94–1.31) | 0.226 |
| W | 5.50 | 7.03 | 1.0 | ||
| PLDHb | E | 0.75 | 0.51 | 1.05 (0.48–2.31) | 0.897 |
| W | 0.81 | 0.42 | 1.0 | ||
| Bortezomib | E | 0.15 | 0.20 | 1.06 (0.89–1.27) | 0.509 |
| W | 0.13 | 0.16 | 1.0 | ||
|
Group 4: No NICE appraisal decision | |||||
| Lapatinib | E | 5.35 | 19.90 | 7.44 (5.81–9.54) | <0.001 |
| W | 12.39 | 8.41 | 1.0 | ||
| Panitumumab | E | 0.26 | 0.45 | 5.40 (1.20–24.42) | 0.028 |
| W | 0.76 | 0.39 | 1.0 | ||
Abbreviations: CDF=Cancer Drugs Fund; CI=confidence interval; E=England; NICE=National Institute for Health and Care Excellence; PVR=prescribing volume ratios; W=Wales.
The PVR for the effect of the CDF was estimated using a term for interaction between country and pre-/post-CDF period in a negative binomial regression model. The PVR is the additional effect of the CDF on prescribing trends in England compared with Wales.
PLDH Pegylated liposomal doxorubicin hydrochloride.
Group 2 (mixed NICE recommended and rejection decisions pre-CDF)
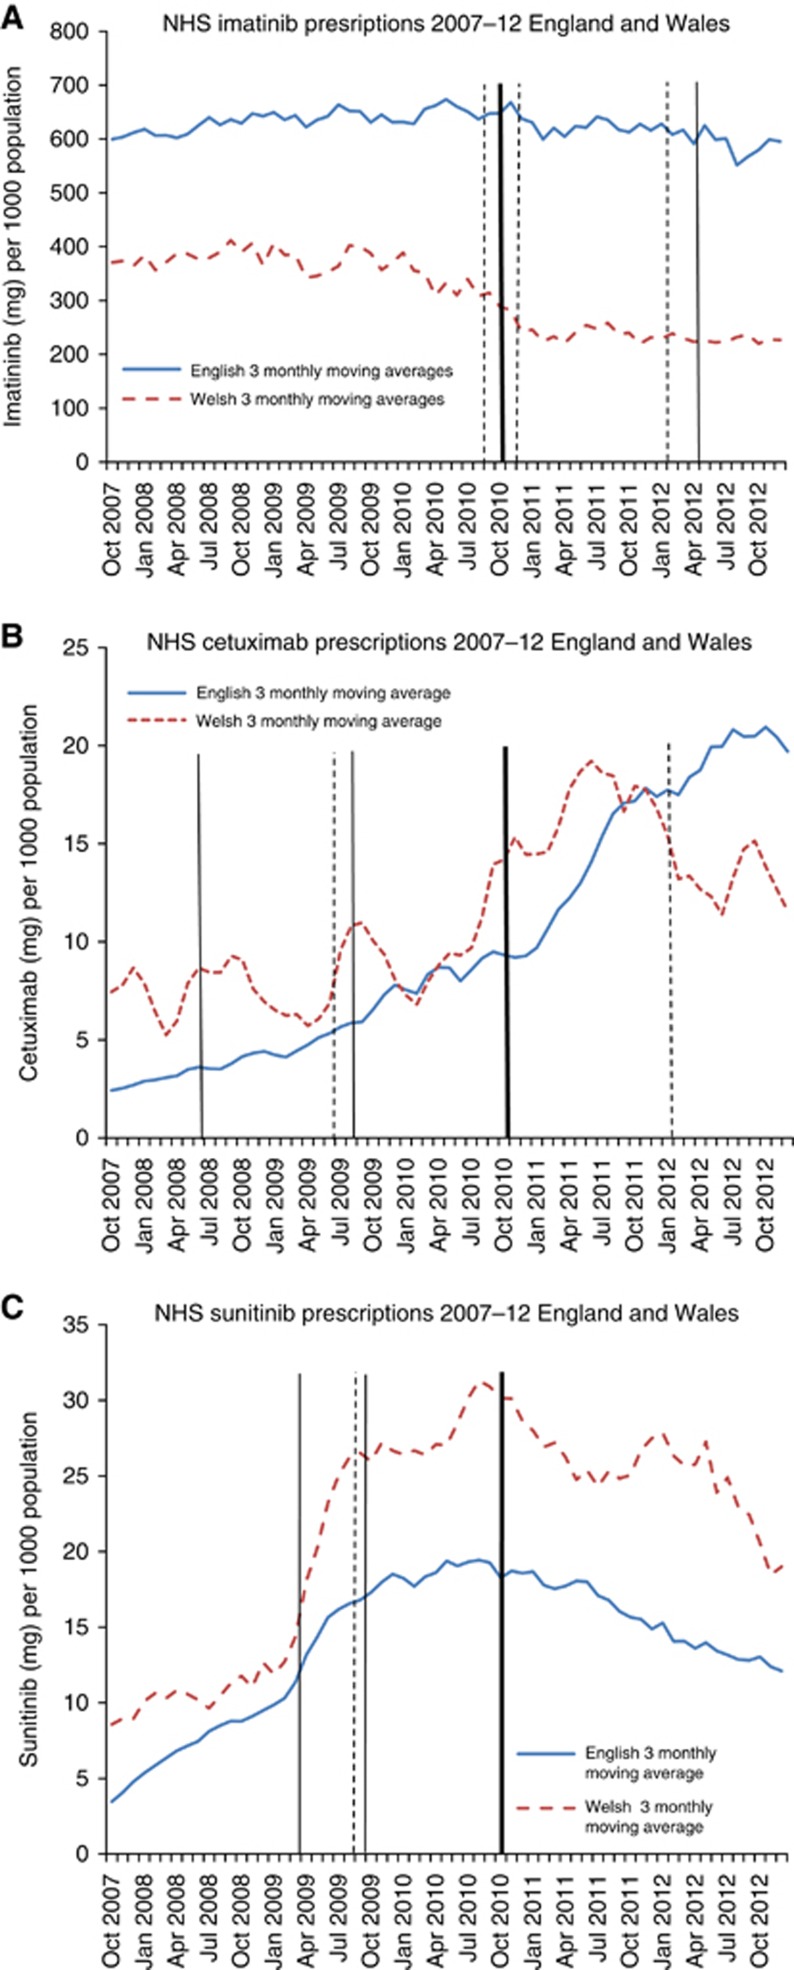
In the year pre-CDF, prescription rates of imatinib were substantially higher in England compared with Wales (Figure 2A). Immediately prior to the CDF, following the first NICE rejection, imatinib prescribing in Wales declined, whereas imatinib prescribing in England declined more slowly despite two further post-CDF NICE rejections. Regression analysis demonstrated strong evidence of a modest association between the introduction of the CDF and increased prescribing in England compared with Wales (PVR=1.35 (95% CI 1.21–1.49), P<0.001) (Table 2). Cetuximab prescribing in the year pre-CDF was slightly higher in Wales than in England (Figure 2B). The post CDF prescription rate rose faster in England, and was higher than Wales from January 2012 onwards. There was strong evidence of a modest association between the CDF and increased prescribing in England compared with Wales (PVR 1.29 (1.04 to 1.60), P=0.02) (Table 2). Prescribing volumes of sunitinib declined in England and Wales (18.3% England, 9.6% Wales) following the introduction of the CDF. Sunitinib had received two NICE recommendations and one rejection in 2009, pre-CDF (Box 1). There was no good evidence of an association between the CDF and prescribing of sunitinib in England, compared with Wales (PVR=0.93 (95% CI 0.81–1.06), P=0.27) (Table 2).
Figure 2.
Solid trend line (blue): England 3 monthly moving average. Dashed trend line (red): Wales 3 monthly moving average. Thick line-Cancer Drugs Fund established (October 2010). Solid line-NICE recommended decision. Dashed line-NICE not recommended decision. Mixed recommended and rejected decisions by NICE pre-CDF (imatinib, cetuximab, sunitinib). (A) Imatinib. (B) Cetuximab. (C) Sunitinib. The color reproduction of this figure is available on the BJC journal online.
Group 3 (NICE recommended for all indication(s) pre-CDF)
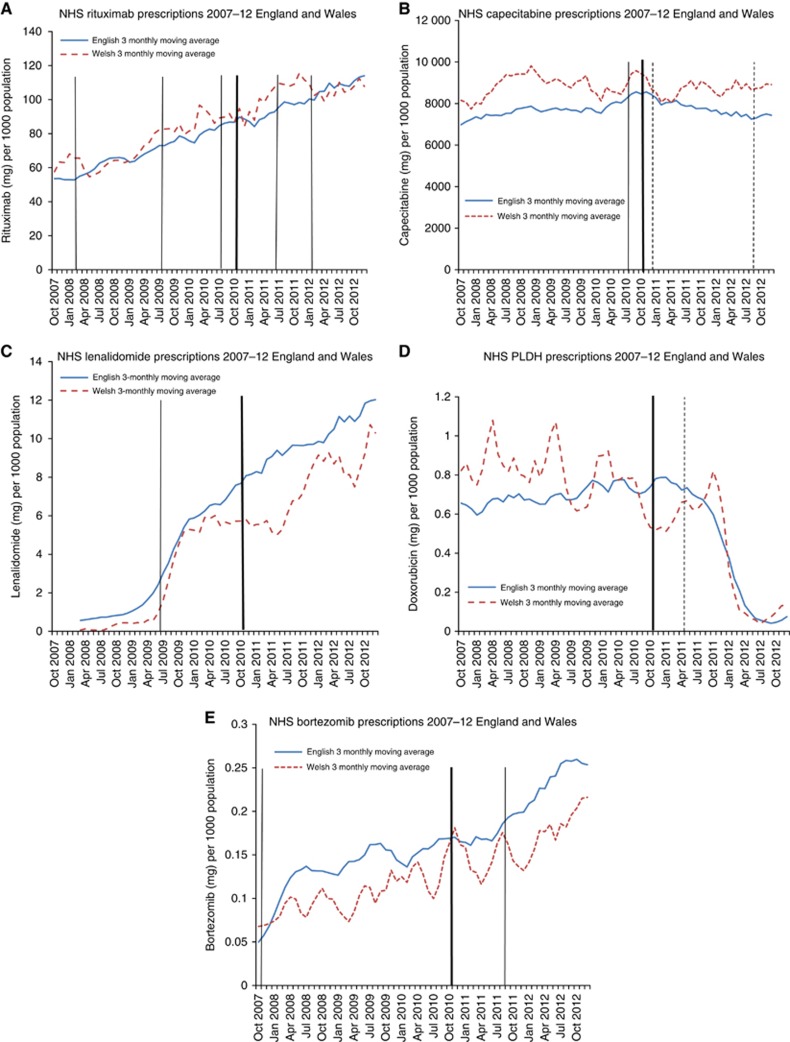
There was no evidence the CDF influenced prescribing of NICE recommended drugs in England, compared with Wales (all PVR confidence intervals include 1.00, all P>0.2) (Table 2, Figure 3A–E). For most of these drugs, prescribing increased in England and Wales following NICE ‘recommended' verdicts. A sharp decline in pegylated liposomal doxorubicin hydrochloride prescribing occurred in England and Wales in the period after the NICE rejection (April 2011) (Figure 3D).
Figure 3.
Solid trend line (blue): England 3 monthly moving average. Dashed trend line (red): Wales 3 monthly moving average. Thick line-Cancer Drugs Fund established (October 2010). Solid line-NICE recommended decision. Dashed line-NICE not recommended decision. Recommended by NICE for all indications pre-CDF (rituximab, capecitabine, lenalidomide, doxorubicin, bortezomib). (A) Rituximab. (B) Capecitabine. (C) Lenalidomide. (D) Pegylated liposomal doxorubicin hydrochloride (PLDH). (E) Bortezomib. The color reproduction of this figure is available on the BJC journal online.
Group 4 (drugs awaiting NICE appraisal pre-CDF)
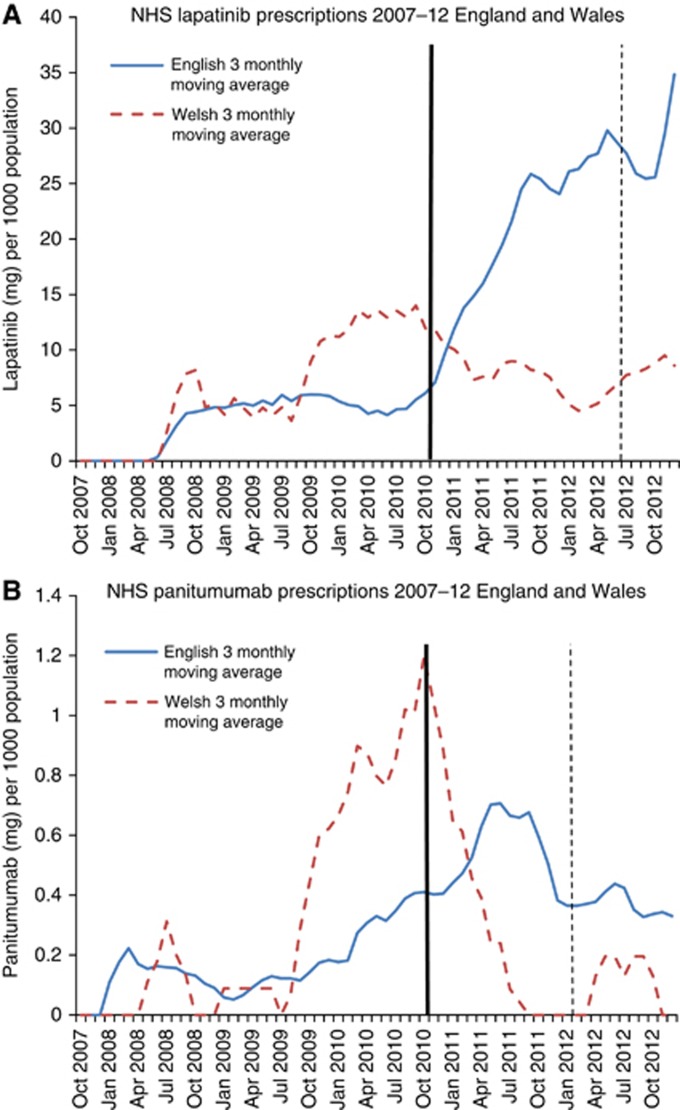
Following the CDF, English and Welsh prescribing volumes diverged dramatically: compared with the year pre-CDF, lapatinib prescription volume increased nearly three-fold (2.72) in England while prescription volumes declined by 32.1% in Wales. Panitumumab prescribing increased by 73.1% in England compared with a 48.7% drop in Wales (Figure 4A and B). Regression analysis (Table 2) showed strong evidence of a large association between the CDF and increased prescribing in England compared with Wales for both drugs (lapatinib PVR 7.44 (95% CI 5.81–9.54), P<0.001, panitumumab PVR 5.40 (95% CI 1.20–24.42), P=0.03). NICE subsequently rejected both lapatinib and panitumumab on the grounds of cost-effectiveness (Box 1).
Figure 4.
Solid trend line (blue): England 3 monthly moving average. Dashed trend line (red): Wales 3 monthly moving average. Thick line-Cancer Drugs Fund established (October 2010). Solid line-NICE recommended decision. Dashed line-NICE not recommended decision. No NICE appraisal pre-CDF (lapatinib, panitumumab). (A) Lapatinib. (B) Panitumumab. The color reproduction of this figure is available on the BJC journal online.
Group 5 (more recent drugs)
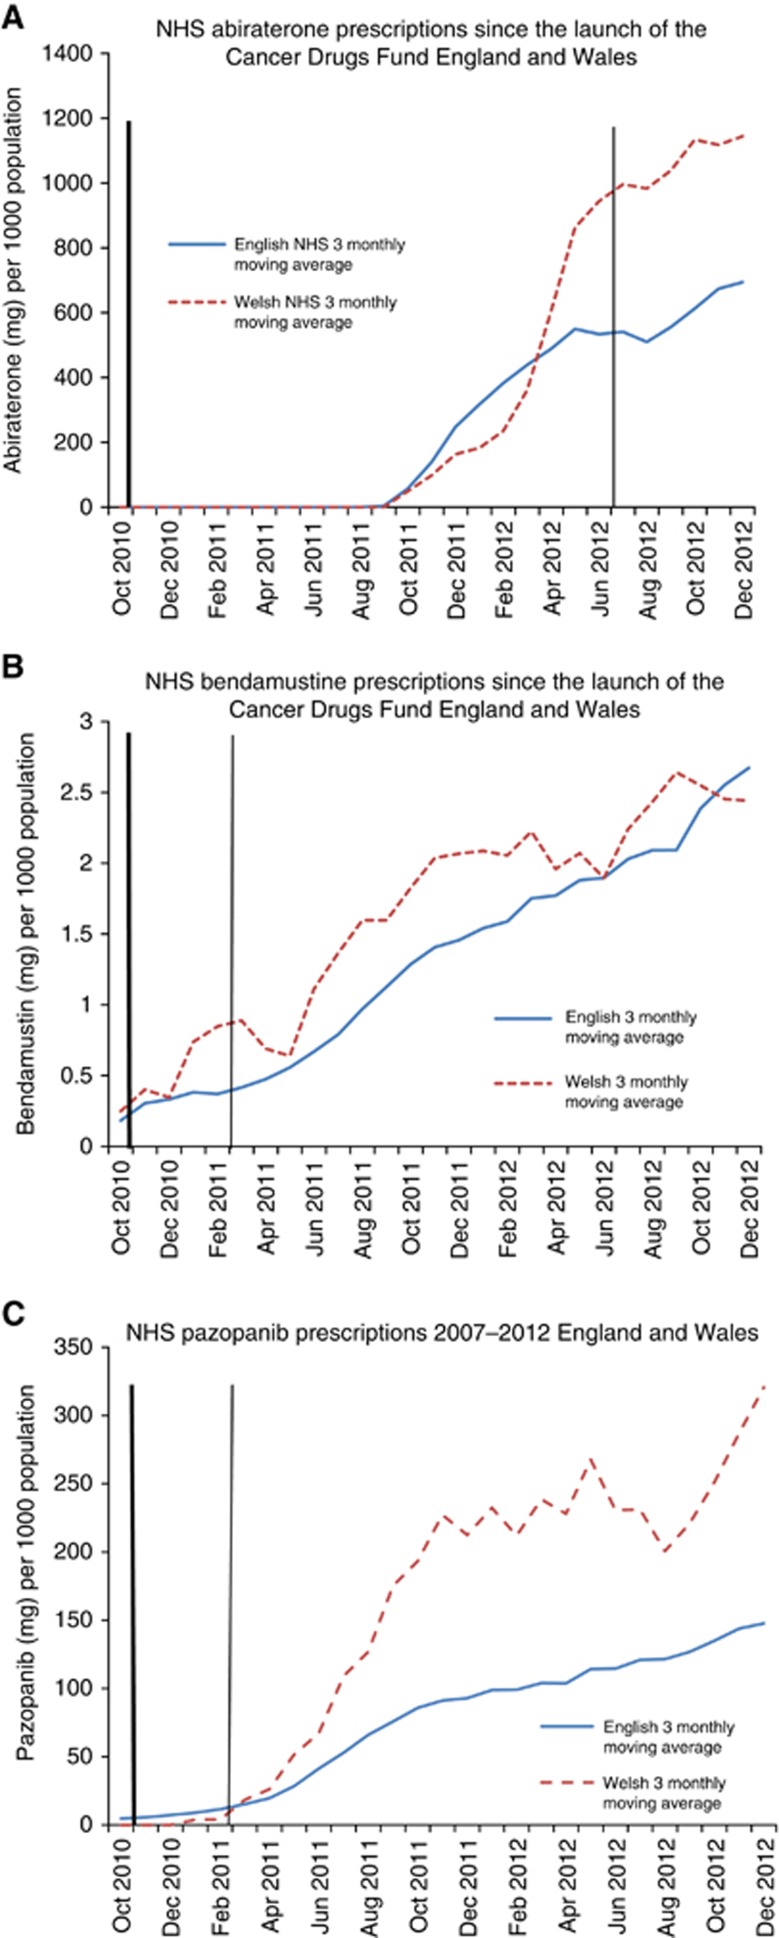
All three recently released drugs (abiraterone, bendamustine and pazopanib) had lower prescribing volumes in England than in Wales: abiraterone, 22% lower in England, PVR=0.78 (95% CI 0.61–0.99), P=0.04; bendamustine, 25% lower in England, PVR=0.75 (95% CI 0.64–0.88), P=0.002, and pazopanib, 49% lower in England, PVR=0.51 (95% CI 0.28–0.96), P=0.04. All three drugs were recommended by NICE following the introduction of the CDF (2011/12) (Table 3, Figure 5A–C).
Table 3. Prescribing volume ratios of recently launched drugs.
| Group 5: Recently launched drugs | Country | Mean over period (since CDF or drug launcha) mg per 1000 pop | Prescribing volume ratio (95% CI) E vs Wb | P-value |
|---|---|---|---|---|
| Abiraterone | E | 463.69 | 0.78 (0.61–0.99) | 0.043 |
| W | 619.69 | 1.0 | ||
| Bendamustine | E | 1.12 | 0.75 (0.64–0.88) | 0.002 |
| W | 1.35 | 1.0 | ||
| Pazopanib | E | 62.32 | 0.51 (0.28–0.96) | 0.036 |
| W | 123.68 | 1.0 |
Abbreviations: CDF=Cancer Drugs Fund; CI=confidence interval; E=England; W=Wales.
Where the launch of the drug occurred after the introduction of the CDF, means are from drug launch: for example, Abiraterone September 2011.
These regression analyses are based on the period from the start of the CDF or drug launch (whichever came first) to the end of the study period. The prescribed volume ratio represents the rate of prescribing in England compared with Wales during this period.
Figure 5.
Solid trend line (blue): England 3 monthly moving average. Dashed trend line (red): Wales 3 monthly moving average. Thick line-Cancer Drugs Fund established (October 2010). Solid line-NICE recommended decision. Dashed line-NICE not recommended decision. Recently launched (<3months) pre-CDF or launched after the CDF (abiraterone, bendamustine, pazopanib). (A) Abiraterone. (B) Bendamustine. (C) Pazopanib. The color reproduction of this figure is available on the BJC journal online.
Discussion
The CDF was strongly associated with higher prescription volumes in England compared with Wales for the majority of drugs, which NICE had rejected for some or all indications pre-CDF and for drugs, which NICE had not appraised pre-CDF, but subsequently rejected. Drugs that were recommended by NICE prior to the CDF showed no evidence of an effect of the CDF on prescribing in England compared with Wales. Contrary to our hypothesis, Wales had faster adoption of the most recent drugs launched in 2010/11 and subsequently recommended by NICE. These results suggest that drugs deemed not cost-effective by NICE are accessed more in England than in Wales. There is no evidence that the CDF results in faster uptake of drugs later demonstrated to be cost-effective.
We have used an established data source to quantify high-cost cancer drug prescribing volumes over a period of radical change in access to cancer drugs. The implementation of the CDF in England but not in Wales provided a natural before-and-after controlled ‘experiment'. We randomly selected drugs, stratified by NICE recommendation, in order to explore the interplay between the CDF and NICE guidance. The use of longitudinal data allows trend analysis, rather than using a more limited ‘snapshot' in time which may obscure the complexities of evolving NICE recommendations.
We chose not to adjust for age-standardised incidence of cancer in England and Wales in our model. Appropriate adjustment for eligibility for the cancer drugs evaluated in our study would require data on staging and comorbidities. This level of detail is not routinely available. Differences in clinical need for chemotherapy might account for some differences in prescribing volumes between England and Wales, but cannot account for the dramatic divergence in post-CDF prescribing of drugs such as bevacizumab or lapatinib.
There are important potential limitations with IMS Health data. Hospitals were unable to supply data for around 3% of months to IMS Health and those drugs prescribed in the community, via homecare, privately, or as part of clinical trials have not been fully captured.
IMS Health data cannot be disaggregated by indication; hence, trends in drugs prescribed for multiple conditions (e.g. rituximab) or multiple cancer types (e.g. bevacizumab) are challenging to interpret. Furthermore, drugs that are currently ‘approved in all indications' might be prescribed for an indication that has not yet been NICE appraised and might not be recommended by NICE in the future. Similarly, historical NICE approval status is not always a good indicator of the current cost-effectiveness of a drug. Also, we cannot adjust for cross-border flows of patients, particularly for rarer cancers with more centralised care, because IMS Health data is collated by hospital rather than by patient residence. However, as Welsh residents cannot access the CDF even when treated in an English hospital, this is unlikely to account for the post-CDF divergence observed, not withstanding the possibility that some patients relocate residence to England after diagnosis (Borland, 2013). Finally, CDF funding may have knock-on effects on the treatment pathway. Drugs funded by the CDF may supplant those approved by NICE, or move these to a different line of therapy. There is perhaps such an interaction between sunitinib, sorafenib, everolimus, pazopanib and axitinib in renal cell carcinoma, which may explain some of the differences between England and Wales.
Regional geographical variation in cancer prescribing is not unique to UK and there is a growing literature on international variability in access to cancer drugs (Jonsson and Wilking, 2007; Verma et al, 2007; Kos et al, 2008; Richards, 2010; Ragupathy et al, 2012). In 2010, a UK report comparing international variability in the use of cancer and non-cancer pharmaceuticals found that ‘countries that spend the most on health do not always have the highest levels of (drug) usage and low spenders can be high users of drugs' (Richards, 2010). A number of social and geographical factors have been shown to influence access to appropriate cancer chemotherapy (Patel et al, 2007; Faden et al, 2009; Crawford et al, 2012). In 2004, ‘constraints in service capacity and differences in clinical practice' were highlighted as the main cause of variation in UK prescribing of cancer drugs (Richards, 2004). Geographical variation in clinical practice is not unique to cancer and has been shown to be multifactorial (Appleby et al, 2011). There have been limited peer-reviewed publications on cancer drug prescribing in the UK since the introduction of the CDF. One empirical analysis of prescribing in England considered time-trends in five commonly prescribed CDF drugs. The results demonstrated a post-CDF increase in prescribing for all five drugs. However, the increase was less than anticipated suggesting that in actual practice, drugs were used for shorter periods or at lower doses than in the clinical trials (Stephens and Thomson, 2012).
Widely cited reports from the grey literature (Rarer Cancers Foundation, 2011b, 2011c) suggest that ‘people in Wales are now more than five times less likely to gain access to a cancer drug that is not routinely available than people in England'. However these results were based on Freedom of Information requests covering different periods for Wales (October 2009 to December 2010) and England (October 2010 to March 2011) (Rarer Cancers Foundation, 2011c). Response to FOI requests tends to be variable (Rarer Cancers Foundation, 2011a) and their accuracy is unknown. The report was restricted to drugs prescribed through the CDF in England and drugs prescribed via 'Individual funding panels' in Wales. Therefore, it did not capture drugs prescribed via other routes (e.g. clinical trials or off-label settings). The IMS Health data are collected by hospital pharmacies and are not as restricted. This may account for the higher volume of prescribing for some drugs (e.g. sunitinib) observed in our study.
The intention of the CDF was to provide greater access to cancer drugs, including those judged by NICE to be not cost-effective and previously only available in ‘exceptional' cases. The CDF also intended to increase clinician involvement in cancer drug decision panels (Stanton, 2010) and reduce delay in access to drugs resulting from time taken in NICE appraisal. Critics of the CDF argue that the use of public money to access drugs that are not cost-effective would introduce new inequity into NHS care because of the opportunity cost for other patients if the NHS spends money inefficiently (Howell, 2011; Thornton, 2011). Using the CDF to routinely finance treatments that are outside their licensed indication (‘off-label') and outside the NHS exceptionality processes or trial settings, may result in ethical concerns. For instance, there could be provision of less-evidence based or unlicensed care to patients, where alternative, more cost-effective treatment exists. Evidence that investment in pharmaceuticals is the most effective method to improve cancer survival in the UK is highly contentious, and focusing on other aspects of diagnosis and care may improve survival more significantly (Foot and Harrison, 2011). The reason for favouring cancer over other leading causes of mortality and morbidity, such as heart disease, is also controversial with preliminary research indicating the public do not support the assertion that cancer is of greater importance (Linley and Hughes, 2013).
Our finding of higher than anticipated prescribing of the three newer drugs in Wales has several potential explanations. As Wales is a relatively small country, prescribing volumes may simply reflect the practice patterns of a small number of prescribers who participate in trials or prescribers who are otherwise early adopters of the new drugs. However, the CDF may also have an indirect role. For example, uptake of abiraterone may be faster in Wales, as there is more restricted access to alternative prostate cancer drugs (e.g. Cabazitaxel), which have been rejected by NICE. Similarly greater pazopanib use in Wales may also reflect preferential use over drugs (e.g. bevacizumab) judged not cost-effective by NICE for renal cell carcinoma. If this finding is replicated for other new drugs, it may be indicative that by encouraging use of drugs deemed not cost-effective by NICE, the CDF may be impacting on early adoption of subsequent drugs that are more cost-effective.
We have demonstrated that access to cancer drugs in England has improved for some patients since the launch of the CDF. However, the persistent increase in prescribing of drugs, which are deemed not cost-effective by NICE has important implications for NHS resource allocation in England. The ramifications of the CDF for Scotland and Wales, where patients cannot easily access these cancer drugs, but who may experience a ‘creep' in prescribing as a result of decisions on their borders, also raises ethical, moral, financial and policy concerns. In the short term, research into the effect of the CDF on English regional variation in cancer drug prescribing, and into the effect of the new National Cohort List (NHS England, 2013b) (April 2013) is needed. In the long-term, further research into public preferences for therapy for cancer vs other diseases and mechanisms, such as value-based pricing (Hughes, 2011), for making effective therapies available to the NHS for an appropriate price are needed.
The CDF was associated with increased prescribing in England compared with Wales of drugs deemed by NICE to be not cost-effective for some or all indications. We observed faster uptake in Wales of three recently launched cancer drugs subsequently recommended by NICE, indicating that the CDF does not necessarily speed up access to new cost-effective drugs, as previously speculated.
Acknowledgments
We would like to acknowledge Kate Tilling, Professor of Medical Statistics, for her advice on the paper. This work is produced by Charlotte Chamberlain (and co-authors) under the terms of the Doctoral research training fellowship issued by the NIHR. The views expressed in this publication are those of the authors and not necessarily those of the NHS, The National Institute for Health Research or the Department of Health. Ethical approval was obtained from South West Research Ethics Committee.
Author contributions
WH (senior author) conceived and designed the study, which was peer-reviewed by the NIHR as part of a fellowship proposal for CC. WH also supervised the analysis and drafting of the report. CC (first author) conducted the analysis and drafted all versions of the report. SC conceived and participated in the analysis plan and assisted in drafting the paper. PS was responsible for data collection, helped interpret the data findings and edited the draft. JD provided PhD supervision of the first author and edited and advised on the draft paper. AB provided clinical advice on interpretation of the findings and assisted in drafting the paper. All authors contributed to the critical review of the final draft.
The authors declare no conflict of interest.
References
- Appleby J, Raleigh V, Frosini F, Bevan G, Gao H, Lyscom T.2011. Variations in Health Care. The good, the bad and the inexplicable.
- Borland S.2013. Welsh patients move to England to get NHS cancer drugs because they're four times less likely to get them than those across the border. Mail Online. http://www.dailymail.co.uk/news/article-2402002/Welsh-patients-England-NHS-cancer-drugs.html .
- Cancer Research UK 2013. Government announces extension of Cancer Drugs Fund, Cancer News. http://www.cancerresearchuk.org/cancer-info/news/archive/cancernews/2013-09-28-Government-announces-extension-of-Cancer-Drugs-Fund ( accessed 28 September 2013).
- Coleman M. Not credible: a subversion of science by the pharmaceutical industry. Commentary on ‘A glocal comparison regarding patient access to cancer drugs. Annal Oncol. 2007;18 (suppl 3:1–75. doi: 10.1093/annonc/mdm363. [DOI] [PubMed] [Google Scholar]
- Crawford SM, Sauerzapf V, Haynes R, Forman D, Jones AP. Social and geographical factors affecting access to treatment of colorectal cancer: a cancer registry study. BMJ Open. 2012;2 (2:e000410. doi: 10.1136/bmjopen-2011-000410. [DOI] [PMC free article] [PubMed] [Google Scholar]
- Department of Health 2010. £50 million kick-starts greater access to cancer drugs. London, Crown Copyright. http://webarchive.nationalarchives.gov.uk/20130107105354/http://www.dh.gov.uk/en/MediaCentre/Pressreleases/DH_120037 .
- Department of Health 2013. The NHS Constitution. The NHS belongs to us all. Crown Copyright. http://www.nhs.uk/choiceintheNHS/Rightsandpledges/NHSConstitution/Documents/2013/the-nhs-constitution-for-england-2013.pdf .
- Faden RR, Chalkidou K, Appleby J, Waters HR, Leider JP. Expensive cancer drugs: a comparison between the United States and the United Kingdom. Milbank Q. 2009;87 (4:789–819. doi: 10.1111/j.1468-0009.2009.00579.x. [DOI] [PMC free article] [PubMed] [Google Scholar]
- Foot C, Harrison T. How to Improve Cancer Survival, Explaining England's Relatively Poor Rates. The King's Fund and Cancer Research UK: Cavendish Square, London; 2011. [Google Scholar]
- Ford J. The NHS is facing a deepening financial crisis. BMJ. 2013;347:4422. doi: 10.1136/bmj.f4422. [DOI] [PubMed] [Google Scholar]
- Howell J. Return of the postcode lottery. Opportunity cost of the Cancer Drugs Fund. Brit Med J. 2011;342:d622. [Google Scholar]
- Hughes DA. Value-based pricing incentive for innovation or zero net benefit. Pharmacoeconomics. 2011;29 (9:731–735. doi: 10.2165/11592570-000000000-00000. [DOI] [PubMed] [Google Scholar]
- Jonsson B, Wilking N. Market uptake of new oncology drugs. Ann Oncol. 2007;18:31–48. [Google Scholar]
- Kim H, Kriebel D. Regression models for public health surveillance data: a simulation study. Occup Environ Med. 2009;66 (11:733–739. doi: 10.1136/oem.2008.042887. [DOI] [PubMed] [Google Scholar]
- Kos M, Obradovic M, Mrhar A. Accessibility to targeted oncology drugs in Slovenia and selected European countries. Eur J Cancer. 2008;44 (3:408–418. doi: 10.1016/j.ejca.2007.11.020. [DOI] [PubMed] [Google Scholar]
- Lichtenberg FR. The effect of new cancer drug approvals on the life expectancy of American cancer patients, 1978-2004. Econ Innovat New Technol. 2009;18 (5:407–428. [Google Scholar]
- Linley WG, Hughes DA. Societal views on NICE, cancer drugs fund and value-based pricing criteria for prioritising medicines: a cross-sectional survey of 4118 adults in Great Britain. Health Econ. 2013;22 (8:948–964. doi: 10.1002/hec.2872. [DOI] [PubMed] [Google Scholar]
- NHS England 2013. 2013/14 NHS Standard Contract For Cancer: Chemotherapy (Adult). http://www.england.nhs.uk/wp-content/uploads/2013/06/b15-cancr-chemoth.pdf .
- NHS England 2013. New single drug fund list to bring fairer system for cancer patients. http://www.england.nhs.uk/2013/04/04/cdf/ .
- Office for National Statistics 2011. Mid-1971 to mid-2010 population estimates: United Kingdom; estimated resident population for constituent countries and regions in England. http://www.ons.gov.uk/ons/rel/pop-estimate/population-estimates-for-uk--england-and-wales--scotland-and-northern-ireland/population-estimates-timeseries-1971-to-current-year/index.html .
- Patel N, Adatia R, Mellemgaard A, Jack R, Moller H. Variation in the use of chemotherapy in lung cancer. Brit J Cancer. 2007;96 (6:886–890. doi: 10.1038/sj.bjc.6603659. [DOI] [PMC free article] [PubMed] [Google Scholar]
- Ragupathy R, Aaltonen K, Tordoff J, Norris P, Reith D. A 3-Dimensional view of access to licensed and subsidized medicines under single-payer systems in the US, the UK, Australia and New Zealand. Pharmacoeconomics. 2012;30 (11:1051–1065. doi: 10.2165/11595270-000000000-00000. [DOI] [PubMed] [Google Scholar]
- Rarer Cancers Foundation 2011. Exceptional Cymru? An audit of the progress made in improving access to treatment for people with rarer cancers in Wales. http://www.rarercancers.org.uk/images/stories/cdf/p8and9/exceptional%20cymru%20-%20april%202011.pdf .
- Rarer Cancers Foundation 2011. Funding Cancer Drugs, an evaluation of the impact of policies to improve access to cancer treatments. http://www.rarercancers.org/images/stories/news/pdf/0611/funding_cancer_drugs_final.pdf .
- Rarer Cancers Foundation 2011. Nations Divided? An assessment of variations in access to cancer treatments for patients in England, Scotland and Wales. http://www.rarercancers.org/images/stories/news/8011/nations_divided_final_complete_report.pdf .
- Richards M.2004. Variations in usage of cancer drugs approved by NICE Report of the review undertaken by the National Cancer Director, Crown Copyright: Department of Health.
- Richards M.2010Extent and causes of international variations in drug usage. Department of Health, Crown Copyright.
- Stanton M.2010. The Cancer Drugs Fund: a consultation. London: Department of Health, Crown Copyright.
- Stephens P, Thomson D. The Cancer Drug Fund 1 year on--success or failure. Lancet Oncol. 2012;13 (8:754–757. doi: 10.1016/S1470-2045(12)70273-5. [DOI] [PubMed] [Google Scholar]
- Sullivan R, Peppercorn J, Sikora K, Zalcberg J, Meropol NJ, Amir E, Khayat D, Boyle P, Autier P, Tannock IF, Fojo T, Siderov J, Williamson S, Camporesi S, McVie JG, Purushotham AD, Naredi P, Eggermont A, Brennan MF, Steinberg ML, De Ridder M, McCloskey SA, Verellen D, Roberts T, Storme G, Hicks RJ, Ell PJ, Hirsch BR, Carbone DP, Schulman KA, Catchpole P, Taylor D, Geissler J, Brinker NG, Meltzer D, Kerr D, Aapro M. Delivering affordable cancer care in high-income countries. Lancet Oncol. 2011;12 (10:933–980. doi: 10.1016/S1470-2045(11)70141-3. [DOI] [PubMed] [Google Scholar]
- The Information Centre for Health and Social Care 2012. Hospital prescribing England, In The Health and Social Care Information Centre. Vol. 2013.
- Thornton S. Return of the postcode lottery Cancer Drugs Fund is not a fair allocation of NHS resources. Br Med J. 2011;342:d621. [Google Scholar]
- Verma S, Sehdev S, Joy AA. Cancer therapy disparity: unequal access to breast cancer therapeutics and drug funding in Canada. Curr Oncol. 2007;14 (Suppl 1:S3–S10. doi: 10.3747/co.2007.153. [DOI] [PMC free article] [PubMed] [Google Scholar]
- Wilking N, Jonsson B. A Pan-European Comparison Regarding Patient Access to Cancer Drugs. Karolinska Institutet in collaboration with Stockholm School of Economics: Stockholm, Sweden; 2005. [Google Scholar]


