Abstract
Recent studies in rehabilitation have shown potential benefits of patient-initiated exploratory practice. Such findings, however, lead to new challenges in how to quantify and interpret movement patterns. We posit that changes in coordination are most evident in statistical distributions of movements. In a test on 10 chronic stroke subjects practicing for 3 days, we found that inter-quartile range of motion did not show improvement. However, a multivariate Gaussians analysis required more complexity at the end of training. Beyond simply characterizing movement, linear discriminant classification of each patient’s movement distribution also identified that each patient’s motor deficit left a unique signature. The greatest distinctions were observed in the space of accelerations (rather than position or velocity). These results suggest that unique deficits are best detected with such a distribution analysis, and also point to the need for customized interventions that consider such patient-specific motor deficits.
Keywords: robotic rehabilitation, upper extremity, customization
I. Introduction
Recent investigations suggest that sensorimotor training with interactive technology can improve upper extremity function [1], yet the fundamental principles for designing effective therapy have remained elusive. One key challenge is accommodating the wide differences in impairments, which can include loss of sensation, spasticity, imbalanced muscle strength [2, 3], jerky movements [4, 5], abnormal muscle coupling [6] and point to point reaching inaccuracies [7], each at varying levels of severity [8-10]. Such variation creates challenges for assessment [11, 12]. Hence, more comprehensive characterization of patient deficits could be a great asset to improving therapy.
An important lesson from robotic therapy studies is that patients fail to improve when limbs are moved for them [13-15]. Exploratory practice could promote a greater sense of agency since the individual must make continuing choices of where to and how to express movement. Such practice might also facilitate generalization, in a manner similar to the effect of introducing task variety [16, 17]. Exploratory movements are thought to be an important part of motor learning in human development [18, 19], and hence could support neuroplasticity in rehabilitation. Training over a broader domain, for example on a variety of tasks, provides better improvement in function than repetitions of the same task [16, 17], and might facilitate “system identification” as a part of learning [20].
Besides the impact on training, analysis of self-directed movement practice could allow for new tools for characterizing motor deficits. Historically, approaches in robot-assisted therapy began with guidance [21, 22], which restricts movement to prescribed patterns. The variable nature of exploratory movement, on the other hand, reveals information about an individual’s deficits through their movement tendencies. Movements following stroke exhibit stereotypic gestures that are thought to reflect abnormal muscle tone or coupling between joints [6], referred to by some as synergies. Stroke research suggests that forced-use, where the patient is encouraged to make actions with the impaired limb, can reverse the impact of “learned non-use” [23-25]. In a similar way, neglect of movement patterns might perpetuate abnormal coordination. A rationale for this study is that analysis of self-directed movement will allow identification of individual characteristics of motor deficits.
This study investigated how patterns of movement within motor exploration evolve with practice and to what extent they differ between individuals. Our recent work showed that motor exploration combined with negative viscosity from a robotic interface (which exaggerates movements) enhanced learning in healthy subjects and in stroke survivors [26, 27]. Here, we consider new analyses on the data from our previous work with stroke survivors. Focusing on the control condition where no external forces were applied, we examine how the statistical distribution of kinematic variables (position, velocity, acceleration) changes over the course of training. One possibility is that motor deficits manifest as uncoordinated and highly variable movements, such that no systematic patterns can be found. Alternatively, distributions potentially could reveal stereotyped patterns that correspond to an individual’s unique form of motor impairment, and show tangible broadening of capability as the subject trains.
II. Methods
A. Humans Subjects
We consider data from a study in which stroke survivors performed manual exercises with and without robot-applied external forces [28]. Subjects performed the task with their affected arm. Each subject provided informed consent in accordance with the University Institutional Review Boards. Individuals were paid for their participation.
B. Experiment Protocol
We asked subjects to control the movement of a planar force-feedback device as described in our previous work [28]. To focus training on the coordination of the forearm and upper arm, subjects operated the device through a wrist brace. Using an overhead projector mounted on the ceiling, real-time feedback of the handle position, visual reference cues, and experiment instructions were presented on a horizontal surface overlaying the planar workspace of the arm (see Fig. 1). In addition, the real-time animation included two segments approximating the motion of the forearm and upper arm. Visual reference cues included a larger rectangular region, indicating the bounds of movement for the motor exploration portions of the experiment.
Fig. 1.
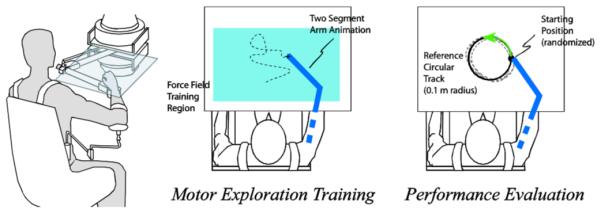
The robotic device interfaced to the arm about a free pivot at the wrist. Subjects were allowed to freely interact with each load in a “motor exploration” stage. Following exploration, subjects made counter-clockwise circular movements during task performance trials at random starting locations of a 0.1 m radius circular track. Only the motor exploration data was analyzed in the current work.
During the motor exploration phases, we instructed subjects to move the handle at their own discretion using a variety of directions, speeds, and positions within the rectangular workspace (0.2 x 0.6m). We explained that each exploration phase should serve as preparation for a subsequent evaluation phase in which subjects would perform prescribed circular movements. The computer signaled the user to halt motor exploration after 25 m of handle endpoint travel.
Subjects performed three sessions on different days. Each session included several alternating training phases (16) and evaluation trials (160). The intervals between training phases varied between 4 or 20 trials, as shown in Fig. 3. We included different intervals of performance evaluation to test possible differences in retention. Each session included two 1-hour blocks, with a 15-minute intervening break.
Fig. 3.
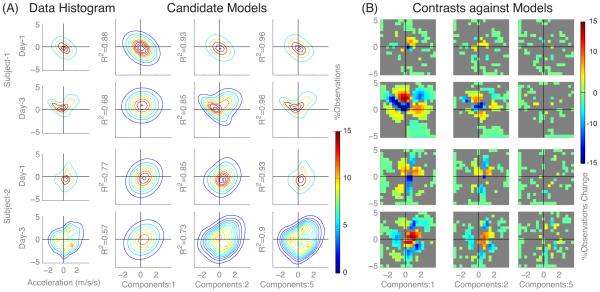
(A) Contour plots of acceleration histograms (for two typical subjects) versus multivariate normal functions with 1, 2, and 5 components, reveal new movement patterns from Day-1 and Day-3 (Red/blue indicates greater/lesser observations). (B) Contrasts of histograms versus model functions indicate lower contrast with increasing components (columns), and higher contrast on Day-3 compared to Day-1. The color gradation (red/blue) indicates differences (greater/lesser) in the data compared to the models. These results show irregular changes in movement distribution across workspace.
C. Analysis
Range of motion
This study investigates whether distribution analysis can provide a more complete description of the changes in movement patterns as stroke survivors practice. As a point of comparison we first obtain the classic estimates of overall changes in ranges by calculating inter-quartile differences. We summarize the results in terms of the change in displacement area (position data), and analogously for velocity and acceleration, as the products of two axes of motion (left-right and fore-aft, defined as x and y degrees of freedom).
Next, to obtain a more detailed view of how movement patterns varied throughout the workspace, we tabulated histograms in 2D. Contrasts of significant beginning-to-end histogram counts gauged the effect of training.
Analysis of model components
We next examined whether modeling analysis of distributions could reveal changes in available movement patterns. To do so we fitted these histograms with a weighted sum of multivariate Gaussian-normal components according to maximum likelihood estimates:
| (Eq-1) |
for k dimensions. Each j-th component is associated with a covariance matrix s, and a center μ. Increasing the number of components J improved model fitness. We fit this model to the observed hand motion distributions for each exploration trial, resulting in two-dimensional histograms for position, velocity and acceleration were normalized so that sum of observations was unity. The coefficient of determination measured models fit. Movement pattern complexity was related to model fitness was compared over the course of training sessions. We summarized the results in terms of the change between the first and the last day of training (Day 1 and Day 3).
Individual differences: To determine whether individuals’ histograms could be uniquely identified, we performed classification analysis. Training and test sets were constructed from alternating trials. A reduced set of classification ‘features’ were obtained from histogram bins that were significantly different than the group mean containing over 0.5% of data. We then performed linear discriminant analysis (LDA) classification with the selected features, using ‘classify’ function with MATLAB software (MATHWORKS, Natick, MA), and presented a confusion matrix of predictions versus actual subject identifiers. To characterize the performance of the classifier, we computed the overall error rate for successful identification of trials and an error rate for successful identification of the test data as a whole for each subject.
III. Results
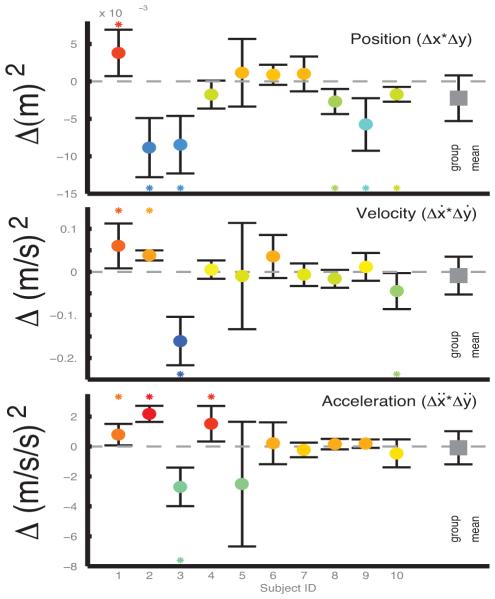
Changes in the range of motion in terms of position, velocity and acceleration were not detected according to analysis inter-quartile ranges (See Fig. 2). The change in the range of motion from day 1 and 3 was not significant in terms of the interval between the 25th and 75th percentiles of data (p=0.13, 0.67, 0.87; product of inter-quartile change for x and y degrees of freedom) for displacement (−0.0022±0.00043 m2), velocity (0.0087±0.062 (m/s)2), or acceleration (0.084±1.55 (m/s/s)2). Individual degrees of freedom in x, y, ẋ, ẏ, and ẍ, ÿ showed similar trends (p=0.94, 0.04, 0.61, 0.83, 0.29, 0.68). The trend shown for x-velocity was actually a decrease from (0.090±0.022 m/s) to (0.078±0.028 m/s).
Fig. 2.
The inter-quartile range (expressed here as the product of x and y axes) for position, velocity, and acceleration (upper middle and lower panel) changed significantly for some subjects between day 1 and 3, though there was not a common trend of increases or decreases.
In contrast to the scalar metrics used above, our analysis of movement distribution suggests that stroke survivors can exhibit changes in movement gestures within a few days of training. Acceleration data fit to mixed multivariate normal functions (Gaussian models) revealed that more model components were needed to accurately represent the last day of training. By Day-3, typical subjects exhibited movement distributions that contrasted significantly with respect to a single component Gaussian model (See in Fig. 3). A summary analysis for all subjects (See Fig. 4) showed that coefficients of determination (R2) values were significantly lower (mean change: −0.1118±−0.1043) for Day-3 (mean: 0.64±0.18) distributions compared to Day-1 (mean: 0.75±0.13) using only one component (p=0.008, paired t-test). This trend in increasing number of Gaussian components suggests that training resulted in more complex movement patterns. Note that the choice of histogram bin density did not affect trends, though lower p-values resulted from fewer bins.
Fig. 4.
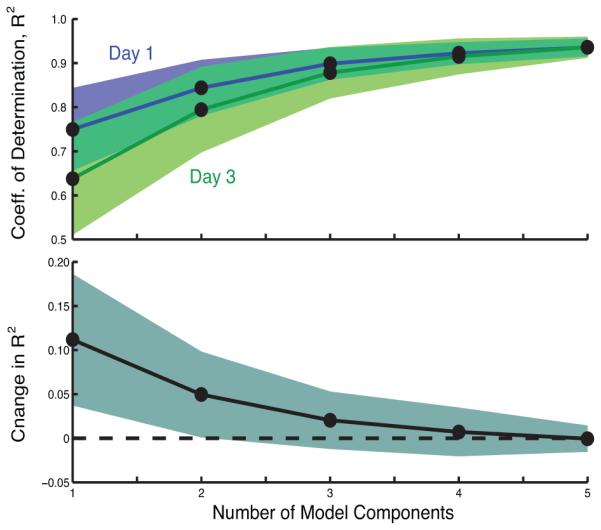
The coefficient of determination R2 characterized the fitness of multivariate normal functions to observed histograms of hand acceleration in the plane. Increasing the number of components yielded diminishing returns with 4-5 components (95 CI for 10 subjects in Day 1 and Day 3 shown). In term of changes in R (lower plot) Day-3 exhibits significantly worse fit with one component compared to Day-1. These trends suggest that stroke survivors develop new patterns of movement with practice.
Our results also showed that distributions differed between subjects. We tested how well a portion of a subject’s data could predict another portion of their data, and compared this to how well this could predict other subjects. We found that the mean coefficient of determination for self-to-self comparisons was generally high (0.90±0.05, 0.90±0.07, 0.95±0.03) while the self-to-others was poor (0.18±0.14, 0.21±0.17, 0.18±0.23) for the position, velocity, and acceleration distribution analyses, respectively. These results demonstrate that a significant portion of distributions differed between individuals.
Classification analysis served as a more precise measure of how easily subject differences could be identified. This analysis revealed better discriminations for higher derivatives. Focusing only on day-1, the LDA-classifier identified subjects correctly for 80.0% of the trials when using acceleration data, while it was 67.5% and 35.0% correct for velocity and position (Fig 5). Using half the available data for the test (rather than single trials), identification success rose to 100% for acceleration, 96.54% for velocity, and 82.0% for position, showing how each subject’s unique signature can be captured.
Fig. 5.
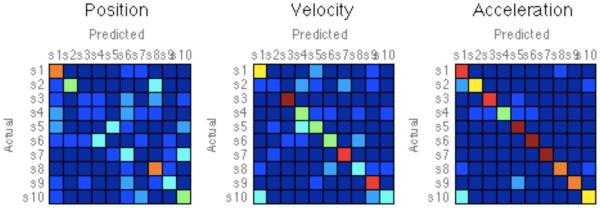
Confusion matrices of distribution profiles for 10 subjects, for acceleration, velocity, and position data. Red/Blue indicates probability that each subject’s histogram for half of the data as a predictor for the other half of data. These results show a general trend of distinct movement distributions per subject.
IV. Discussion
This study examined whether analysis of the statistical distribution of movement can reveal more detailed information about abnormal patterns of coordination. We analyzed data from a previous study in which stroke survivors performed self-directed motor exploration. We first considered scalar metrics to describe the overall change in range of motion in terms of position, velocity, and acceleration, but found mixed results (if anything) for improvement with training. In contrast, analysis of the distribution of movement in multiple dimensions demonstrated more general trends across practice days. Our first main finding demonstrated that as the days of training progressed, the analysis required more multivariate Gaussian normal components to accurately model movement distributions. Our second finding from classification modeling was that each subject’s distributions were unique and differed from others.
This investigation employed a novel approach of examining the distribution of movement in terms of candidate models of multivariate normal functions. The motivation of this analysis is to detect the presence of movement tendencies and how they change with practice. Because our results suggest that more model components are needed by the third day (Fig 3) we speculate that subjects are in fact broadening their movement capabilities. The fact that this trend was not evident in the conventional metrics of the range of motion is not surprising, since these would not capture interactions in multiple degrees of freedom (see Fig. 4). Researchers have investigated the notion of motor primitives, either in terms of oscillators or field functions [29-31], which act as fundamental building blocks of goal-directed actions. Our analysis of model components, in a similar manner, provides evidence of new movement manifestations, which have yet to prove their potential for functional capabilities.
The methods employed in this study might be the best methods to date in identifying the underlying causes of motor deficits. Characterizing motor deficits is a daunting task in part because of the wide variety of pathologies. Current methods in robotic rehabilitation focus largely on discrete movements (such as a reach to a target) for measuring performance, but larger datasets from exploratory movement could enable a more complete description of capability. For example, the distribution of data could at some points exhibit sparseness that suggests a lack of expression. Limits in range of motion should also easily identify sharp changes in distribution that are consistent with hard biomechanical limits such as the changes arm mechanics due to contracture.
Our classification analysis provides evidence that motor deficits due to stroke manifest in individual specific patterns of movement. While it is perhaps unsurprising that individuals exhibit some signature characteristics, we note that such accuracy in discrimination would likely not be possible with simple scalar metrics. Furthermore, the particular forms of movement tendencies evident in the histograms of acceleration (See Fig. 4) provide insights into how particular subjects are adapting their natural practice patterns. Interestingly, we would found more clear separation between the ten subjects in the distributions for acceleration compared to the lower orders of movement (See Fig. 5).
This finding might indicate that the distributions of hand position, while clearly affected by impairment, exhibit variation simply due to natural changes in movement goals. It is also possible that acceleration is more closely connected to force production or motor planning, which has been posited as being sources of motor deficits in stroke [32]. Loss of coordination, weakness, and abnormal reflex patterns, manifest from a loss of neural resources needed to send motor commands. Consequently, differences in such control might be more evident in patterns of how muscles apply force.
Furthermore, the distribution analysis in this study could provide more powerful tools for designing customized therapy. Recent work has shown how interactive machines can inform a direct mathematical relationship between patient deficits and applied interventions [33]. We argue that rehabilitation techniques should capitalize on the rich information available in movement distribution analysis to enhance training customization strategies. Such data is potentially is more informative since it reveals the spectrum of possible actions, not simply the mean behavior. One important limitation of this study is that the patterns of motor exploration are not yet contrasted against those of healthy control subjects. While subjects evidently exhibited some uniquely identifiable deficits, it is not yet clear if this result necessarily implies that such deficits demand customized therapy. However, the evolution (over time) of the observed distribution model components suggests changes in movement tendencies. Consequently, one plausible strategy is to employ the nervous system’s natural use-dependent learning mechanisms [34] along with robotic forces to shift these tendencies away from unwanted patterns. It is clear that self-directed motor exploration can serve as a tool for identifying movement tendencies. The fact that patterns from one subject to the next are unique indicates the need for custom-designed, patient-specific therapy.
Acknowledgments
This work was supported by NINDS grant NS357673 and NINDS grant NS053606.
Contributor Information
Felix C. Huang, Dept. of Biomedical Engineering, Northwestern University, Rehabilitation Institute of Chicago, Chicago, IL USA
James L. Patton, Dept. of Bioengineering, University of Illinois at Chicago, Rehabilitation Institute of Chicago, Chicago, IL USA
References
- [1].Teasell RW, Foley NC, Bhogal SK, Speechley MR. An evidence-based review of stroke rehabilitation. Topics in Stroke Rehabilitation. 2003;10:29–58. doi: 10.1310/8YNA-1YHK-YMHB-XTE1. [DOI] [PubMed] [Google Scholar]
- [2].Mercier C, Bertrand AM, Bourbonnais D. Differences in the magnitude and direction of forces during a submaximal matching task in hemiparetic subjects. Exp Brain Res. 2004 Jul;157:32–42. doi: 10.1007/s00221-003-1813-x. [DOI] [PubMed] [Google Scholar]
- [3].Colebatch JG, Gandevia SC, Spira PJ. Voluntary muscle strength in hemiparesis: distribution of weakness at the elbow. J Neurol Neurosurg Psychiatry. 1986 Sep;49:1019–24. doi: 10.1136/jnnp.49.9.1019. [DOI] [PMC free article] [PubMed] [Google Scholar]
- [4].Dewald JP, Pope PS, Given JD, Buchanan TS, Rymer WZ. Abnormal muscle coactivation patterns during isometric torque generation at the elbow and shoulder in hemiparetic subjects. Brain. 1995 Apr;118:495–510. doi: 10.1093/brain/118.2.495. Pt 2. [DOI] [PubMed] [Google Scholar]
- [5].Levin MF, Selles RW, Verheul MH, Meijer OG. Deficits in the coordination of agonist and antagonist muscles in stroke patients: implications for normal motor control. Brain Res. 2000 Jan 24;853:352–69. doi: 10.1016/s0006-8993(99)02298-2. [DOI] [PubMed] [Google Scholar]
- [6].Dewald JP, Beer RF. Abnormal joint torque patterns in the paretic upper limb of subjects with hemiparesis. Muscle Nerve. 2001 Feb;24:273–83. doi: 10.1002/1097-4598(200102)24:2<273::aid-mus130>3.0.co;2-z. [DOI] [PubMed] [Google Scholar]
- [7].Bohannon RW, Smith MB. Assessment of strength deficits in eight paretic upper extremity muscle groups of stroke patients with hemiplegia. Phys Ther. 1987 Apr;67:522–5. doi: 10.1093/ptj/67.4.522. [DOI] [PubMed] [Google Scholar]
- [8].Gladstone DJ, Danells CJ, Black SE. The fugl-meyer assessment of motor recovery after stroke: a critical review of its measurement properties. Neurorehabil Neural Repair. 2002 Sep;16:232–40. doi: 10.1177/154596802401105171. [DOI] [PubMed] [Google Scholar]
- [9].Rijntjes M, Hobbeling V, Hamzei F, Dohse S, Ketels G, Liepert J, Weiller C. Individual factors in constraint-induced movement therapy after stroke. Neurorehabil Neural Repair. 2005 Sep;19:238–49. doi: 10.1177/1545968305279205. [DOI] [PubMed] [Google Scholar]
- [10].Bushnell CD, Johnston DC, Goldstein LB. Retrospective assessment of initial stroke severity: comparison of the NIH Stroke Scale and the Canadian Neurological Scale. Stroke. 2001 Mar;32:656–60. doi: 10.1161/01.str.32.3.656. [DOI] [PubMed] [Google Scholar]
- [11].Sadek JR, Stricker N, Adair JC, Haaland KY. Performance-Based Everyday Functioning after Stroke: Relationship with IADL Questionnaire and Neurocognitive Performance. J Int Neuropsychol Soc. 2011 Sep;17:832–40. doi: 10.1017/S1355617711000841. [DOI] [PubMed] [Google Scholar]
- [12].Johnson MJ, Wang S, Bai P, Strachota E, Tchekanov G, Melbye J, McGuire J. Bilateral assessment of functional tasks for robot-assisted therapy applications. Med Biol Eng Comput. 2011 Sep 1; doi: 10.1007/s11517-011-0817-0. [DOI] [PMC free article] [PubMed] [Google Scholar]
- [13].Hornby TG, Reinkensmeyer DJ, Chen D. Manually-assisted versus robotic-assisted body weight-supported treadmill training in spinal cord injury: what is the role of each? PM R. 2010 Mar;2:214–21. doi: 10.1016/j.pmrj.2010.02.013. [DOI] [PubMed] [Google Scholar]
- [14].Marchal-Crespo L, Reinkensmeyer DJ. Review of control strategies for robotic movement training after neurologic injury. J Neuroeng Rehabil. 2009;6:20. doi: 10.1186/1743-0003-6-20. [DOI] [PMC free article] [PubMed] [Google Scholar]
- [15].Lotze M, Braun C, Birbaumer N, Anders S, Cohen LG. Motor learning elicited by voluntary drive. Brain. 2003 Apr;126:866–72. doi: 10.1093/brain/awg079. [DOI] [PubMed] [Google Scholar]
- [16].Hanlon RE. Motor learning following unilateral stroke. Arch Phys Med Rehabil. 1996 Aug;77:811–5. doi: 10.1016/s0003-9993(96)90262-2. [DOI] [PubMed] [Google Scholar]
- [17].Jarus T, Gutman T. Effects of cognitive processes and task complexity on acquisition, retention, and transfer of motor skills. Can J Occup Ther. 2001 Dec;68:280–9. doi: 10.1177/000841740106800504. [DOI] [PubMed] [Google Scholar]
- [18].Thelen E, Corbetta D, Kamm K, Spencer JP, Schneider K, Zernicke RF. The Transition to Reaching: Mapping Intention and Intrinsic Dynamics. Child Development. 1993;64:1058–1098. [PubMed] [Google Scholar]
- [19].Oztop E, Bradley NS, Arbib MA. Infant grasp learning: a computational model. Exp Brain Res. 2004 Oct;158:480–503. doi: 10.1007/s00221-004-1914-1. [DOI] [PubMed] [Google Scholar]
- [20].Huang FC, Gillespie RB, Kuo AD. Visual and haptic feedback contribute to tuning and online control during object manipulation. J Mot Behav. 2007 May;39:179–93. doi: 10.3200/JMBR.39.3.179-193. [DOI] [PubMed] [Google Scholar]
- [21].Krebs HI, Hogan N, Aisen ML, Volpe BT. Robot-aided neurorehabilitation. IEEE Transactions on Rehabilitation Engineering. 1998;6:75–87. doi: 10.1109/86.662623. [DOI] [PMC free article] [PubMed] [Google Scholar]
- [22].Lum P, Burgar C, Shor P, Majmundar M, Van der Loos M. Robot-assisted movement training compared with conventional therapy techniques for the rehabilitation of upper limb motor function following stroke. Archives of Physical Medicine and Rehabilitation. 2002;83:952–959. doi: 10.1053/apmr.2001.33101. [DOI] [PubMed] [Google Scholar]
- [23].Taub E, Uswatte G, Pidikiti R. Constraint-Induced Movement Therapy: a new family of techniques with broad application to physical rehabilitation--a clinical review. [see comments] Journal of Rehabilitation Research & Development. 1999;36:237–51. [PubMed] [Google Scholar]
- [24].Wolf SL, Winstein CJ, Miller JP, Taub E, Uswatte G, Morris D, Giuliani C, Light KE, Nichols-Larsen D, Investigators E. Effect of constraint-induced movement therapy on upper extremity function 3 to 9 months after stroke: the EXCITE randomized clinical trial.[see comment] JAMA. 2006;296:2095–104. doi: 10.1001/jama.296.17.2095. [DOI] [PubMed] [Google Scholar]
- [25].Wolf SL, Lecraw DE, Barton LA, Jann BB. Forced use of hemiplegic upper extremities to reverse the effect of learned nonuse among stroke and head-injured patients. Experimental Neurology. 1989;104:125–132. doi: 10.1016/s0014-4886(89)80005-6. [DOI] [PubMed] [Google Scholar]
- [26].Huang FC, Patton JL. Evaluation of negative viscosity as upper extremity training for stroke survivors. IEEE Int Conf Rehabil Robot. 2011 Jun;2011:1–6. doi: 10.1109/ICORR.2011.5975514. [DOI] [PMC free article] [PubMed] [Google Scholar]
- [27].Huang FC, Patton JL, Mussa-Ivaldi FA. Manual skill generalization enhanced by negative viscosity. J Neurophysiol. 2010 Oct;104:2008–19. doi: 10.1152/jn.00433.2009. [DOI] [PMC free article] [PubMed] [Google Scholar]
- [28].Patton JL, Mussa-Ivaldi FA. Robot-assisted adaptive training: custom force fields for teaching movement patterns. IEEE Trans Biomed Eng. 2004 Apr;51:636–46. doi: 10.1109/TBME.2003.821035. [DOI] [PubMed] [Google Scholar]
- [29].Mussa-Ivaldi FA, Bizzi E. Motor learning through the combination of primitives. Philos Trans R Soc Lond B Biol Sci. 2000 Dec 29;355:1755–69. doi: 10.1098/rstb.2000.0733. [DOI] [PMC free article] [PubMed] [Google Scholar]
- [30].Ijspeert AJ, Nakanishi J, Hoffmann H, Pastor P, Schaal S. Dynamical movement primitives: learning attractor models for motor behaviors. Neural Comput. 2013 Feb;25:328–73. doi: 10.1162/NECO_a_00393. [DOI] [PubMed] [Google Scholar]
- [31].Hogan N, Sternad D. Dynamic primitives of motor behavior. Biol Cybern. 2012 Dec;106:727–39. doi: 10.1007/s00422-012-0527-1. [DOI] [PMC free article] [PubMed] [Google Scholar]
- [32].Beer S, Reincke M, Kral M, Callies F, Stromer H, Dienesch C, Steinhauer S, Ertl G, Allolio B, Neubauer S. High-dose 17beta-estradiol treatment prevents development of heart failure post-myocardial infarction in the rat. Basic Res Cardiol. 2007 Jan;102:9–18. doi: 10.1007/s00395-006-0608-1. [DOI] [PubMed] [Google Scholar]
- [33].Sundaram H, Chen Y, Rikakis T. A computational framework for constructing interactive feedback for assisting motor learning. Conf Proc IEEE Eng Med Biol Soc. 2011;2011:1399–402. doi: 10.1109/IEMBS.2011.6090329. [DOI] [PubMed] [Google Scholar]
- [34].Diedrichsen J, White O, Newman D, Lally N. Use-Dependent and Error-Based Learning of Motor Behaviors. J. Neurosci. 2010 Apr 14;30:5159–5166. doi: 10.1523/JNEUROSCI.5406-09.2010. 2010. [DOI] [PMC free article] [PubMed] [Google Scholar]


