Abstract
We investigated the changes in energy expenditure during induction therapy in patients with severe or moderate ulcerative colitis. Thirteen patients (10 men, 3 women; mean age, 36.5 years) with ulcerative colitis admitted to the Shiga University Hospital were enrolled in this study. We measured the resting energy expenditure and respiratory quotients of these patients before and after induction therapy with indirect calorimetry. We analyzed the changes of nutritional status and serum inflammatory cytokine levels and also evaluated the relationship between energy metabolism and disease activity by using the Seo index and Lichtiger index. The resting energy expenditure was 26.3 ± 3.8 kcal/kg/day in the active stage and significantly decreased to 23.5 ± 2.4 kcal/kg/day after induction therapy (p<0.01). The resting energy expenditure changed in parallel with the disease activity index and C-reactive protein and inflammatory cytokine levels. The respiratory quotient significantly increased after induction therapy. Thus, moderate to severe ulcerative colitis patients had a hyper-metabolic status, and the energy metabolism of these patients significantly changed after induction therapy. Therefore, we recommend that nutritional management with 30–34 kcal/kg/day (calculated as measured resting energy expenditure × activity factor, 1.3) may be optimal for hospitalized ulcerative colitis patients.
Keywords: ulcerative colitis, indirect calorimetry, energy expenditure, respiratory quotient, induction therapy
Introduction
Ulcerative colitis (UC) is a chronic inflammatory disease of the digestive tract of unknown etiology.(1,2) The pathogenesis of UC is not yet fully understood, but genetic and environmental factors, including intestinal microflora, are considered important. Clinical symptoms of UC are bloody diarrhea, frequent defecation, and abdominal pain. In addition, general symptoms, such as fever or body weight loss, are often found in moderate or severe UC. Furthermore, patients with UC also have various nutritional deficiencies or metabolic disturbances. Protein-energy malnutrition (characterized by weight loss or hypoalbuminemia) is observed in patients with moderate or severe UC. It has been generally accepted that the prevalence of nutritional deficiencies or metabolic disturbances is lower in UC patients than in patients with Crohn disease (CD).(3,4) However, Mijac et al.(5) recently reported that there were no significant differences in nutritional parameters, such as the body mass index and serum protein levels, between active CD and active UC.
Nutritional support is essential for severe or moderate UC patients. Parenteral nutrition (PN) is integral for the management for UC patients, and evaluation of energy expenditure is critical in planning optimal nutritional therapy for UC patients as well as CD patients.(6) There are some reports that the energy metabolism of CD patients changes to a hyper-metabolic status.(7–12) However, there are only a few reports about energy metabolism in adult UC patients.(13,14) We previously examined the measured resting energy expenditure (mREE) and respiratory quotient (RQ) of patients with moderate to severe UC with indirect calorimetry (IC) and showed that hospitalized UC patients had a hyper-metabolic status.(15)
Recently, we evaluated the changes in the energy metabolism of CD patients receiving anti-tumor necrosis factor (TNF)-α therapy and showed that anti-TNF-α therapy significantly increased the RQ but did not affect the mREE.(16) These results suggested that the principal metabolic substrate might shift from fat to carbohydrate oxidation after anti-TNF-α therapy. However, there are no reports about metabolic changes due to medical treatment in UC patients. In this study, we examined changes in energy metabolism, nutritional status, and serum cytokine levels in severe or moderate UC patients after induction therapy.
Subjects and Methods
Patients
Thirteen UC patients with moderate or severe clinical activity (10 men and 3 women; mean age, 36.5 ± 16.2 years) admitted to the Hospital at the Shiga University of Medical Science were enrolled in this study.(17,18) The diagnosis of UC was determined according to the endoscopic, histological, and clinical criteria. The ethics committee of the Shiga University of Medical Science approved this study. All patients provided written informed consent.
Indirect calorimetry
The mREE and RQ were measured via computed open-circuit IC (AE-300S, Minato Medical Science Co., Osaka, Japan).(12,15,16,19,20) IC was performed in the hospital room after 8 h of fasting. However, the infusion of PN was maintained in the UC patients. Period flow and gas calibration were performed prior to all measurements. After resting for 30 min, the patients were assessed in a supine position by using a facemask. A pump drew ambient air through a facemask at a constant rate. After equilibrium was reached for 10 min, respiratory exchange was performed continuously over 30 min. mREE and RQ data were obtained every minute.
The mREE was calculated from the oxygen consumption (VO2) and carbon dioxide production (VCO2) by using the Weir equation:(21) mREE = (3.94 × VO2 + 1.11 × VCO2) × 1.44. The RQ measurement was calculated as RQ = VCO2/VO2. mREE was then compared with the predicted resting energy expenditure (pREE) calculated by using the Harris-Benedict equation, as follows:(22)
Men; pREE = 66.47 + 13.75 × W [weight (kg)] + 5.0 × H [height (cm)] – 6.75 × A [age (yeas)]
Women; pREE = 665.09 + 9.56 × W + 1.84 × H – 4.67 × A
Activity index
The activity index was calculated with the Seo index and Lichtiger index.(17,18) We assessed each patient’s index every week and examined the relationship between disease activity and the mREE or the RQ.
Laboratory tests
We measured the following items every week; red blood cell count (×104/mm3), hemoglobin level (g/dl), hematocrit (%), white blood cell count (/mm3), peripheral lymphocyte count (/mm3), platelet count (×103/mm3), albumin level (g/dl), total protein content (g/dl), total cholesterol level (mg/dl), and C-reactive protein level (CRP; mg/dl). Changes in these parameters were assessed after induction therapy. TNF-α (pg/dl) and interleukin (IL)-6 (pg/dl) were assessed before and after induction therapy.
Statistical analyses
Paired t tests were used to analyze differences pre- and post-treatment. Correlations were investigated with the Spearman rank correlation tests. Values are expressed as mean and standard deviation; a p value of <0.05 was considered statistically significant.
Results
Patient characteristics are shown in Table 1. Among the 13 patients, 7 had total colitis and 6 had left-sided colitis. Prednisolone (20–60 mg/day) was administered to all patients. Cyclosporine or taclorimus therapy was initiated in 5 patients, and TNF-α therapy was initiated in 2 patients. In 4 patients, leukocytapheresis therapy was initiated. All patients received PN.
Table 1.
Characteristics of ulcerative colitis patients
| Patients number (men/women) | 13 (10/3) |
| Age (years) | 36.5 ± 16.2 |
| Height (cm) | 167.2 ± 8.6 |
| Body weight (kg) | 56.3 ± 12.4 |
| Type of UC | |
| Total colitis type | 7 |
| Left-sided colitis type | 6 |
| Treatments | |
| Anti-TNF-α antibodies | 2 |
| Cyclosporine/Taclorimus | 5 |
| Prednisolone | 13 |
| Nutritional therapy | |
| TPN | 10 |
| PPN | 3 |
| Hospital days (days) | 29.2 ± 11.5 |
Values are expressed as mean ± SD. UC, ulcerative colitis; TPN, total parenteral nutrition; PPN, peripheral parenteral nutrition.
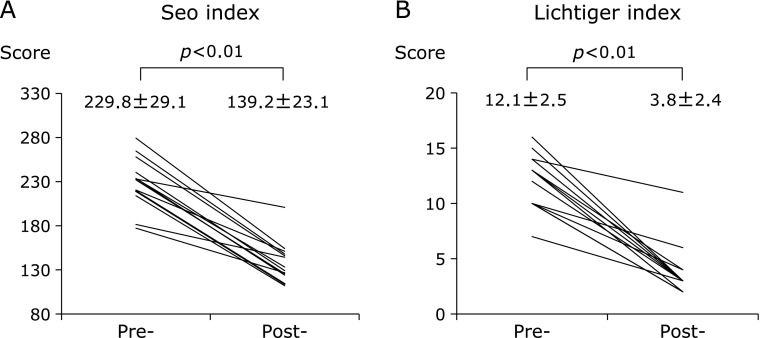
A Lichtiger index ≥11 (severe) was measured in 8 patients (62%), and the mean Lichtiger index before treatment was 12.1 ± 2.5. After treatment, all patients’ scores were less than 11 (mild/moderate), and the mean index score was 3.8 ± 2.4 (Fig. 1A). A Seo index score ≥220 (severe) was measured in 9 patients (69%), and the mean index score before treatment was 229.8 ± 29.1. After treatment, all patients’ scores were <220 (mild/moderate), and the mean score was 139.2 ± 23.1 (Fig. 1B).
Fig. 1.
Mean Seo index and Lichtiger index in patients with ulcerative colitis before and after treatment. Both of these index significantly decreased after treatment.
As shown in Table 2, CRP level significantly decreased after treatment. Serum TNF-α levels decreased from 2.4 ± 0.8 to 1.8 ± 0.6 pg/dl (p = 0.083), and serum IL-6 levels decreased from 20.0 ± 14.3 to 9.1 ± 5.4 pg/dl (p = 0.079). Serum albumin levels were less than 3.5 g/dl in all patients before treatment, with a mean serum albumin concentration of 2.5 ± 0.4 g/dl. After treatment, serum albumin levels were ≥3.5 g/dl in 4 patients, and the mean serum albumin level was 3.1 ± 0.4 g/dl. Serum albumin levels significantly increased after treatment (p<0.01). Conversely, the mean BMI significantly decreased from 20.0 ± 3.0 to 19.2 ± 2.9 kg/m2 after treatment (p<0.05).
Table 2.
Body weight, laboratory tests, inflammatory cytokines, and energy metabolism in patients with ulcerative colitis before and after induction therapy
| Pre- | Post- | p | |
|---|---|---|---|
| Body weight | |||
| BMI (kg/m2) | 20.0 ± 3.0 | 19.2 ± 2.9 | 0.01 |
| %IBW (%) | 90.7 ± 13.4 | 87.1 ± 13.0 | 0.01 |
| Laboratory test | |||
| RBC (×106/mm3) | 3.92 ± 0.70 | 3.86 ± 0.44 | 0.743 |
| Hb (g/dl) | 11.1 ± 2.4 | 11.2 ± 1.4 | 0.864 |
| Ht (%) | 33.2 ± 5.8 | 34.5 ± 3.1 | 0.342 |
| WBC (×103/mm3) | 10.5 ± 2.9 | 8.4 ± 2.4 | 0.033 |
| TLC (/mm3) | 1,341 ± 512 | 1,587 ± 691 | 0.271 |
| Plt (×103/mm3) | 362 ± 158 | 314 ± 101 | 0.134 |
| Alb (g/dl) | 2.5 ± 0.4 | 3.1 ± 0.4 | 0 |
| TP (g/dl) | 6.1 ± 0.8 | 6.0 ± 0.7 | 0.726 |
| T-Chol (mg/dl) | 126 ± 25 | 192 ± 45 | 0.048 |
| CRP (mg/dl) | 6.06 ± 5.63 | 0.25 ± 0.33 | 0.003 |
| Inflammatoy cytoknes | |||
| TNF-α (pg/dl) | 2.4 ± 0.8 | 1.8 ± 0.6 | 0.083 |
| IL-6 (pg/dl) | 20 ± 14.3 | 9.1 ± 5.4 | 0.079 |
| Energy metabolism | |||
| mREE (kcal/day) | 1,459.3 ± 266.3 | 1,265.0 ± 285.4 | 0.001 |
| RQ | 0.78 ± 0.10 | 0.87 ± 0.14 | 0.041 |
Values are expressed as mean ± SD. BMI, body mass index; %IBW, % ideal body weight; RBC, red blood cell count; Hb, hemoglobin; Ht, hematocrit; WBC, white blood cell count; TLC, total lymphocyte count; Plt, platelets; Alb, albumin; TP, total protein; T-Chol, total cholesterol; CRP, C-reactive protein; TNF-α, tumor necrosis factor α; IL-6, interleukin-6; mREE, measured resting energy expenditure; RQ, respiratory quotient.
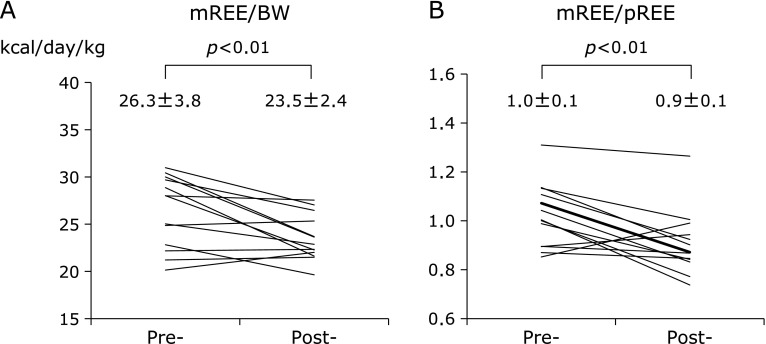
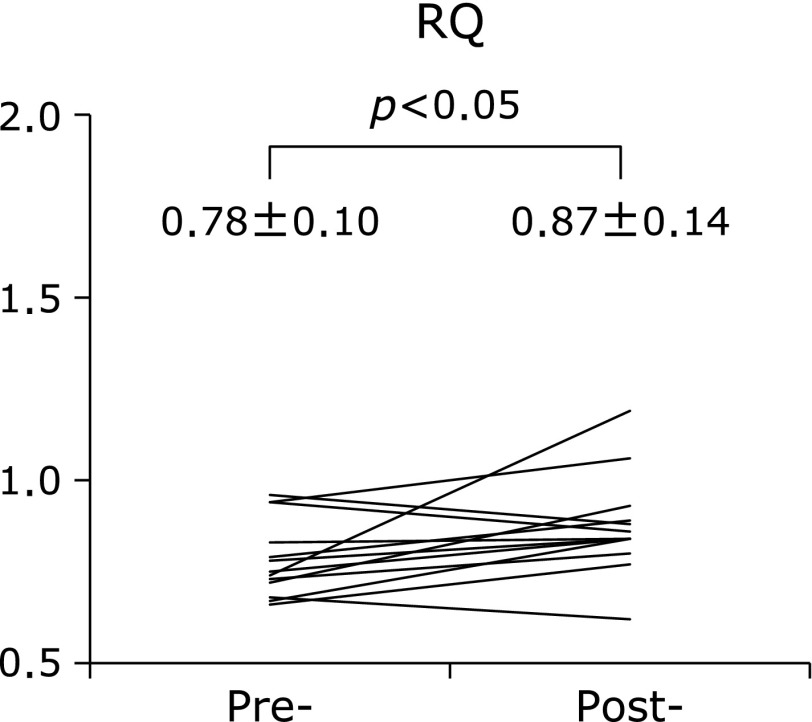
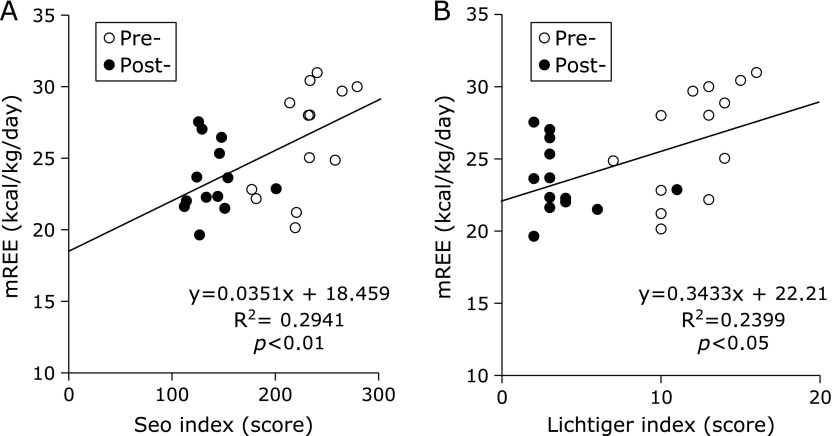
The mean mREE (kcal/day) of UC patients significantly decreased after treatment (Table 2). The mREE per kilogram of body weight (BW) of UC patients was 26.3 ± 3.8 kcal/kg/day in the active stage and significantly decreased to 23.5 ± 2.4 kcal/kg/day after induction therapy (p<0.01) (Fig. 2A). The mean mREE/pREE ratio, which is considered a patient’s stress factor, significantly decreased from 1.0 ± 0.1 to 0.9 ± 0.1 after treatment (p<0.01) (Fig. 2B). On the other hand, the mean RQ significantly increased from 0.78 to 0.87 after induction therapy (p<0.05) (Fig. 3). As shown in Fig. 4, there were significant positive correlations between the clinical activity indices (Seo index and Lichtiger index) and the mREE/BW ratio (p<0.01 and p<0.05, respectively).
Fig. 2.
Mean measured resting energy expenditure/body weight (mREE/BW) (A) and mREE/predicted resting energy expenditure (mREE/pREE) (B) in patients with ulcerative colitis before and after treatment. Values represent mean ± SD.
Fig. 3.
Mean respiratory quotient (RQ) in patients with ulcerative colitis before and after treatment. The RQ significantly increased after treatment. Values are expressed as mean ± SD.
Fig. 4.
Correlation between the measured resting energy expenditure (mREE) and disease activity indices. (A) There are significant positive correlations between the mREE and Seo index. The Seo index measured before (open circles) and after (closed circles) treatment. (B) There are significant positive correlations between the mREE and Lichtiger index. The Lichtiger index measured before (open circles) and after (closed circles) treatment.
Discussion
To our knowledge, this is the first report from a prospective longitudinal study of energy metabolism in patients with moderate to severe UC. Previously, Wiskin et al.(23) reported that there was no significant relationship between mREE and disease activity in children with CD. Recently, Gong et al.(24) reported a similar result in adult CD patients. We previously reported that anti-TNF-α therapy did not affect mREE but significantly increased the RQ in adult CD patients.(16) However, the relationship between energy expenditure and disease activity in adult UC patients remains unclear, although we previously reported a significant correlation between mREE and the Lichtiger index.(15)
The energy metabolism of CD patients has been reported to be hyper-metabolic.(7–12) However, there are few reports about energy metabolism in adult UC patients.(13,14) Previously, we reported that the mREE of Japanese UC patients was significantly higher than that of healthy controls by using indirect calorimetry.(15) In the present study, we further demonstrated that mREE significantly decreased after induction therapy, and we showed that there were significant correlations between the mREE and disease activity scores, such as the Lichtiger index or the Seo index. Therefore, we believe that disease activity must affect the energy expenditure in adult UC patients.
Furthermore, we confirmed that the mean RQ significantly increased after treatment. Fat oxidation significantly decreased from 18.6 to 11.1 kcal/kg/day (p<0.05), and carbohydrate oxidation increased from 6.6 to 13.1 kcal/kg/day (p = 0.095). We already reported that similar RQ changes were observed in hospitalized CD patients.(16) This treatment-related increase in the RQ levels can be explained by a change in substrate oxidation from fat to glucose after intensive treatment. An improvement in inflammation may affect energy metabolism in active UC patients.
Recently, Fonseca-Camarillo et al.(25) reported that the gene expression of IL-6 and TNF-α increased in active UC. We have also reported that IL-6 is associated with energy metabolism in CD patients.(16) In patients with surgical trauma, Kotani et al.(26) found a significant correlation between mREE/pREE and IL-6. In the present study, we demonstrated that IL-6 and TNF-α significantly decreased in UC patients after induction therapy and serum levels of pro-inflammatory cytokines changed in parallel with mREE. Furthermore, we observed that serum IL-6 and TNF-α levels changed inversely with the RQ in UC patients. Thus, we demonstrated that pro-inflammatory cytokines, such as IL-6 and TNF-α, play an important role in the energy metabolism of UC patients.
In our study, mean BMI significantly decreased from 20.0 kg/m2 to 19.2 kg/m2 after treatment, whereas serum albumin levels significantly increased. This paradoxical change of these nutritional parameters might be explained by lower energy intake via PN than adequate energy dosage. From our results, the mean mREE/BW was 26.3 ± 3.8 kcal/kg/day in severe or moderate UC patients, and it significantly decreased to 23.5 ± 2.4 kcal/kg/day after treatment. Our results suggest that the ideal optimal amount of energy calculated as mREE × activity factor for severe or moderate hospitalized UC patients is approximately 34 kcal/ideal BW/day and for UC of remittion stage is about 30 kcal/ideal BW/day. However, energy intake from PN was 1,401–1,774 kcal/day in this study, and this was only 86.8% of our recommended energy dosage. An improvement in inflammation reduced protein loss from the intestines and induced protein synthesis. Consequently, serum albumin levels might increase after induction therapy.
In conclusion, energy metabolism significantly changed after induction therapy in moderate or severe UC patients. We suggest that it is important to determine the daily energy requirements according to disease activity for active UC patients. From our results, the recommended daily energy requirement for Japanese patients with moderate to severe UC is 34 kcal/ideal BW/day; therefore, 30 kcal/ideal BW/day is recommended for UC patients after induction therapy.
Conflict of Interest
No potential conflicts of interest were disclosed.
References
- 1.Baumgart DC, Sandborn WJ. Inflammatory bowel disease: clinical aspects and established and evolving therapies. Lancet. 2007;369:1641–1657. doi: 10.1016/S0140-6736(07)60751-X. [DOI] [PubMed] [Google Scholar]
- 2.Baumgart DC, Carding SR. Inflammatory bowel disease: cause and immunobiology. Lancet. 2007;369:1627–1640. doi: 10.1016/S0140-6736(07)60750-8. [DOI] [PubMed] [Google Scholar]
- 3.Han PD, Burke A, Baldassano RN, Rombeau JL, Lichtenstein GR.Nutrition and inflammatory bowel disease Gastroenterol Clin North Am 199928423–443., ix. [DOI] [PubMed] [Google Scholar]
- 4.Driscoll RH, Jr, Rosenberg IH. Total parenteral nutrition in inflammatory bowel disease. Med Clin North Am. 1978;62:185–201. doi: 10.1016/s0025-7125(16)31831-4. [DOI] [PubMed] [Google Scholar]
- 5.Mijac DD, Janković GL, Jorga J, Krstić MN. Nutritional status in patients with active inflammatory bowel disease: prevalence of malnutrition and methods for routine nutritional assessment. Eur J Intern Med. 2010;21:315–319. doi: 10.1016/j.ejim.2010.04.012. [DOI] [PubMed] [Google Scholar]
- 6.Barot LR, Rombeau JL, Steinberg JJ, Crosby LO, Feurer ID, Mullern JL. Energy expenditure in patients with inflammatory bowel disease. Arch Surg. 1981;116:460–462. doi: 10.1001/archsurg.1981.01380160070014. [DOI] [PubMed] [Google Scholar]
- 7.Chan AT, Fleming CR, O'Fallon WM, Huizenga KA. Estimated versus measured basal energy requirement in patients with Crohn’s disease. Gastroenterology. 1986;91:75–78. doi: 10.1016/0016-5085(86)90441-5. [DOI] [PubMed] [Google Scholar]
- 8.Kushner RF, Schoeller DA. Resting and total energy expenditure in patients with inflammatory bowel disease. Am J Clin Nutr. 1991;53:161–165. doi: 10.1093/ajcn/53.1.161. [DOI] [PubMed] [Google Scholar]
- 9.Rigaud D, Cerf M, Angel Alberto, Sebhani I, Carduner MJ, Mignon M. Increase of resting energy expenditure during flare-ups in Crohn’s disease. Gatroenterol Clin Biol. 1993;17:932–937. (in French) [PubMed] [Google Scholar]
- 10.AI-Janouni R, Hébuterne X, Pouget I, Rampai P. Energy metabolism and substrate oxidation in patients with Crohn’s disease. Nutrition. 2000;16:173–178. doi: 10.1016/s0899-9007(99)00281-6. [DOI] [PubMed] [Google Scholar]
- 11.Schneeweiss B, Lochs H, Zauner C, et al. Energy and substrate metabolism in patients with active Crohn’s disease. J Nutr. 1999;129:844–848. doi: 10.1093/jn/129.4.844. [DOI] [PubMed] [Google Scholar]
- 12.Sasaki M, Johtatsu T, Kurihara M, et al. Energy metabolism in Japanese patients with Crohn’s disease. J Clin Biochem Nutr. 2010;46:68–72. doi: 10.3164/jcbn.09-55. [DOI] [PMC free article] [PubMed] [Google Scholar]
- 13.Barot LR, Rombeau JL, Feurer ID, Mullen JL. Caloric requirements in patients with inflammatory bowel disease. Ann Surg. 1982;195:214–218. doi: 10.1097/00000658-198202000-00016. [DOI] [PMC free article] [PubMed] [Google Scholar]
- 14.Capristo E, Gaetano AD, Mingrone G, et al. Multivariate identification of metabolic features in inflammatory bowel disease. Metabolism. 1999;48:952–956. doi: 10.1016/s0026-0495(99)90188-9. [DOI] [PubMed] [Google Scholar]
- 15.Sasaki M, Johtatsu T, Kurihara M, et al. Energy expenditure in Japanese patients with severe or moderate ulcerative colitis. J Clin Biochem Nutr. 2010;47:32–36. doi: 10.3164/jcbn.10-07. [DOI] [PMC free article] [PubMed] [Google Scholar]
- 16.Nishida N, Sasaki M, Kurihara M, et al. Changes of energy metabolism, nutritional status and serum cytokine levels in patients with Crohn’s disease after anti-tumor necrosis factor-α therapy. J Clin Biochem Nutr. 2013;53:122–127. doi: 10.3164/jcbn.13-18. [DOI] [PMC free article] [PubMed] [Google Scholar]
- 17.Seo M, Okada M, Yao T, Ueki M, Arima S, Okumura M. An index of disease activity in patients with ulcerative colitis. Am J Gastroenterol. 1992;87:971–976. [PubMed] [Google Scholar]
- 18.Lichtiger S, Present DH, Kornbluth A, et al. Cyclosporine in severe ulcerative colitis refractory to steroid therapy. N Engl J Med. 1994;330:1841–1845. doi: 10.1056/NEJM199406303302601. [DOI] [PubMed] [Google Scholar]
- 19.Okamoto H, Sasaki M, Johtatsu T. Resting energy expenditure and nutritional status in patients undergoing transthoracic esophagectomy for esophageal cancer. J Clin Biochem Nutr. 2011;49:169–173. doi: 10.3164/jcbn.11-13. [DOI] [PMC free article] [PubMed] [Google Scholar]
- 20.Sasaki M, Okamoto H, Johtatsu T, et al. Resting energy expenditure in patients undergoing pylorus preserving pancreatoduodenctomies for bile duct cancer or pancreatic tumors. J Clin Biochem Nutr. 2011;48:183–186. doi: 10.3164/jcbn.10-83. [DOI] [PMC free article] [PubMed] [Google Scholar]
- 21.Weir JB. New methods for calculating metabolic rate with special reference to protein metabolism. J Physiol. 1949;109:1–9. doi: 10.1113/jphysiol.1949.sp004363. [DOI] [PMC free article] [PubMed] [Google Scholar]
- 22.Harris JA, Benedict FG. A biometric study of human basal metabolism. Proc Natl Acad Sci U S A. 1918;4:370–373. doi: 10.1073/pnas.4.12.370. [DOI] [PMC free article] [PubMed] [Google Scholar]
- 23.Wiskin AE, Wootton SA, Carnelius VR, Afzal NA, Elia M, Beattie RM. No relation between disease activity measured by multiple methods and REE in childhood Crohn disease. J Pediatr Gastroenterol Nutr. 2012;54:271–276. doi: 10.1097/MPG.0b013e318236b19a. [DOI] [PubMed] [Google Scholar]
- 24.Gong J, Zuo L, Guo Z, et al. Impact of disease activity on resting energy expenditure and body composition in adult Crohn’s disease: a prospective longitudinal assessment. JPEN J Parenter Enteral Nutr. 2014 doi: 10.1177/0148607114528360. in press. [DOI] [PubMed] [Google Scholar]
- 25.Fonseca-Camarillo GC, Villeda-Ramírez MA, Sánchez-Muñoz F, et al. IL-6 and TNF-α gene expression in the rectal mucosal of patients with chronic idiopathic ulcerative colitis and controls. Rev Gastroenterol Mex. 2009;74:334–340. (in Spanish) [PubMed] [Google Scholar]
- 26.Kotani G, Usami M, Kasahara H, Saitoh Y. The relationship of IL-6 to hormonal mediators, fuel utilization, and systemic hypermetabolism after surgical trauma. Kobe J Med Sci. 1996;42:187–205. [PubMed] [Google Scholar]


