

Abstract
Background:
Continuous glucose monitoring using subcutaneously inserted sensors currently requires blood glucose tests for sensor calibration. Alternatively, sensors precalibrated during the manufacturing process may eliminate the need for fingerstick calibrations. In this study we evaluated the feasibility of sensor factory calibration in subjects with diabetes.
Methods:
A total of 33 subjects with diabetes were asked to wear 4 sensors in parallel, 2 on the arm and 2 on the abdomen. Sensors from a lot with low in vitro sensitivity coefficient of variation were used in the study. Based on frequent capillary blood glucose measurements, the average glucose sensitivity of each sensor was determined over a 5-day wear time. The in vivo sensitivities were analyzed for inter- and intrasubject variation. Mean absolute relative difference (MARD) calculation and consensus error grid analysis (EGA) were performed using a single calibration factor for all sensors, to simulate factory calibration and compared against conventional finger-stick calibration.
Results:
The sensitivity coefficient of variation between sensors increased from 2.9% in vitro to 6.0% in vivo. No difference in sensor response between subjects (P = .069) as well as between insertion sites (arm and abdomen) was detected (P = .104). Applying one calibration factor to all sensors in the study resulted in an MARD of 13.4%, and 83.5% of the values fell in consensus EGA zone A. Multiple fingerstick calibration resulted in an MARD of 12.7% and 84.1% in zone A.
Conclusions:
Feasibility of factory calibration was demonstrated in subjects with diabetes using sensors based on “wired enzyme” technology, resulting in accuracy metrics similar to sensors calibrated with capillary blood glucose.
Keywords: diabetes, glucose sensor, calibration, continuous glucose monitoring, subcutaneous
Currently, all commercially available continuous glucose monitoring (CGM) systems require frequent finger-stick calibrations. An initial calibration is needed before any glucose values are displayed to the user, and recalibrations are typically necessary at 12 hour intervals.1 There are 2 reasons why this process is needed. First, the in vivo sensitivity of each individual sensor is unknown, and an initial calibration is required to establish the transfer function between the sensor current and the corresponding glucose concentration. In vivo sensitivity reflects the steady-state scaling factor between uncalibrated sensor signal and reference blood glucose (BG) values. Second, the sensor sensitivity may change over the wear time, which makes recalibrations necessary.2
Therefore, to make factory calibration feasible and thereby eliminate the need for additional fingerstick BG testing, these 2 points need to be addressed. This can be achieved by having a reproducible sensor manufacturing process with a small variation in sensor sensitivity, and a sensor that remains stable during the shelf life as well as over its wear duration. Also, the in vivo sensitivity needs to be inferable from in vitro data. The in vitro sensitivity of each sensor in a sensor lot can be estimated by producing sensor lots with very little within lot sensor variation, and by testing a representative subset of sensors from each lot for their glucose response. With that information, the in vitro sensitivity of each sensor in the lot is known within certain confidence limits. To obtain the in vivo sensitivity, an empirically determined conversion factor needs to be applied to the in vitro sensitivity while accounting for the difference between blood and interstitial glucose concentration and matrix effects (buffer solution vs interstitial fluid). It is also necessary that the sensor response is not significantly different from person to person and among sensor insertion sites.
Previously we have shown data suggesting that factory calibration for subcutaneous glucose sensors is feasible when used in subjects without diabetes.3 In this study we now extend the data set to include subjects with diabetes.
Methods
Sensor System
The sensor design and hardware used in this study is functionally the same as the system described earlier.4 Glucose detection is based on enzymatic (glucose oxidase) amperometric measurement using a 3 electrode system (working, reference, and counter electrode). An immobilized mediator molecule is used to transfer electrons from the enzyme to the electrode (“wired enzyme” technology).4 The sensor batch in this study was built using a new proprietary dispensing method to deposit the enzyme chemistry on the sensor working electrode. This allowed for a tightly controlled area of the enzyme layer. In addition, the coating process for the glucose limiting membrane has been improved to ensure a uniform and consistent membrane thickness. This study utilized a prototype sensor insertion device that is based on a manual insertion process as compared to the standard spring loaded inserter.
In Vitro Sensor Testing
The in vitro sensor sensitivity was determined by submerging sensors into 20 mM phosphate buffered saline solutions with consecutively increasing glucose concentrations. The solutions were stirred under ambient oxygen conditions and maintained at a temperature of 37°C. A custom-made potentiostat (40 mV poise voltage vs Ag/AgCl reference electrode) and data acquisition system was used to power the sensors and record data every minute. The concentration of the glucose solution was confirmed by a lab analyzer (YSI STAT2300, Yellow Springs, OH). In vitro stability testing was performed over a 5-day period in 17 mM glucose solution at a temperature of 33°C.
Clinical Study
A total of 33 subjects (Table 1) were enrolled and evaluated at 1 study center in the United States (Diablo Clinical Research, Walnut Creek, CA). The study population consisted of 21 subjects with type 1 diabetes, 11 subjects with type 2 diabetes, and 1 subject with surgically induced diabetes mellitus. Subjects wore 4 sensors concurrently, 2 inserted in the back of the upper arm and 2 inserted in the abdomen. Sensor data were analyzed for up to 5 days of wear. In clinic visits were scheduled (a minimum of 8 hours duration) which included meals, and either an insulin or glucose challenge. While in clinic, the subjects performed a BG fingerstick test once an hour using a FreeStyle Lite® BG meter (Abbott Diabetes Care, Alameda, CA). More frequent testing (up to every 15 minutes) was requested during specified time periods (eg, meals). During home wear periods, the subjects were asked to perform at least eight BG fingerstick tests each day using the same meter. The sensor signals, together with temperature information, were transmitted to a receiver and stored at a frequency of 1 value per minute. No real time glucose information was displayed to the subject during the study. At the end of the sensor wear time, data was downloaded from the receiver to a PC for further processing. All subjects gave informed consent prior to the study.
Table 1.
Characteristics of Subjects Enrolled in the Clinical Study.
| Characteristic | Number | % |
|---|---|---|
| Gender | ||
| Female | 13 | 39 |
| Male | 20 | 61 |
| Race | ||
| Caucasian | 29 | 88 |
| Non-Caucasian | 4 | 12 |
| Age (years) | ||
| 18-34 | 9 | 27 |
| 35-54 | 6 | 18 |
| ≥55 | 18 | 55 |
| Diabetes type | ||
| Other (pancreatectomy) | 1 | 3 |
| Type 1 | 21 | 64 |
| Type 2 | 11 | 33 |
| BMI | ||
| 25.0-29.9 | 9 | 27 |
| <25.0 | 12 | 36 |
| ≥30 | 12 | 36 |
Data Exclusion
Sensors were replaced within the first hour after insertion or excluded from analysis if the sensor signal triggered threshold error checks (very low or shifting sensitivity of more than a factor of 3 in the first 12 hours after insertion). Sensors were also excluded if more than 50% of the data was missing due to either: the receiver being out of transmission range or the transmitter being partially disconnected from the sensor. Device failures after meeting initial sensitivity checks were attributed to a sensor pull-out from the skin (adhesive failure) or transmitter detachment from sensor mount.
Glucose Calculation
Two different calibrations are retrospectively applied to the sensor raw data. The first is a real-time emulation of the standard fingerstick calibration algorithm used in the commercial FreeStyle NavigatorTM CGM system (Abbott Diabetes Care, Alameda, CA, USA). The second is a simulated factory calibration, where 1 universal sensitivity value is applied to every sensor in the study. For the fingerstick calibration, the glucose calculation implemented in the FreeStyle Navigator CGM System with TRUstartTM algorithm is used.5
Calibration values are requested at 1, 2, 10, 24, and 72 hours from sensor initialization. As part of the algorithm, data during the first 10 hours after sensor insertion may not be presented if the stability of the sensor signal cannot be confirmed. Glucose is calculated every minute from the first successful calibration until 122 hours after the sensor start.
The second algorithm is a simulation of factory calibration using 1 universal calibration factor applied to all sensors in the study. This single factor is calculated by taking the average value of the pooled per-sensor sensitivity values from all the sensors included in the study. The per-sensor sensitivity is computed from the median of the individual sensitivity values, where each available reference BG is paired with the most recent nearby sensor current value. Glucose values are calculated starting from 1 hour after the sensor initialization until 122 hours using the universal calibration factor.
Data Analysis
In vitro sensor sensitivity is derived from the least square linear regression slope of the sensors tested at different glucose concentrations under normal testing conditions. The drift of the in vitro sensitivity was evaluated by the linear regression slope of the individual sensor over a 5-day testing period.
The stability of the in vivo sensitivity was examined by least square linear regression of the individual sensor sensitivity values and the elapsed time since sensor start. The calculated slope is reported as a percentage change over time, and is a measure for in vivo sensor drift. In addition, per sensor median in vivo sensitivity is calculated to evaluate inter- and intrasubject variations.
Consensus error grid analysis (EGA) was used to assess the clinical accuracy.6 Mean absolute relative difference (MARD) between the sensor output and BG measurements was used to evaluate the quantitative accuracy.
Statistical Methods
Variances in in vivo and in vitro sensitivity were assessed by a 2-sided F test. The sensitivities from sensors inserted on abdomen and arm were compared using t test. The intersubject variation in sensor sensitivity was tested using analysis of variance (ANOVA) for comparing means. The difference in MARD and percentage in zone A of consensus error grid using single factor versus standard fingerstick calibration was compared by paired t test. Analyses were carried out using SAS version 9.2 (SAS Institute, Cary, NC).
Results
Out of 33 subjects enrolled, 3 dropped out from the study before sensor initialization. Two subjects did not provide fingerstick BG tests as required by the protocol and were excluded from the analysis. The remaining 28 subjects provided a total of 112 sensor traces (4 sensors per subject). Twelve sensors had very low or rapidly changing sensitivity in the first 12 hours after insertion. This was most likely caused by partial insertion. For 3 sensors, more than 50% of the data was missing due to receiver out of transmission range, or the transmitter being disconnected from the sensor. Four sensors initially provided data during the insertion visit, but the transmitter intermittently failed to detect the minimum sensor signal, resulting in no data transmitted. A total of 93 sensors were included in the analysis, of which the average sensor wear duration was 115 hours.
The sensor lot used in the study had an average in vitro sensitivity of 0.96 nA/mM, and coefficient of variation of 2.9% when tested in vitro at 37°C solution temperature (Figure 1). The average in vivo sensitivity (the mean of the within-sensor median sensitivities) was 1.29 nA/mM with coefficient of variation of 6.0%. The coefficient of variation for in vivo sensitivity is significantly greater than that of the in vitro sensitivity (P < .0001). During in vitro stability testing, the sensors showed a change of 0.25%/day in sensitivity over 5 days in a 17 mM glucose solution at 33°C. During the in vivo wear, the sensitivity changed by an average of 0.66%/day (Figure 2). The in vivo individual sensor sensitivities are shown by subject in Figure 3a.
Figure 1.
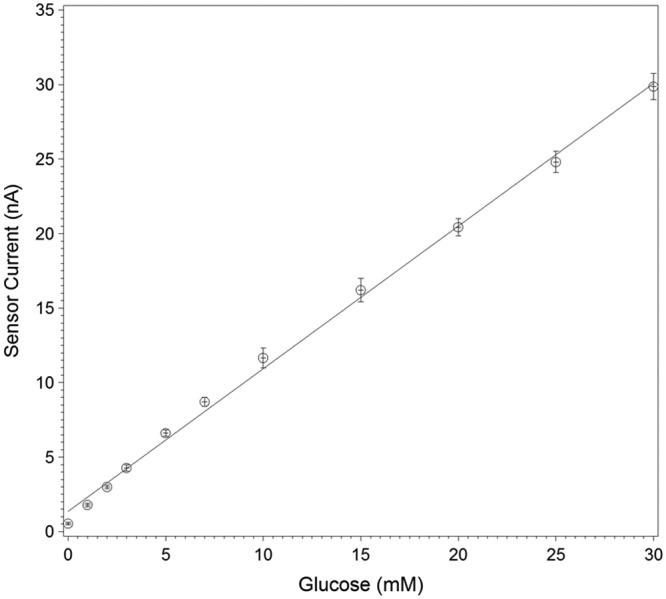
In vitro sensitivity of sensors tested under ambient conditions at 37°C. Least square regression results in an average slope of 0.96 nA/mM and a coefficient of variation between sensors of 2.9% (n = 49). Error bars represent the SD of the measurements.
Figure 2.
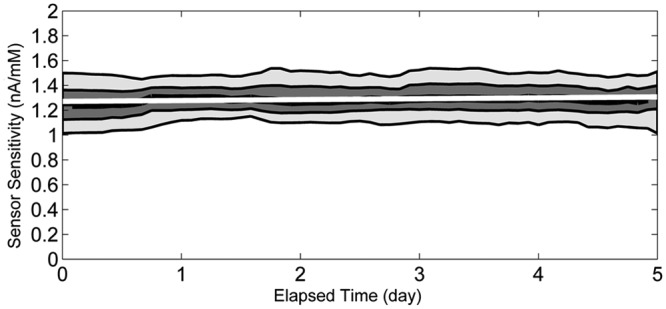
In vivo sensitivity values (paired sensor/reference values) based on capillary blood glucose plotted against elapsed time since sensor start. Lowermost and uppermost lines correspond to the 10th and 90th percentiles. Middle bands correspond to the lower quartile, median, and upper quartile lines. Regression line shows a sensor drift over time of 0.66%/day.
Figure 3.

(a) Per sensor in vivo sensitivity with error bars representing the per subject standard error (SE). The coefficient of variation for in vivo sensitivity for all sensors was 6.0%, and the difference between subjects was not statistically significant (P = .069). (b) Box plot of sensor in vivo sensitivity by insertion site. There was no statistically significant difference in sensitivity between abdomen and arm sites (P = .104).
The difference in sensor sensitivity between subjects did not reach statistical significance (P = .069). In addition, there was no statistically significant difference in in vivo sensitivities between abdomen and arm sensors (P = .104) (Figure 3b).
Standard fingerstick calibration resulted in the following accuracy metrics: MARD = 12.7%, consensus EGA zone A = 84.1% and zone B = 15.4%. Calibration with a single factor for all sensors resulted in MARD = 13.4%, consensus EGA zone A = 83.5% and zone B = 15.7% (Figure 4). The standard fingerstick calibration performed slightly better in MARD (P = .035), but did not have a significant difference for percentage in zone A (P = .256) compared to single factor calibration.
Figure 4.
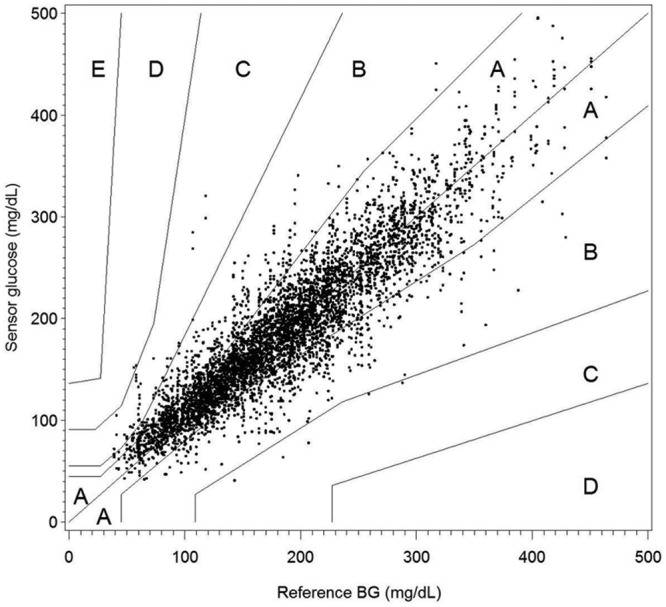
Consensus error grid analysis of sensor glucose values using a single calibration factor to simulate sensor factory calibration (n = 5445).
Discussion
Previously, we have shown evidence that factory calibration for subcutaneous glucose sensors is feasible.3 Since data were collected primarily in subjects without diabetes, we conducted another study enrolling a large number of subjects with diabetes. The requirements for factory calibration pose challenges on the design and manufacturing of glucose sensors, and include assumptions on the physiology of subcutaneous tissue as well as its interaction with the implanted sensor materials.
Most of the sensor design requirements can be investigated through in vitro testing. We have shown that it is possible to manufacture sensors with highly predictable in vitro glucose response (Figure 1). Strictly controlling the enzyme layer deposition and glucose limiting membrane application processes minimizes the variations in glucose sensitivity between sensors. This approach was followed to manufacture the sensor lot used in this study, and it resulted in a coefficient of variation in glucose response of less than 5% in vitro. To realize a viable factory-calibrated system, sensors will need to be routinely selected from each manufactured sensor lot and tested in vitro to determine the lot sensitivity. The required number of sensors to be tested from each lot will depend on the coefficient of variation in sensor sensitivity. This means that the better the manufacturing control and consistency, the fewer samples will be needed to determine the lot sensitivity with acceptable accuracy and confidence.
It also has been shown that the glucose response is stable during the shelf life3 and does not change significantly for the duration of 5-day sensor use in vitro as well as in vivo (Figure 2). In addition to providing a very stable signal, the “wired enzyme” technology allows for a low electrical potential applied to the working electrode (40 mV vs Ag/AgCl reference electrode), and therefore no significant signal shifts can be detected from common interfering substances for electrochemical sensors (e.g. acetaminophen or ascorbic acid).4
For a factory-calibrated subcutaneous glucose sensor to be feasible, it is necessary that the ratio between blood and tissue glucose does not change between insertion sites and between subjects. There is no consensus in the literature on the absolute tissue glucose concentration compared to blood, however most data point to a ratio of 70% to 100% during steady state conditions.7,8 There are also limited data on the variability between sites and subjects, or possible differences between subjects with diabetes and healthy subjects. Since we have shown previously3 that the intersubject sensor response is not significantly different in healthy subjects, we specified the inclusion criteria for this study to only enroll subjects with diabetes (Table 1). The results of this study indicate that there is no difference in the average sensor sensitivity between subjects with diabetes when compared to the BG concentration (Figure 3a). The variation between subjects is of similar magnitude as compared to the variation within subjects. This is an important finding, and it is a requirement to allow for a calibration factor applicable universally to all potential users. We also analyzed the data to look for a difference in sensor sensitivity between sensors worn on the arm versus the abdominal area. We could not detect any statistically significant difference. Any other potential sensor wear sites will have to be evaluated in future studies to determine if they are acceptable sites for a factory-calibrated sensor system.
Minimizing in vitro sensitivity variation within a sensor lot is a necessary condition for a low in vivo sensitivity variation from sensor to sensor. The study shows that the variation in sensor sensitivity is higher in vivo compared to in vitro (coefficient of variation of 2.9% in vitro vs 6.0% in vivo). This confirms the data we published earlier, where we saw an increase from 4.6% in vitro to 8.3% coefficient of variation in vivo.3 While the increase is significant, the accuracy analysis, however, shows that it is acceptable for a factory-calibrated system.
The in vitro sensitivity of the sensors used in the study differs from the in vivo sensitivity since factors like temperature and oxygen concentration do affect the sensor response, and the in vitro conditions do not exactly mimic the in vivo environment.
We chose to calculate the sensor glucose output using 2 different calibration methods to understand: if factory calibration is feasible, and how well it can perform in terms of accuracy metrics. We used the standard calibration algorithm with capillary BG values used in the FreeStyle Navigator CGM system to establish the current baseline sensor accuracy. To represent a best case factory calibration algorithm, we retrospectively determined a universal calibration factor from the median of the individual sensor sensitivities.
For a truly factory-calibrated system, this factor needs to be determined prospectively. It will depend on the known lot specific in vitro sensitivity and a conversion factor which relates the in vitro to the in vivo sensitivity. The conversion factor will need to be confirmed with additional clinical studies.
A weakness of this study is that a significant number of sensors were excluded from the analysis, due to a noisy or extremely high or low sensor signal during the first hours of sensor wear. We believe that improvements to the insertion device should increase the reliability of the insertion process. Certain signal characteristics can be used to detect sensor faults (eg, noise in the signal). In a final product the balance will need to be determined between maximizing detection of faults and minimizing false alarms.
The data show the potential for fingerstick and factory sensor calibration to result in similar accuracy metrics. This is not surprising since fingerstick calibration is by no means an ideal way to calibrate a sensor, considering that there are several sources of error involved in completing the calibration. The main error results from pairing one capillary BG value with a sensor value to determine the calibration factor. BG test strips themselves have a certain error,9 and the overall accuracy may vary from one lot to another.10 More important, the corresponding tissue glucose value may have a time lag and its ratio to BG may be different when measured under steady state conditions. This effect is especially pronounced when glucose levels are rising or falling rapidly.11,12 Other errors are associated with short-term transient sensor inaccuracies that can coincide with the calibration process. A factory-calibrated sensor is not affected by these pairing issues.
On the other hand, consistency in the sensor manufacturing process is extremely important, and outliers with high or low sensitivity are not acceptable. Appropriate in-process controls must be in place to exclude sensors outside the allowable specification ranges. In this study only 1 sensor lot was used. Future studies, using sensors from different sensor lots, are required to demonstrate the feasibility of factory calibration for a high volume product. Also, it has to be shown that the calibration factor can be determined prospectively and remains consistent between sensor lots.
Conclusions
The data presented provide evidence for the feasibility of a factory-calibrated subcutaneous glucose monitoring system in subjects with diabetes. Using sensors based on “wired enzyme” technology, similar accuracy can be achieved compared to calibration with repeated fingerstick BG testing. A robust and consistent sensor manufacturing process is needed to produce sensors with low sensitivity variation in high volume.
Acknowledgments
We thank Shridhara Alva, Rowanne Raper, Elaine Raul, Zoe Welsh, Andrew H. Naegeli, and Junli Ou for their assistance in executing the study; and Phu Le, Tahir Khan, Christopher Thomas, and Jean-Pierre Babka for the preparation of the study sensors.
Footnotes
Abbreviations: ANOVA, analysis of variance; BG, blood glucose; CGM, continuous glucose monitoring; EGA, error grid analysis; MARD, mean absolute relative difference.
Declaration of Conflicting Interests: The author(s) declared the following potential conflicts of interest with respect to the research, authorship, and/or publication of this article: Hoss, Budiman, and Liu are employees of Abbott Diabetes Care. Christiansen is an employee of Diablo Clinical Research, Walnut Creek, CA.
Funding: The author(s) received the following financial support for the research, authorship, and/or publication of this article: This work was funded by Abbott Diabetes Care Inc, Alameda, CA.
References
- 1. Liebl A, Henrichs HR, Heinemann L, et al. Continuous glucose monitoring: evidence and consensus statement for clinical use. J Diabetes Sci Technol. 2013;7(2):500-519. [DOI] [PMC free article] [PubMed] [Google Scholar]
- 2. Wisniewski N, Moussy F, Reichert WM. Characterization of implantable biosensor membrane biofouling. Fresenius J Anal Chem. 2000;366(6-7):611-621. [DOI] [PubMed] [Google Scholar]
- 3. Hoss U, Jeddi I, Schulz M, et al. Continuous glucose monitoring in subcutaneous tissue using factory-calibrated sensors: a pilot study. Diabetes Technol Ther. 2010;12(8):591-597. [DOI] [PubMed] [Google Scholar]
- 4. Feldman B, Brazg R, Schwartz S, et al. A continuous glucose sensor based on Wired Enzyme™ technology—results from a 3-day trial in patients with type 1 diabetes. Diabetes Technol Ther. 2003;5(5):769-782. [DOI] [PubMed] [Google Scholar]
- 5. McGarraugh G, Brazg R, Weinstein R. FreeStyle Navigator Continuous Glucose Monitoring System with TRUstart Algorithm, a 1-hour warm-up time. J Diabetes Sci Technol. 2011;5(1):99-106. [DOI] [PMC free article] [PubMed] [Google Scholar]
- 6. Parkes JL, Slatin SL, Pardo S, et al. A new consensus error grid to evaluate the clinical significance of inaccuracies in the measurement of blood glucose. Diabetes Care. 2000;23(8):1143-1148. [DOI] [PubMed] [Google Scholar]
- 7. Sternberg FM, Meyerhoff C, Mennel JF, et al. Subcutaneous glucose concentration in humans: real estimation and continuous monitoring. Diabetes Care. 1995;18(9):1266-1269. [DOI] [PubMed] [Google Scholar]
- 8. Aussedat B, Gifford R, Klein JC, et al. Interstitial glucose concentration and glycemia: implications for continuous subcutaneous glucose monitoring. Am J Physiol Endocrinol Metab. 2000;278(4):E716-E728. [DOI] [PubMed] [Google Scholar]
- 9. Freckmann G, Schmid C, Baumstark A, et al. System accuracy evaluation of 43 blood glucose monitoring systems for self-monitoring of blood glucose according to DIN EN ISO 15197. J Diabetes Sci Technol. 2012;6(5):1060-1075. [DOI] [PMC free article] [PubMed] [Google Scholar]
- 10. Brazg RL, Klaff LJ, Parkin CG. Performance variability of seven commonly used self-monitoring of blood glucose systems: clinical considerations for patients and providers. J Diabetes Sci Technol. 2013;7(1):144-152. [DOI] [PMC free article] [PubMed] [Google Scholar]
- 11. Ward WK, Engle JM, Branigan D, et al. The effect of rising vs. falling glucose level on amperometric glucose sensor lag and accuracy in type 1 diabetes. Diabetic Med. 2012;29(8):1067-1073. [DOI] [PMC free article] [PubMed] [Google Scholar]
- 12. DirecNet Study Group. Evaluation of factors affecting CGMS calibration. Diabetes Technol Ther. 2006;8(3):318-325. [DOI] [PMC free article] [PubMed] [Google Scholar]