

Abstract
The objective was to assess the effects of short-term (≤1 hour) static high temperature and humidity stresses on the performance of point-of-care (POC) glucose test strips and meters. Glucose meters are used by medical responders and patients in a variety of settings including hospitals, clinics, homes, and the field. Reagent test strips and instruments are potentially exposed to austere environmental conditions. Glucose test strips and meters were exposed to a mean relative humidity of 83.0% (SD = 8.0%) and temperature of 42°C (107.6°F, SD = 3.2) in a Tenney BTRC environmental chamber. Stressed and unstressed glucose reagent strips and meters were tested with spiked blood samples (n = 40 measurements per time point for each of 4 trials) after 15, 30, 45, and 60 minutes of exposure. Wilcoxon’s signed rank test was applied to compare measurements test strip and meter measurements to isolate and characterize the magnitude of meter versus test strip effects individually. Stressed POC meters and test strips produced elevated glucose results, with stressed meter bias as high as 20 mg/dL (17.7% error), and stressed test strip bias as high as 13 mg/dL (12.2% error). The aggregate stress effect on meter and test strips yielded a positive bias as high as 33 mg/dL (30.1% error) after 15 minutes of exposure. Short-term exposure (15 minutes) to high temperature and humidity can significantly affect the performance of POC glucose test strips and meters, with measurement biases that potentially affect clinical decision making and patient safety.
Keywords: clinical decision making, environmental stress, glucose test strip and meter performance, measurement error, patient safety, quality assurance
Glucose meter systems aid responders in triaging, screening, monitoring, and the diagnosis of victims and patients at the site of crisis care. Temperature and humidity conditions at the site of patient care, whether inside or outside the victims’ home or hospital, may exceed manufacturer specifications for storage and operation. Operation of devices outside of product specifications could produce inaccurate results.
Point-of-care (POC) devices deployed with disaster response teams are recommended to be housed in climate controlled settings.1 However, these devices may be exposed to austere conditions when mobilized for field testing. Temperature extremes can be found in a variety of settings including the patient’s home, distinct geographic locations, and with the changing seasons, and are not limited to crisis settings.
This study aims to simulate realistic operation of POC glucose devices in austere environments, to compare measurements obtained from unstressed devices and test reagents, and to characterize how short-term stress affects meter and test strip performance. We discuss the potential implications of these effects on clinical decision making.
Methods
Glucose Meters and Test Strips
A commercially available glucose meter was tested using 4 meters and 1 lot of test strips. The manufacturer recommends operating the meters and test strips between 13.9°C and 40.0°C (57-104°F) and 10% to 80% relative humidity. Glucose test strips and meters were divided into 2 sets. Each set contained 2 vials of glucose test strips in its original packaging and 2 glucose meters. One set of meters and test strips was placed in the Tenney BTRC (SPX Thermal Product Solutions, White Deer, PA) environmental stress chamber, which was programmed to create the experimental temperature and humidity conditions. The second set was placed outside the chamber, in the laboratory at ambient room temperature and humidity, which served as the control. Testing was performed both inside and outside the chamber. Stressed test strips were tested with both stressed and unstressed meters, and likewise unstressed strips were tested with both stressed and unstressed meters. Stressed meters remained in the chamber for the duration of the study (Figure 1). A single operator performed sample dosing of stressed and unstressed test strips for the duration of the experiment to minimize introducing operator bias.
Figure 1.
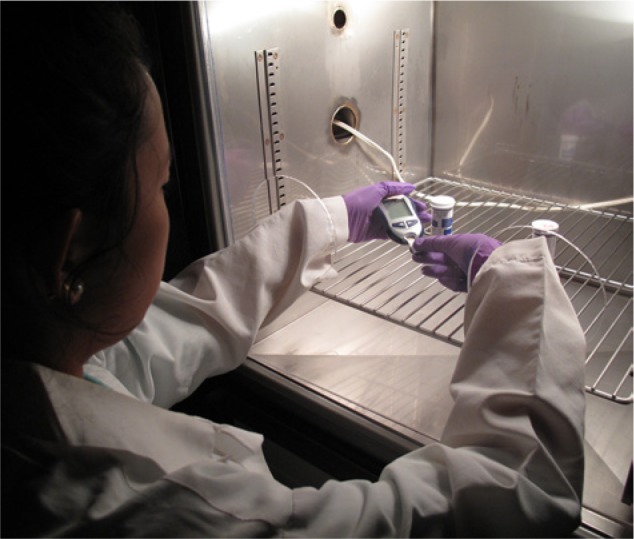
Short-term thermal-humidity stress in an environmental chamber. The photo illustrates the testing of stressed glucose meters and test strips inside the Tenney BTRC environmental chamber. A custom Plexiglass enclosure allows reach-in operation and testing of the POC glucose meters. The operator is holding the glucose meter in the left hand and inserting with the right hand a test strip that has been removed from one of the cylindrical containers on the metal rack.
Environmental Conditions
The Tenney BTRC environmental chamber was programmed to maintain 95% relative humidity and temperature of 45°C (113°F). The conditions were selected based on temperature and humidity extremes documented from recent disasters as summarized in Table 1.2-4 The chamber door was left open for the duration of the experiment with a custom Plexiglass sheet with reach-in ports fitted over the opening to provide a physical enclosure but also access to the internal chamber compartment for testing (Figure 1). Calibrated thermohygrometers (Fisherbrand, Pittsburgh, PA) and temperature/humidity dataloggers (MadgeTech RHTemp101A, Contoocook, NH) were used to monitor the temperature and humidity inside the chamber and the room conditions. With the chamber door open, the mean relative humidity inside the chamber was 83% (SD = 8.0%) while the temperature was 42°C (SD = 3.2°C). The mean temperature of the room was 23°C (SD = 0.4°C), and relative humidity of 46% (SD = 5.8%).
Table 1.
Emergency and Disaster Profiles.
| Recorded temperature range |
|||||
|---|---|---|---|---|---|
| Profile | Date of event | Data collection range | Recorded humidity range (%) | °C | °F |
| Tsunami Banda Aceh, Indonesia | December 26, 2004 | December 26, 2004, to January 25, 2005 | 58 to 99 | 22.2 to 32.2 | 72 to 90 |
| Hurricane Katrina, New Orleans, LA | August 29, 2005 | August 22 to September 21, 2005 | 31 to 96 | 21.7 to 35.6 (20 to 45)a | 71.1 to 96.1 (68 to 113)a |
| Earthquake, Port-au-Prince, Haiti | January 12, 2010 | January 14 to February 13, 2010 | 24 to 94 | 20 to 35 | 68 to 95 |
| Earthquake/tsunami, Sendai, Japan | March 11, 2011 | March 11 to April 10, 2011 | 17 to 97 | −3.1 to 20.1 | 26.4 to 68.2 |
| Earthquake/tsunami, Sendai, Japan | January 2011 | January 1 to January 31, 2011 | 33 to 94 | −6.1 to 8.5 | 21 to 47.3 |
| Hurricane Sandy, New York, NY | October 29, 2011 | October 29 to November 29, 2011 | 41 to 100 | −1 to 18 | 30.2 to 64.4 |
| Tornado Moore, Oklahoma | May 20, 2013 | May 20 to June 3, 2013 | 23 to 100 | −0.6 to 31.1 | 30.9 to 88.0 |
Volunteer Subjects and Test Samples
This study was reviewed and approved by the local ethics committee, UC Davis Institutional Review Board (IRB 294372-4). Venous whole blood samples from healthy adult volunteer donors were spiked with 10% dextrose solution to achieve an overall average glucose level of 111.2 (SD = 5.3, N = 160, range = 97-123) mg/dL for testing. The mean glucose concentrations of the whole blood test samples used for testing in trials 1 to 4 were 112.5 (SD = 3.5), 106.3 (SD = 4.7), 116.7 (SD = 3.0), and 109.4 (SD = 3.0) mg/dL, respectively.
Study Design
For each experimental trial, 2 meters and 2 vials of test strips were placed in the environmental chamber at time 0. Glucose testing on stressed and unstressed devices was performed after 15, 30, 45, and 60 minutes of stress. For each trial and at each time point, 10 replicate glucose measurements were obtained from (1) stressed meter testing with stressed test strips, (2) unstressed meter testing with unstressed test strips, (3) stressed meter testing with unstressed test strips, and (4) unstressed meter testing with stressed test strips. The experiment was performed 4 times, that is, a total of 4 trials. A total of forty measurements were obtained at each time point, with the exception of trials 3 and 4, where a total of 20 measurements were obtained for each time point. In trials 3 and 4, only testing with meter–test strip combinations 1 and 2 were performed to further assess the aggregate stress effect of meter and test strips on glucose measurement. Testing order was randomized for the meter–test strip combination. Stress meters and test strips were not equilibrated to room temperature prior to testing.
By comparing the paired glucose measurements between the above (1-4) meter–test strip combinations as described in the “Data Analysis” section, the amount of bias attributed to stress effect on the meter or test strip can be quantified. In addition, the aggregate effect of meter and test strip stress on glucose measurement can be quantified.
Quality Control Testing
Aqueous quality control (QC) testing was performed at the beginning and end of each experiment for each meter to ensure that glucose meter systems operated within manufacturer specifications. QC testing was performed using unstressed test strips. For end-of-experiment QC testing, stressed meters were removed from the chamber and allowed to equilibrate to room temperature for 7 minutes before QC tested. Two levels of aqueous QC solutions (low and high) were supplied by the manufacturer.
Data Analysis
Short-term temperature and humidity stress effect on glucose meter measurements were quantified to determine how stress on the meters and test strips individually and in aggregate contribute to glucose measurement biases. Meter effect was determined by comparing the paired glucose measurements between stressed and unstressed meters performed with unstressed test strips (3 vs 2). Test strip effect was determined by comparing the paired glucose measurements between stressed and unstressed test strips performed on unstressed meters (4 vs 2).
The aggregate (meter + test strip) effect of short-term thermal and humidity exposure on meters and test strips was determined by comparing measurements obtained with stressed test strips on stress meter and unstressed test strips on unstressed meter (1 vs 2). Mean and median glucose paired differences (stress minus control) were plotted as a function of stress duration in minutes. Paired differences were analyzed using Wilcoxon signed rank test because data set was not normally distributed (statistical significance: *P < .05, **P < .01, and ***P < .001).
Results
Meter Effect
Glucose measurements obtained from stressed meters were significantly elevated in comparison to unstressed meters after 15 minutes of high temperature and humidity exposure (P < .001; Figure 2). Median glucose paired differences were as much as 10 mg/dL with a mean paired difference of 10.4 mg/dL (SD = 1.8, n = 10), trial 1, after 15 minutes of stress. The maximum absolute difference as quantified from the meter effect was 20 mg/dL, an error of 17.7% (20/112.5), in trial 1, after 30 minutes exposure (Figure 3).
Figure 2.

Effects of short-term temperature and humidity stress on POC glucose measurements. Mean (A) and median (B) glucose paired differences are plotted as a function of stress duration. The mean glucose concentrations in the whole blood test sample for trials 1 to 4 were 112.5 (SD = 3.5), 106.3 (SD = 4.7), 116.7 (SD = 3.0), and 109.4 (SD = 3.0) mg/dL, respectively. X indicates no experimental data were collected for isolated meter or test strip effects in trials 3 and 4. *P < .05. **P < .01. ***P < .001.
Figure 3.
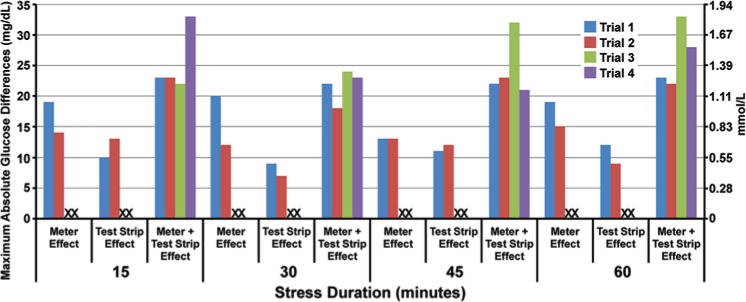
Maximum absolute glucose differences between stressed and control meters and test strips. The heights of the column represent the maximum absolute glucose paired differences between stressed and control meters and strips individually, and the collective effect on the whole system (meter plus test strip).
Test Strip Effect
Glucose measurements with stressed test strips were significantly elevated compared to unstressed test strips (P < .001; Figure 2). Median glucose paired differences were as high as 7.5 mg/dL with a mean paired glucose difference of 6.5 mg/dL (SD = 2.1, n = 10), trial 2, after 1 hour. The maximum absolute difference as quantified from the test strip effect was 13 mg/dL, an error of 12.2% (13/106.3), in trial 2, after 15 minutes exposure (Figure 3).
Combined Meter and Test Strip Effect
The aggregate effect of stress on meter and test strips elevated glucose measurements significantly compared to unstressed devices after 15 minutes of exposure (P < .001). Median glucose paired differences were as high as 26.5 mg/dL with a mean paired difference of 25.7 mg/dL (SD = 4.3, n = 10), trial 3, after 45 minutes. The maximum absolute difference was 33 mg/dL, an error of 30.1% (33/109.4) within 15 minutes of exposure (trial 4; Figure 2 and Figure 3).
Discussion
This is the first study to document the impact of short-term (≤1 hour) temperature and humidity stress on the performance of POC glucose meter systems. Previously we showed that long term exposure (~4 weeks) of POC glucose test strips to static and dynamic temperature and humidity stress can affect its performance.5,6 The present study takes a step further and evaluates the whole system, including the stress effects on meter performance and the aggregate effect meter and test strip stress on measurement. The results have important implications for health professionals and patients in regard to the handling and practice of POC glucose testing in austere environmental settings.
In Springfield, Massachusetts, paramedics complained that cold temperatures less than 12°C (<53.6°F) caused glucose meter systems to shut down during emergency response.7 During Hurricane Katrina and its aftermath, patients who self-monitor to adjust daily drug regimens, especially diabetics, were caught without access to glucose meters and test strips.8
The study simulates the operation of glucose meters and test strips in original vial packaging in a laboratory environment (23°C, 46% RH), and evaluates the test performance of instruments and test strips exposed to austere conditions (42°C, 83% RH) for a short period of time. In a recent inspection and survey of our nation’s disaster cache, we learned that POC devices are transported to disaster sites in trucks equipped with air conditioning/refrigeration units to maintain temperature at 21.1 ± 1.1°C.1 Field portable heating and air conditioning units in tents enable proper storage temperatures for the POC supplies.1 However, these units are bulky and require a diesel generator for power, thus restricting the mobility of the POC testing to the tent.
Experimental results showed that introducing POC glucose meters and test strips to austere environmental conditions (42°C with 83% RH) for 15 minutes was sufficient to produce significantly elevated results. Patients and health professionals use POC results to make appropriate evidence-based treatment decisions. Measurement bias as high as 33 mg/dL (or an error of 30.1%) could affect clinical treatment decision (eg, insulin dosing9) and jeopardize patient safety.
Enzyme-based test strip chemistry are susceptible to heat and cold stress, which can destabilize the enzyme, affect the kinetics of the biochemical reactions, or render the enzyme inoperable.10-14 Although packaged in a dry state, exposure of the enzymes to humidity can prematurely rehydrate the protein, reduce its stability, and limit their reactivity when utilized for patient testing.10 This study further revealed environmental conditions affected not only the test strips but also the instrument as shown in Figure 2. Therefore, operators should handle and use POC devices and reagents according to manufacturer’s specifications, and for technology developers to design new approaches to protect or enhance the robustness of the POC tests and preserve its performance.
Novel short- and long-term solutions are needed to protect POC devices and its test reagents from temperature and humidity stress and thereby safeguarding patients. Temperature lockout should be a universal feature on POC devices, thus preventing the operation of the POC test and the reporting or results outside of the manufacturer specifications. POC reagents (test strip and cartridges) should be packaged with an irreversible temperature-sensitive label that would warn users that the reagents have been exposed to conditions exceeding the recommended storage conditions. Portable, lightweight, and thermomodulating containers7 should be developed to protect reagents and instruments in storage and while in transit, and enable unrestricted testing of patients in the field.
Conclusions and Recommendations
Short-term exposure (15 minutes) of a POC glucose meter system to high temperature (42°C, 107.6°F) and humidity (83% RH) can elevate glucose test results by as much as 33 mg/dL or 30.1%. This bias is clinically significant and has the potential to affect treatment decisions and the safety of patients.
POC devices and test strips should be used according to manufacturer’s instructions.
Health professionals and patients need to be aware of the risk for erroneous results when POC devices are operated in austere environments.
Operators of POC devices need to protect devices from temperature and humidity extremes, and monitor the storage and operating environment of the POC supplies.
Technology developers should integrate a temperature lockout feature on all POC devices and incorporate temperature-sensitive labels in reagent packaging to safeguard patients by preventing inappropriate operation of device in austere environments and to warn patients if reagents have been exposed to adverse temperature.
Novel portable, lightweight thermomodulating containers should be developed to protect POC devices and test reagents while in storage or in transit.
POC devices used during complex emergencies and disasters ideally should be placed in alternate care facilities or other environments where environmental conditions can be controlled.
Footnotes
Declaration of Conflicting Interests: The author(s) declared no potential conflicts of interest with respect to the research, authorship, and/or publication of this article.
Funding: The author(s) disclosed receipt of the following financial support for the research, authorship, and/or publication of this article: The research was supported by the Point-of-Care Testing Center for Teaching and Research (POCT•CTR) and by a grant from the National Institute of Biomedical Imaging and Bioengineering (NIBIB, National Institutes of Health [NIH]; U54EB007959, principal investigator: Dr Gerald Kost). The content is solely the responsibility of the authors and does not necessarily represent the official views of NIBIB or the NIH. Tables and figures were provided courtesy and by the permission of Knowledge Optimization®, Davis, CA.
References
- 1. Curtis CM, Louie RF, Vy JH, et al. Innovations in point-of-care testing for enhanced United States disaster caches. Am J Disaster Med. in press. [DOI] [PubMed] [Google Scholar]
- 2. Louie RF, Ferguson WJ, Sumner SL, Yu JN, Curtis CM, Kost GJ. Effects of dynamic temperature and humidity stresses on point-of-care glucose testing for disaster care. Disaster Med Public Health Prep. 2012;6(3):232-240. [DOI] [PubMed] [Google Scholar]
- 3. Klein KR, Nagel NE. Mass medical evacuation: Hurricane Katrina and nursing experiences at the New Orleans Airport. Disaster Manag Response. 2007;5(2):56-61. [DOI] [PubMed] [Google Scholar]
- 4. Louie RF, Ferguson WJ, Curtis CM, Vy JH, Kost GJ. Vulnerability of point-of-care test reagents and instruments to environmental stresses: implications for health professionals and developers. Clin Chem Lab Med. 2014;52(3). [Published ahead of print, October 11, 2013]. [DOI] [PubMed] [Google Scholar]
- 5. Kline DG. Inside and somewhat outside charity. J Neurosurg. 2007;106:180-188. [DOI] [PubMed] [Google Scholar]
- 6. Louie RF, Sumner SL, Belcher S, et al. Thermal stress and point-of-care testing performance: suitability of glucose test strips and blood gas cartridges for disaster response. Disaster Med Public Health Preparedness. 2009;3:13-17. [DOI] [PMC free article] [PubMed] [Google Scholar]
- 7. Rust MJ, Carlson N, Nichols J. A thermo-modulating container for transport and storage of glucose meters in a cold weather environment. Point Care. 2012;11(3):157-160. [Google Scholar]
- 8. Kost GJ, Tran NK, Tuntideelert M, et al. Katrina, the tsunami, and point-of-care testing: optimizing rapid response diagnosis in disasters. Am J Clin Pathol. 2006;126:513-520. [DOI] [PubMed] [Google Scholar]
- 9. Tirimacco R, Koumantakis G, Erasmus R, et al. Glucose meters—fit for clinical purpose. Clin Chem Lab Med. 2013;51(5):943-952. [DOI] [PubMed] [Google Scholar]
- 10. Tonyushkina K, Nichols J. Glucose meters: a review of technical challenges to obtaining accurate results. J Diabetes Sci Technol. 2009;3(4):971-980. [DOI] [PMC free article] [PubMed] [Google Scholar]
- 11. O’Malley JJ, Ulmer RW. Thermal stability of glucose oxidase and its admixtures with synthetic polymers. Biotechnol Bioeng. 1973;15(5):917-925. [DOI] [PubMed] [Google Scholar]
- 12. Zoldák G, Zubrik A, Musatov A, Stupák M, Sedlák E. Irreversible thermal denaturation of glucose oxidase from Aspergillus niger is the transition to the denatured state with residual structure. J Biol Chem. 2004;279(46):47601-47609. [DOI] [PubMed] [Google Scholar]
- 13. Gouda MD, Singh SA, Rao AGA, Thakur MS, Karanth NG. Thermal inactivation of glucose oxidase: mechanisms and stabilization using additives. J Biol Chem. 2003;278(27):24324:24333. [DOI] [PubMed] [Google Scholar]
- 14. Ye W-N, Combes D. The relationship between the glucose oxidase subunit structure and its thermostability. Biochim Biophys Acta. 1989;999(1):86-93. [DOI] [PubMed] [Google Scholar]