

Ancestral polarity protein Par3 is crucial for the polarization of B-cells toward a tethered antigen. This process is needed by these lymphocytes to uptake and process the antigen to mount the adaptive immune response.
Abstract
B-cell receptor (BCR) engagement with surface-tethered antigens leads to the formation of an immune synapse, which facilitates antigen uptake for presentation to T-lymphocytes. Antigen internalization and processing rely on the early dynein-dependent transport of BCR–antigen microclusters to the synapse center, as well as on the later polarization of the microtubule-organizing center (MTOC). MTOC repositioning allows the release of proteases and the delivery of MHC class II molecules at the synapse. Whether and how these events are coordinated have not been addressed. Here we show that the ancestral polarity protein Par3 promotes BCR–antigen microcluster gathering, as well as MTOC polarization and lysosome exocytosis, at the synapse by facilitating local dynein recruitment. Par3 is also required for antigen presentation to T-lymphocytes. Par3 therefore emerges as a key molecule in the coupling of the early and late events needed for efficient extraction and processing of immobilized antigen by B-cells.
INTRODUCTION
In lymph nodes, B-lymphocytes are activated through the engagement of their B-cell receptor (BCR) with antigens (Ags) tethered at the surface of neighboring cells (Batista and Harwood, 2009). BCR engagement leads to extraction and processing of these immobilized antigens for presentation onto major histocompatibility complex (MHC) class II molecules to primed CD4+ T-cells (Mitchison, 2004). This process, referred to as T-B cooperation, is required for germinal center formation and production of high-affinity antibodies by B-lymphocytes.
Both efficient BCR signaling and extraction of surface-tethered antigens rely on the formation of an immune synapse that is reminiscent of the one described in T-lymphocytes (Kupfer et al., 1987; Grakoui et al., 1999). It includes a peripheral region, the pSMAC, into which coreceptors such as LFA-1 accumulate, and a central region, the cSMAC, toward which BCRs, organized into clusters containing signaling molecules (termed microclusters), are actively transported (Carrasco et al., 2004; Harwood and Batista, 2008; Tolar et al., 2009). Directed transport of microclusters to the cSMAC allows local gathering of BCR–antigen complexes and promotes their internalization (Fleire et al., 2006, Schnyder et al., 2011). Formation of signaling BCR microclusters relies on the local remodeling of the actin cytoskeleton by the small GTPase Rac2 and the ERM protein ezrin (Brezski and Monroe, 2007; Arana et al., 2008; Treanor et al., 2010). In addition, the directed movement of signaling BCR microclusters to the cSMAC requires their association with the microtubule motor protein dynein, which promotes antigen gathering, extraction, and presentation (Schnyder et al., 2011).
Additional evidence for the involvement of the microtubule cytoskeleton in synapse organization and function is provided by our work demonstrating that the polarization of the microtubule-organizing center (MTOC) to the B-cell synapse allows the local secretion of lysosomal hydrolases that promote efficient antigen extraction (Yuseff et al., 2011). Two other recent studies support the idea that B-cell polarity regulates B-lymphocyte function at several stages of activation. Indeed, it was shown that while migrating toward the T-cell zone, activated B-cells undergo asymmetric divisions, allowing segregation of the taken-up antigen to be presented to T-lymphocytes in one daughter cell only (Thaunat et al., 2012). Asymmetric B-cell divisions were also described in germinal centers, where they might regulate the unequal inheritance of fate-associated molecules such as Bcl-6 by daughter cells (Barnett et al., 2012). Control of cell polarity therefore emerges as a key mechanism involved in the regulation of B-lymphocyte responses.
In epithelial cells, establishment of cell polarity is driven by three conserved protein complexes: Scribble, Crumbs, and the partitioning-defective (Par) complex (Mellman and Nelson, 2008). Among the three, the Par polarity complex has the broadest function, controlling apicobasal polarity, asymmetric cell division, and directed cell migration. It is composed of three subunits—Par6, Par3, and atypical protein kinase Cζ (aPKCζ)—and is often activated downstream of the small GTPase Cdc42 (Iden and Collard, 2008). The mechanisms by which Par regulates cell polarity involve the redirection of both the actin and microtubule cytoskeletons toward precisely labeled intracellular locations. We demonstrated that MTOC and lysosome polarization induced upon BCR engagement with surface-tethered Ag relies on both Cdc42 and aPKCζ (Yuseff et al., 2011). Of interest, it was highlighted that Par3 interacts with dynein in migrating fibroblasts (Schmoranzer et al. 2009). This has been shown to allow MTOC polarization in T-lymphocytes (Quann et al. 2009; Yi et al. 2013). Furthermore, Par3 transcription was shown to be under the control of Pax5, the master regulator of the B-cell lineage (Schebesta et al., 2007). However, whether this ancestrally conserved polarity protein plays a role in B-lymphocyte function remains an open question.
Here we investigate the role of Par3 in formation and function of the B-cell synapse. We show that by facilitating the local recruitment of dynein, Par3 couples the early and late events required for presentation of immobilized Ag to T-lymphocytes: 1) the gathering of BCR-Ag microclusters at the synapse center and 2) the local exocytosis of lysosomes that delivers proteases and MHC class II molecules for Ag processing to take place.
RESULTS
BCR engagement with surface-tethered antigens triggers Par3 recruitment to the center of the immune synapse
To investigate whether Par3 is recruited at the B-cell synapse, we plated mouse B-lymphoma cells expressing Par3–green fluorescent protein (GFP) and LifeAct-CherryFP onto glass slides coated or not with specific BCR ligands and recorded them for 30 min by total interference reflection fluorescence time-lapse microscopy (TIRFM). As expected, we observed a flow of actin starting at the synapse periphery and moving toward its center, leading to lamellipodial extension and progressive contraction (Figure 1, A and B, and Supplemental Video S1). Of interest, Par3-GFP formed punctuated structures that, similar to actin, moved in a unidirectional manner to the synapse center. However, whereas these Par3-GFP dots ultimately concentrated at the level of the cSMAC, actin had a more peripheral distribution (Figure 1B). Of importance, no directional Par3-GFP movement (nor that of actin) was observed when B-cells were plated on slides noncoated with Ag (Figure 1B and Supplemental Figure S1), highlighting the specificity of this phenomenon. We conclude that Par3 is recruited at the B-cell synapse, undergoes centripetal movement, and concentrates at the level of the cSMAC.
FIGURE 1:

Par3 polarizes at the immune synapse. (A) Time-lapse imaging by TIRFM of B-cells expressing LifeAct-CherryFP and Par3-GFP, plated on glass slides coated with BCR ligand; bottom, kymographs of a line scan across the immune synapse (yellow dashed lines in top image). Scale bar, 3 μm. (B) Average of the integrated radial line scan (see Materials and Methods) normalized by the size of the cell and the fluorescence intensity (normalized fluorescence intensity [NFI]) measured for 65 and 34 cells plated on specific (+) and unspecific (–) BCR ligand, respectively, at t = 30 min after cell plating (at least two independent experiments). Shadow indicates the interval of confidence (±SEM). Bottom, ratio of the NFI averages (top) measured with and without antigen.
Par3 is required for BCR-Ag microcluster gathering at the center of the immune synapse
The centripetal transport of BCR-Ag microclusters was shown to be essential for Ag gathering at the synapse center and uptake for presentation onto MHC class II molecules (Treanor et al., 2010). Using planar lipid bilayers, we observed that BCR-Ag microclusters transiently overlapped with Par3-GFP–containing punctuated structures during centripetal transport (see arrows in Figure 2A and Supplemental Video S2). This result suggests that Par3 might be involved in the dynamics of these signaling structures. To address this question, we silenced Par3 expression using two Par3-specific short hairpin RNAs (shRNAs; Supplemental Figure S2A). Although Par3-silenced cells exhibited similar numbers of BCR-Ag microclusters as control cells, these microclusters often failed to gather at the cSMAC in the absence of the polarity protein, instead remaining dispersed at the cell periphery (Figure 2, B and C, and Supplemental Video S3). This was quantified by measuring the growth of microclusters during centripetal transport: whereas microcluster size increased in control B-cells as a result of their coalescence at the synapse center, this was not observed in Par3-silenced B-cells (Figure 2D). Of interest, a slight reduction in the phosphorylation of Erk and p38 was detected in Par3-silenced cells, suggesting that the mitogen-activated protein (MAP) kinase pathway requires microcluster centripetal transport for efficient activation (Supplemental Figure S2B). In addition, no significant difference in the mobility of single BCR molecules was observed between control and Par3-silenced resting B-lymphocytes (Supplemental Figure S3, A and B), suggesting that Par3 specifically regulates BCR dynamics upon engagement with immobilized antigens. We conclude that Par3 interacts with BCR-Ag microclusters and is required for their transport toward the center of the immune synapse.
FIGURE 2:

Par3 regulates BCR microcluster movement and gathering at the immune synapse. (A) TIRFM simultaneous images of Par3-GFP (green) and BCR clusters (red) of a cell (dashed circle) plated on supported lipid bilayer (scale bar, 3 μm); right, line scan integrated intensity signal of the two channels (as described in Material and Methods). (B) TIRFM images of control and Par3-silenced B-cells plated onto lipid bilayers containing ICAM-1 and specific (+) or nonspecific (–) fluorescent BCR ligand (see Materials and Methods). Scale bar, 3 μm. (C) Percentage of cells presenting BCR microclusters gathered at the center of the immune synapse after 30 min (qualitative comparison between images like the one displayed in B at t = 0 and 30 min). (D) Growth of BCR microclusters in time, shown as the fold increase of the size compared with time 0 (sizes are computed as described in Materials and Methods) in control and Par3-A– silenced B-cells (bold curves represent mean ± SEM for 45 samples for shCtrl and 60 samples for shPar3; three independent experiments).
Par3 regulates dynein dynamics at the B-cell synapse
The centripetal transport of BCR-Ag microclusters was shown to rely on dynein (Schnyder et al., 2011). Of interest, this molecular motor was also described as interacting and partially colocalizing with Par3 in migrating fibroblasts (Schmoranzer et al., 2009). We therefore hypothesized that Par3 regulates BCR microcluster transport by facilitating dynein recruitment at the B-cell synapse. To test this hypothesis, we investigated the localization of dynein IC74 (2C–red fluorescent protein [RFP]) in control and Par3-silenced B-cells. Spinning-disk microscopy analysis showed that dynein enrichment at the synapse was decreased in Par3-knockdown B-cells (Figure 3, A and B). In addition, analysis of the dynamics of the motor protein by TIRFM showed that the duration of single dynein trajectories was significantly reduced in Par3-silenced cells as compared with their control counterpart (Figures 3, C and D, and Supplemental Video S4), indicating that the time of presence of dynein at the immune synapse is decreased in the absence of the polarity protein. Of interest, this particularly concerned the dynein structures that localized at the synapse center (Figure 3E). Accordingly, transient colocalization events of Par3-GFP and dynein IC74 (2C-RFP) were observed in cotransfected B-cells (Figure 3F and Supplemental Video S5). Par3 silencing had no effect on the endogenous expression levels of the dynein IC74 subunit (Supplemental Figure S3C). Thus, Par3 facilitates dynein enrichment at the center of the B-cell synapse, suggesting that Par3 might promote BCR-Ag microcluster centripetal transport by locally recruiting the motor protein.
FIGURE 3:

Par3 regulates dynein dynamics at the B-cell synapse. (A) B-cells expressing dynein-IC-RFP were plated on anti-IgG–coated coverslips and imaged 15 min to 1 h after stimulation by spinning-disk microscopy. The three images show three sections of a cell (bottom xy and two sagittal ones). (B) Method used to quantify dynein accumulation at the synapse: the ratio between fluorescence density of the signal (total fluorescence/volume) in the synapse to the fluorescence density in the cytoplasm was computed; a uniform distribution would give a ratio of 1. The measured fluorescence ratio is higher in shCtrl than in shPar3-A cells (shCtrl, n = 27; shPar3, n = 18; p = 0.016, Mann–Whitney test; three independent experiments), indicating Par3-dependent accumulation of dynein at the synapse. (C) The same pool of cells observed in B were previously observed in TIRFM, and the dynein puncta visible on each frame (left) were tracked with single-particle tracking (only puncta above background levels were considered); overlap of trajectories is color coded according to their duration. (D) Median duration of the trajectory computed in the same cell shows that in the control (shCtrl, n = 27) cells, dynein remains at the synapse significantly longer than in silenced ones (shPar3-A, n = 18; p = 0.0028, Mann–Whitney test); trajectories <2 s were discarded from statistics). (E) Average of the duration, with error bars (SEM), plotted along the normalized distance from the center of the cell for control and silenced cells (respectively, shCtrl, histogram computed for 4044 trajectories, 27 cells; and shPar3-A, for 2041 trajectories, 18 cells; three independent experiments). (F) Time-lapse imaging by TIRFM of B-cells expressing dynein-IC-RFP and Par3-GFP 20 min after being plated on glass slides coated with BCR ligand (scale bar, 5 μm).
Par3 and dynein regulate MTOC polarization to the B-cell synapse
Acquisition of surface-tethered Ag relies on 1) the early gathering of BCR-Ag microclusters at the cSMAC and 2) the later polarization of the MTOC and lysosomes at the immune synapse, which provide both the proteolytic enzymes and MHC class II molecules required for Ag extraction and processing (Yuseff et al., 2011). Of interest, both Par3 and dynein are involved in MTOC polarization in a variety of cellular systems (Gérard et al., 2007; Schmoranzer et al., 2009). We therefore hypothesized that in addition to BCR-Ag microcluster gathering, Par3 and dynein might promote MTOC and lysosome polarization, thereby coupling the early and late events required for efficient Ag presentation.
To assess the role of Par3 and dynein in MTOC polarization to the B-cell synapse, we incubated B-lymphoma cells with 3-μm latex beads coated or not with BCR ligands, a system that is better suited than planar surfaces to study global cell polarity events (Yuseff et al., 2011). We observed that Par3 and dynein were both enriched at the cell–bead interface and exclusively when beads were coated with specific BCR ligands (Figures 4, A–C). Partial colocalization of the two proteins was also observed (Figure 4A). Of importance, dynein polarization to Ag-coated beads was significantly reduced in Par3-silenced B-lymphocytes (Figure 4, D and E), whereas dynein inhibition did not alter Par3-GFP polarization (Supplemental Figure S4A). These results indicate that, as observed on planar surfaces, Par3 promotes the recruitment of dynein to the synapse that forms at the B-cell–bead interface.
FIGURE 4:

Par3 controls centrosome docking by recruiting dynein to the immune synapse. (A) Immunofluorescence staining of Par3-GFP (anti-GFP) and dynein (biotinylated anti–dynein-IC74) in B-cells previously incubated with anti-IgG–coated (+) or anti-IgM–coated (–, negative control) beads for 1 h. Scale bars, 3 μm. (B) The automated method used to quantify the degree of polarization of a cell: briefly, 1) the cell is imaged in three dimensions on different signals; 2) its center of mass and the center of mass of the signal of interest are obtained by suitable threshold methods; 3) the positions of the different centers of mass are computed relative to the center of the cell; and 4) the polarity index (PI) is obtained as described by the appropriate formula (see Materials and Methods). (C) Double polarity indexes were obtained for each condition (each black circle corresponds to a cell). Colored plot were obtained (using the dscatter.m Matlab routine; Eilers et al. 2004) from single-cell results (color code uses the Jet LUT: low density, blue; high density, red). The polarity index is measured at t = 15min (without [–] BCR ligand, n = 88; with [+] BCR ligand, n = 76) and t = 60 min (without [–] BCR ligand, n = 95; with [+] BCR ligand, n = 95; three independent experiments) after incubation (however, because we do not control the precise time at which cells interact with beads, this contact time might be slightly overestimated). (D) Control (shControl) and Par3-silenced (shPar3-B) B-cells were treated as described in A and stained for α-tubulin (red) and dynein-IC74 (green). Scale bars, 3 μm. (E) Dynein polarity indexes were obtained as described in Materials and Methods using single-cell analysis (respectively, n = 80, 83, 67, and 123; three independent experiments). Control stimulated cells (shControl, +) present increased polarity indexes compared with Par3 silenced and nonstimulated cells (p(shControl-ligand) < 0.0001, p(shPar3+ligand) < 0.0001; Mann–Whitney test against shControl+ligand).
Calculation of the MTOC polarity index showed that it was significantly reduced in Par3-silenced B-cells (Figure 5, A and B), indicating that Par3 is required for MTOC polarization in B-cells. Polarization was not observed in B-cells stimulated with beads coated with proteins that do not engage the BCR. Of importance, MTOC polarity was rescued by exogenously expressing human Par3-GFP in mouse B-cells silenced for the endogenous protein (McCaffrey and Macara, 2009), indicating that defective polarity in these cells did not result from shRNA off-targets (Supplemental Figure S4B). Dynein inhibition with ciliobrevin A also significantly impaired MTOC recruitment to the cell–bead interface (Supplemental Figure S5A). We conclude that Par3 and dynein are required for MTOC polarization to the B-cell synapse.
FIGURE 5:

MTOC and lysosome polarization at the immune synapse relies on Par3. (A) Control (shControl) and Par3-silenced (shPar3-B) B-lymphoma cells were incubated with anti-IgG–coated beads (dotted circles) for 1 h and stained for γ-tubulin (red) and LAMP-1 (green) to label the MTOC and lysosomes, respectively. Scale bars, 3 μm. (B, C) Quantification of MTOC and lysosome polarization index, measured as described in Figure 4B in control (red circles) and Par3-silenced cells (blue circles, two different constructs) with and without specific antigen (empty and full dots, respectively). Quantification was performed using a single-cell analysis, according to Materials and Methods (n = 110, 103, 26, 81, 57, and 47, respectively; at least three independent experiments; for MTOC, p(shControl-BCR) < 0.0001, p(shPar3A+BCR) < 0.0001, and p(shPar3B+BCR) = 0.0005; for lysosomes, p(shControl-BCR) < 0.0001, p(shPar3A+BCR) = 0.0002, and p(shPar3B+BCR) = 0.0046; Mann–Whitney test against the control condition shControl+ligand). (D) SIM images showing a B-cell incubated with an anti-IgG–coated bead for 1 h and stained for γ-tubulin (blue), LAMP-1 (green), and dynein-IC74 (red); left, 3D view of the cell; middle, a planar section; right, zoom of the synapse, showing no colocalization between dynein-IC and LAMP-1 compartments.
Par3 and dynein regulate lysosome secretion at the B-cell synapse
Similar results were obtained when monitoring lysosome polarization to the cell–bead interface: both Par3 silencing and dynein inhibition significantly impaired lysosome recruitment to the synapse (Figure 5, A and C, and Supplemental Figure S5B). Analysis of dynein distribution in activated B-cells by structured-illumination microscopy (SIM) showed no major colocalization between the LAMP-1 lysosomal marker and the molecular motor, suggesting that the majority of the synaptic dynein pool was recruited independently of these vesicles (Figure 5D and Supplemental Video S6). The local density of lysosomes monitored by TIRFM was also reduced in Par3-silenced B-cells (Supplemental Figure S6A). In contrast, cell spreading measured on Ag-coated slides (Supplemental Figure S6B) or beads (Figures 6, A and B) remained unaffected. Similarly, the number of beads in contact with the control or silenced cells was not significantly different (Figure 6C). Lysosome exocytosis at the synapse was next assessed by measuring local acidification using beads coated with BCR ligands coupled to Cypher5E dye, which fluoresces at acidic pH (Milasta et al., 2005; Yuseff at al., 2011). This experiment showed that synapse acidification was impaired in Par3-knockdown B-cells (Figure 6, D and E). In agreement with our previous findings (Yuseff et al., 2011), no significant Cypher5E signal was observed in intracellular compartments, suggesting either that the fraction of taken-up Ag was not abundant enough to be detected or that Ag was internalized in early endosomal compartments whose pH is not compatible with Cypher5E fluorescence emission. Accordingly, Par3 silencing also reduced the extraction of immobilized Ag, as monitored by labeling the amount of ovalbumin remaining on beads in contact with B-cells (Figure 6F). Hence Par3 silencing impairs lysosome recruitment and secretion at the B-cell synapse as well as local Ag extraction.
FIGURE 6:

Par3-dependent lysosome recruitment and secretion at the immune synapse is required for antigen presentation to CD4+ T-cells. (A) Spreading of shCtrl and shPar3 cells on antigen-coated beads observed by scanning electron microscopy (scale bar, 5 μm). (B) Percentage of fully covered/partially covered/uncovered Ag-coated beads at 30 and 60 min (data pooled from three independent experiments; n = 275, 302, 426, and 420, respectively; chi-squared test, p(30min) = 0.13 and p(60min) = 0.23). (C) Percentage of cells in contact with no, one, two, or more Ag-coated beads showing no significant difference in shCtrl and shPar3 cells (data pooled from three independent experiments; two-way analysis of variance test, p = 0.37). (D) Representative images of an anti–IgG-Cypher5 bead associated to control (shCtrl) cell and Par3- silenced (shPar3-A) cells. The numbers indicate the increase in MFI of the bead above background. (E) Percentage of beads associated to anti–IgG-Cypher5 beads that showed a Cypher5 MFI of >10% above background (p = 0.015, Fisher's exact test) in control (shControl, n = 130) and silenced cells (shPar3, n = 87; pooled from more than three independent experiments). (F) Normalized antigen extraction measured by immunofluorescence (n(shCtrl) = 104, n(shPar3) = 95, pooled from three independent experiments). Antigen extraction in shPar3 cell is 70% weaker than in control cells (paired t test, p = 0.022). (G) Ag presentation assay with control and shPar3-silenced B-cells. Mean amounts of IL-2 ± SD were obtained by pooling triplicates from at least two independent experiments (p(shPar3A+Lack+ligand) < 0.0001, p(shPar3B+Lack+ligand) < 0.0001; one way analysis of variance [ANOVA] followed by Dunnett's multiple comparison test against control condition shControl+Lack+ligand; obvious significances are not shown). (H) Peptide control for B-cells used in the antigen presentation experiment (average value and SD computed on at least two independent experiments). (I) Ag presentation assay with control and siRNA Par3-silenced, spleen-derived primary B-cells. Mean amounts of IL-2 ± SD were obtained as average of triplicates from at least two independent experiments (p(siPar3A+Lack+ligand) < 0.0001, p(siPar3B+Lack+ligand) < 0.0001; two-way ANOVA, followed by Bonferroni post test, against control condition siControl+Lack+ligand; obvious significances are not shown). (J) Peptide control for primary B-cells used in the antigen presentation experiment (average value and SD computed on three independent experiments).
Taken together, our results strongly suggest that Par3 regulates MTOC/lysosome recruitment at the synapse by locally recruiting dynein. To formally demonstrate this point, we assessed whether MTOC/lysosome polarity in Par3-silenced B-cells was rescued by expression of a Par3–yellow fluorescent protein (YFP) construct that lacks the N-terminal domain (Par3 Cter-YFP) responsible for its interaction with the motor protein (Schmoranzer et al., 2009). Unfortunately, we found that this construct was mislocalized when transfected in B-cells, accumulating in their nucleus (Supplemental Figure S6C). Nevertheless, our data indicate that Par3 promotes the polarization of dynein to the B-cell synapse, which in turn is required for MTOC/lysosome local recruitment. We therefore conclude that Par3 promotes MTOC/lysosome polarization at least in part by facilitating dynein recruitment at the immune synapse, even though we cannot exclude that Par3-silenced B-cells might have additional defects that also contribute to their defective polarity phenotype.
Par3 is required for the processing and presentation of surface-tethered antigens to T-cells
Having shown that Par3 promotes both BCR-Ag microcluster gathering at the center of the synapse and the local secretion of lysosomes, we next investigated whether Par3 is required for presentation of surface-tethered Ag onto MHC class II molecules to CD4+ T-lymphocytes. For this, we incubated B-cells with beads coated or not with specific BCR ligands plus the LACK antigen from Leishmania major, as previously described (Yuseff et al., 2011). After 4 h, B-cells were fixed and cultured in the presence of a T-cell hybridoma that recognizes the LACK peptide (amino acids 156–173) presented onto I-Ad MHC class II molecules, and their activation was measured by monitoring the secretion of interleukin-2 (IL-2). T-cell activation was observed only when using beads coated with BCR ligands, demonstrating that Ag must interact with the BCR to be efficiently presented to T-cells (Figure 6G). Ag presentation to T lymphocytes was compromised in Par3-silenced B-cells. Par3 silencing did not affect BCR cell surface levels at the steady state or the internalization of the BCR upon engagement (Supplemental Figure S7, A and B). These results indicate that impaired antigen processing did not result from altered BCR endocytic trafficking. Of importance, Par3 silencing had no effect on peptide presentation (Figure 6H), indicating that it does not affect surface expression levels of MHC class II or costimulatory molecules involved in B-cell–T-cell interactions. Equivalent results were obtained in purified mouse spleen B-cells silenced for Par3 using two different siRNAs (Figure 6, I and J, and Supplemental Figure S7C). In addition, no difference was detected in the presentation of soluble Ag acquired by pinocytosis, even at higher concentrations (Supplemental Figure S7D). We conclude that the polarity protein Par3 is specifically required for the processing and presentation of surface-tethered antigens by promoting synapse formation and polarization of lysosomal trafficking.
DISCUSSION
B-cells rely on cell polarity to acquire their Ag-presentation function; however, the cellular mechanisms behind the establishment and maintenance of B-cell polarization during synapse formation remain incompletely resolved. In this study, we provided the first evidence for the implication of the ancestral polarity protein Par3 in the polarization of B-cells during synapse formation. Our results suggest that the localization of Par3 to the site of BCR-antigen interaction acts as a landmark of polarity that guides the further recruitment of molecules required for B-cell synapse organization and function. Indeed, we show that Par3 facilitates the recruitment of dynein to the B-cell synapse, which 1) allows the transport of BCR-Ag microclusters to the synapse center, where endocytosis takes place, and 2) drives MTOC polarization and local lysosome secretion. Although we do not formally demonstrate, as shown in fibroblasts, that the interaction between dynein and Par3 is direct in B-lymphocytes, impaired dynein recruitment at the synapse of Par3-silenced B-cells provides a simple explanation for defective BCR microcluster centripetal transport and MTOC/lysosome polarization in these cells. We propose that by coordinating these two events, Par3 and dynein couple the early and late events required for Ag processing and presentation to T-lymphocytes (see model in Figure 7).
FIGURE 7:
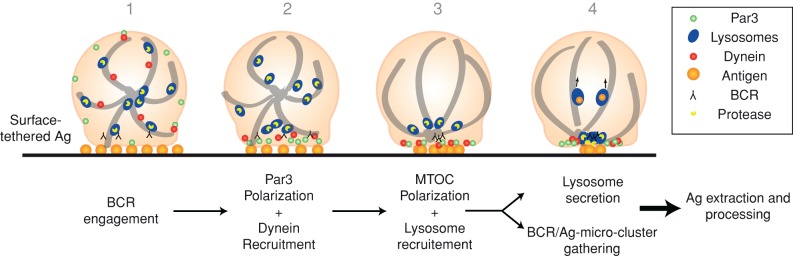
Model depicting the role of Par3 and dynein in extraction and processing of surface-tethered Ag by B-cells.
We observed that Par3 controls the early onset of MAP kinase signaling, consistent with impaired microcluster gathering at the center of the synapse in Par3-silenced cells. These cells also show a slight increment in ERK phosphorylation at later time points. However, this was not sufficient to overcome their defective polarization phenotype, indicating that perturbations in early signaling events affect later cytoskeleton dynamics. We found that the gathering of Par3 occurs concomitantly to an actin flow directed toward the center of the B-cell synapse. These observations were obtained by transfecting Par3-GFP in B-lymphocytes. Indeed, we could not visualize endogenous Par3, most likely due to low expression levels of the protein in B-cells, as well as to the poor quality of the antibodies for immunofluorescence staining. However, we verified that Ag presentation is not impaired upon Par3-GFP expression in B-cells, indicating that the fusion protein does not alter B-cell function (Supplemental Figure S7D). Of interest, it has been found that segregation of polarity proteins is promoted by an actomyosin flow during the establishment of the anteroposterior axis in Caenorhabditis elegans embryos (Goehring et al., 2011). It is tempting to speculate that the actomyosin contractions induced upon BCR engagement (Vascotto et al., 2007) generate a positive feedback loop that reinforces Par3 recruitment and downstream events of B-cell polarization. Accordingly, myosin II has recently been shown to be involved in MTOC reorientation to the T-cell synapse (Liu et al., 2013). In this model, MTOC polarization results from the concerted forces of myosin II, which localizes at the rear of activated T-cells and exerts pushing forces on the microtubule network, and dynein, which is recruited at the T-cell front and pulls on microtubules. In addition, in these cells, MTOC polarization was shown to require the local production of diacylglycerol (DAG), which recruits and activates PKCs (Quann et al., 2009). Of interest, DAG is converted by DAG kinase to phosphatidic acid, which interacts with the PDZ domain of Par3 (Yu et Harris, 2012). Whether DAG plays a role in Par3-dependent MTOC polarization in B-cells or whether Par3 is involved in DAG-induced MTOC polarization in T-cells needs to be investigated. Indeed, although several polarity proteins, including Par3, were shown to be enriched at the T-cell synapse (Ludford-Menting et al., 2005), their role in local dynein recruitment and MTOC polarization was not addressed.
We showed that aPKCζ is associated with the lysosomes that polarize to the B-cell synapse (Yuseff et al., 2011). We observed that aPKCζ was not required for MTOC per se but instead stabilized its polarization, as well as the local secretion of lysosomes. It can be envisioned that BCR engagement induces 1) polarization of Par3, which allows dynein recruitment at the B-cell synapse and provides the driving force to gather microclusters at the cSMAC, and 2) phosphorylation of aPKCζ (Yuseff et al., 2011), which stabilizes polarity by facilitating the docking of the MTOC and the secretion of lysosomes, possibly through its ability to interact with Par3. In this context, the concerted action of aPKCζ and Par3 would create a stable platform for efficient extraction and processing of surface-tethered Ag through coordinated events of exocytosis and endocytosis. Indeed, the lysosomes that are recruited in an MTOC-dependent manner at the B-cell synapse not only provide the extracellular proteases to facilitate Ag extraction, but also further help to recruit the MHC class II molecules to be loaded with antigenic peptides (Yuseff et al., 2011). Formation of MHC class II–peptide complexes might occur at the cell surface (Moss et al., 2007), as well as in endocytic vesicles that would form upon lysosome secretion, as described at the T-cell synapse (Angus et al., 2013) and during compensatory endocytosis in secretory neurons (Gundelfinger et al., 2003). In agreement with impaired lysosome secretion (as measured by synapse acidification), we found that antigen extraction is reduced in Par3-silenced B-cells but not completely abrogated, suggesting that the mechanical component of antigen extraction (Natkanski et al., 2013) persists.
The sustained polarized phenotype induced during synapse formation could also control later stages of B-cell activation. Indeed, prolonged synaptic interactions between T-cells and Ag-presenting cells were shown to coordinate asymmetric T-cell division by guiding the segregation of ancestral polarity proteins, aPKCζ and Scribble, thereby giving rise to different T-cell progeny with effector or memory fates (Chang et al., 2007). Asymmetric cell divisions were further described in B-cells within germinal centers, where unequal inheritance of fate-associated molecules such as Bcl-6 and aPKC by daughter cells was observed (Barnett et al., 2012). Another recent study showed that the asymmetric distribution of antigen within B-cells is conserved throughout cell division, giving rise to daughter cells with unequal Ag loads and consequently providing them with differential capacities for antigen presentation (Thaunat et al., 2012). Whether the generation of these asymmetric populations is influenced by initial polarity cues established during synapse formation upon Ag encounter remains to be elucidated. Future experiments aimed at analyzing the effect of polarity proteins at different stages of B-cell activation, such as Ag encounter, migration, or asymmetric cell division, should help to shed light on these important questions.
MATERIALS AND METHODS
Cells
The mouse lymphoma cell line IIA1.6 (Lankar et al., 2002) and the LMR7.5 Lack T-cell hybridoma, which recognizes I-Ad-LACK156–173 complexes, were cultured as reported previously (Vascotto et al., 2007) in CLICK medium (RPMI 1640, 10% fetal calf serum, 1% penicillin–streptomycin, 0.1% β-mercaptoethanol, and 2% sodium pyruvate). HEK 293T cells were cultured for lentiviral production in DMEM/Glutamax-5% fetal bovine serum, 1 mM sodium pyruvate, MEM nonessential amino acids, and penicillin–streptomycin. All cell culture products were purchased from GIBCO/Life Technologies, Paisley, UK. Primary B-cells were extracted from the spleen of BALB/c mice by negative selection as previously described (Vascotto et al., 2007) and activated for 24 h with 1 μM CpG (ODN 1826; Invivogen, Shatin, Hong Kong) in B-cell culture medium supplemented with nonessential amino acids.
Antibodies and reagents
We used rat anti-mouse LAMP-1 (BD Bioscience, San Jose, CA), anti–α-tubulin (clone YL1/2; Serotec, Oxford, UK), mouse anti–α-actin (clone C4; Merck Millipore, Darmstadt, Germany), biotinylated mouse anti–dynein-IC74 (clone 74.1; Santa Cruz Biotechnology, Dallas, TX), rabbit anti–γ-tubulin (kindly provided by Michel Bornens, Institut Curie, Paris, France), rabbit anti-GFP (Ozyme, Montigny le Bretonneux, France); rabbit anti-Par3 (Merck Millipore), and rabbit anti-dynein (Santa Cruz Biotechnology). We used the following secondary antibodies (Jackson ImmunoResearch, West Grove, PA): F(ab′)2 goat anti-mouse, F(ab′)2 donkey anti–rabbit-Cy3, F(ab′)2 goat anti–rabbit-Alexa Fluor 488, F(ab′)2 donkey anti–rat-Cy5, streptavidin–Alexa Fluor 488, streptavidin-Cy3, and streptavidin–Alexa Fluor 647. Ciliobrevin A (HPI-4; Sigma-Aldrich, St. Louis, MO) and CypHer5E (Amersham Bioscience, Little Chalfont, UK) were used according to manufacturers' instructions. Ovalbumin was purchased from Sigma-Aldrich.
Preparation of Ag-coated beads
We activated 4 × 10⁷ 3-μm latex NH2-beads (Polyscience, Eppelheim, Germany) with 8% glutaraldehyde for 2 h at room temperature. Beads were washed with phosphate-buffered saline (PBS) and incubated overnight at 4ºC with different ligands: 100 μg/ml of either F(ab′)2 goat anti-mouse immunoglobulin G (IgG) or F(ab')2 goat anti-mouse IgM (MP Biomedical, Santa Ana, CA).
Preparation of Ag-coated surfaces
Fluorodishes (MatTek, Ashland, MA) were coated overnight with 10 μg/ml of either F(ab′)2 goat anti-mouse IgG or F(ab′)2 goat anti-mouse-IgM (MP Biomedicals) and 0.5 μg/ml rat anti-mouse CD45R/B220 (eBioscience, San Diego, CA) diluted in cold PBS.
Preparation of planar lipid bilayers
Planar lipid bilayers were prepared following Carrasco et al. (2004), with minor modifications. Biotinylated (Fab′)2 anti-IgG or IgM was added to the lipid bilayer (20 μg/ml), and cells were monitored upon contact with bilayers. The fluidity of the lipid bilayers was tested by fluorescence recovery after photo bleaching close to each cell of interest. For single-molecule experiments in steady state, bilayers contained biotinylated anti-B220 (40 ng/ml) to favor cell adhesion. Cells were previously incubated with monovalent Fab anti-IgG Alexa Fluor 555 at 1 nM and deposited in the lipid chamber.
DNA constructs
LifeAct-CherryFP was a kind gift from P. Chavrier (Institut Curie, Paris, France). The Par3-GFP construct and shRNA-Par3 were kindly provided by Ira Mellman (Genentech, South San Francisco, CA) and Ian Macara (University of Virginia, Charlottesville, VA), respectively. Mouse Par3-YFP and Par3-Cter-YFP were previously characterized (Schmoranzer et al., 2009). The dynein-IC74-2C-RFP construct was a kind gift from F. Saudou (Institut Curie, Orsay, France) and previously characterized (Ha et al., 2008).
Cell transfection
We electroporated 2.5 × 10⁶ IIA1.6 B-lymphoma cells using Nucleofector R T16 (Lonza, Gaithersburg, MD) in the presence of 4 μg of plasmid DNA. Par3-GFP–transfected cells were cultured for 12–24 h before functional analysis. Transfection with shPar3 or shControl plasmids was done as previously described (Yuseff et al., 2011). B-cells infected with shPar3 or shControl lentiviruses were selected in puromycin and transfected after 96 h with cathepsin D–monomeric RFP (mRFP), centrin-GFP, LifeAct-CherryFP, or dynein-IC-RFP and analyzed within 24 h.
We electroporated 4 × 10⁶ CpG-treated primary B-cells using Mouse B Cell Nucleofector Kit (Lonza) in the presence of 100 nM of AllStars Negative Control siRNA (1027280; Quiagen, Hilden, Germany) for siControl or FlexiTube siRNA Mm_Pard3_4 and Mm_Pard3_2 (SI01369508 and SI01369494; Qiagen) for siPar3-A and siPar3-B, respectively. B-cells were resuspended in CpG-free prewarmed medium, and presentation experiments were performed 48 to 72 h after RNA interference transfection. Par3 levels were analyzed by Western blot as described later.
Lentiviral production and cell infection
The shRNAs used to silence Par3 in the IIA1.6 B-lymphoma cells were purified from MISSION shRNA Bacterial Glycerol Stocks (Sigma-Aldrich): shPar3-A TRCN0000094400, shPar3-B TRCN0000094401, and SHC002 as control (where not indicated in the figure legends, the data from shPar3-A and shPar3-B were pooled). Lentiviruses were produced by transfection in a 1:2.5:3 ratio of the envelope (pMD2G), the packaging (pPAX-2), and shRNA-encoding plasmids in 293T cells with Gene juice (Merck Millipore). Supernatants were harvested 72 h after transfection and ultracentrifuged at 100,000 × g for 90 min at 4°C. Pellets were resuspended in 2% bovine serum albumin (BSA)/PBS and frozen at −80°C for later use. IIA1.6 B-cells were infected (multiplicity of infection 20) with spin centrifugation with Polybrene (5 μg/ml). After 24 h, puromycin selection (5 μg/ml) was performed, and cells were assayed after 72–120 h. Par3 levels were analyzed by Western blot as described.
Western blotting
B-cells were lysed at 4ºC in buffer containing 0.5% NP-40, 50 mM Tris-HCl, pH 7.4, 150 mM NaCl, 1 mM dithiothreitol, Protease Inhibitor Cocktail (Roche, Basel, Switzerland), and Phosphatase Inhibitor Cocktail 2 (Sigma-Aldrich). Supernatants were collected and loaded onto NuPAGE SDS–PAGE gels (Invitrogen, Life Technologies) and transferred onto polyvinylidene fluoride membrane. Membranes were blocked in 5% nonfat dry milk and PBS–0.05% Tween-20 and incubated with antibodies against Par3 (1:1000; Millipore), pERK (1:1000; Cell Signaling, Danvers, MA), actin (1:5000; Millipore), or α-tubulin (1:5000; Serotec) as protein loading control, followed, respectively, by anti-rabbit (2X), -mouse, or -rat horseradish peroxidase–conjugated antibodies (Jackson ImmunoResearch). Western blots were developed with ECL reagents (Amersham), and chemiluminescence was detected with the LAS-3000 image analysis system (FujiFilm).
Rescue of Par3-silenced cells
Rescue of polarity in Par3-silenced cells was shown by measuring the polarity index of the MTOC in control (shCtrl) and silenced cells (shPar3) transfected 24 h after infection with either GFP- or Par3GFP-expressing plasmid. The images were taken with a spinning-disk microscope. To properly compare differently transfected cells, the analysis was restricted to cells presenting a GFP signal between 20 and 100% above the background.
Ag presentation assay
This was done as previously described (Yuseff et al., 2011). Briefly, after incubation of B-cells with Lack-coated beads containing or not BCR ligands for 4 h, cells were washed, and the B-cell line was fixed in ice-cold PBS/0.01% glutaraldehyde for 1 min and quenched with PBS/100 μM glycine. B-cells were incubated with Lack T-cell hybridoma overnight (ratio B-cell:T-cell, 2:1). Supernatants from each condition were collected, and IL-2 cytokine production assays were performed (BD Bioscience).
Activation of B-cells and immunofluorescence analysis
Cells were plated on poly-l-lysine–coated glass coverslips and activated with Ag-coated beads at a 1:1 ratio for different time points at 37°C and then fixed in 4% paraformaldehyde for 10 min at room temperature. Fixed cells were incubated with antibodies in PBS/0.2% BSA/0.05% saponin. Immunofluorescence images were acquired on a confocal microscope (LSM510 inverted laser scanning confocal [Carl Zeiss Micro-Imaging] and inverted spinning disk confocal [Roper/Nikon]) with a 60×/1.4 numerical aperture (NA) oil immersion objective.
BCR internalization assay
Control and Par3-silenced cells were washed with PBS and resuspended in 50% CLICK/50% RPMI-1640 at a density of 106 cells/ml. Cells were incubated with 10 μg/ml F(ab′)2 goat anti-mouse IgG premixed to 20 μg/ml F(ab′)2 donkey anti-goat IgG for 30 min at 4°C. Cells were washed twice with cold CLICK/RPMI to remove the excess ligand and incubated or not (negative control) at 37°C for the indicated time. Internalization was stopped by incubating the cells on ice and adding cold PBS plus 5% BSA. To detect receptors remaining on the cell surface, cells were stained for 30 min on ice with donkey–anti-goat IgG Alexa Fluor 488 and washed with PBS plus 5% BSA. Flow cytometry was performed on an AccuriC6 flow cytometer (BD Biosciences), and data were analyzed with Flowjo software. The percentage of BCR on the cell surface was calculated as (MFI at 37°C)/(MFI at 4°C) × 100, where MFI is mean fluorescence intensity.
Antigen extraction assay
Ovalbumin (OVA) and F(ab′)2 anti-mouse IgM or anti-mouse IgG fragments were coupled to NH2 beads in equal concentrations. Cells incubated in a 1:1 ratio with Ag-coated beads were plated on poly-l-lysine slides at 37°C, fixed, and stained for OVA with a polyclonal antibody. The amount of OVA present on the beads was calculated by establishing a fixed area around beads in contact with cells and measuring fluorescence on three-dimensional (3D) projections obtained from the sum of each plane (ImageJ). The percentage of antigen extracted was estimated by the percentage of fluorescence intensity lost by the beads after 1 h.
Membrane-spreading assay
The IgG+ B-lymphoma cells were incubated with Ag-coated beads for different time points at 37°C on poly-l slides. At the end of each time point, warm medium was quickly replaced by ice-cold PBS/0.2% BSA, and cells were left on ice, where the staining with the first antibody (anti-goat IgG coupled to Cy5) and membrane staining with WGA-Alexa Fluor 488 (Invitrogen) were performed. After 1 h, cells were washed on ice with cold PBS/0.2% BSA and fixed with 4% paraformaldehyde for 10 min on ice. Cells were permeabilized with PBS/0.2% BSA/0.05% saponin for 20 min at room temperature before staining with the second antibody (anti-goat IgG coupled to Cy3). Membrane spreading around the Ag-coated bead was determined qualitatively by estimating the number of beads nonprotected, partially protected, or completely protected from the first antibody staining under nonpermeabilized conditions.
Time-lapse imaging
Time-lapse confocal microscopy and live-imaging images were done of B-cells plated on poly-l-lysine–coated glass dishes (Fluorodish) for CypHer5E and Par3-GFP experiments. Images were acquired at 37ºC/4.5% CO2 on an inverted spinning disk confocal microscope (Eclipse Ti; Roper/Nikon) with a 60×/1.4 NA oil immersion objective with MetaMorph software.
TIRFM
TIRFM was performed on a Nikon Eclipse Ti inverted microscope equipped with a 100×/1.49 NA oil immersion objective and a Quantem512SC Roper electron-multiplying charge-coupled device (EMCCD) camera mounted on Dual-View system at 37ºC/4.5% CO2. Acquisition was made using MetaMorph. For analysis of Par3-GFP, LifeAct-CherryFP, and cathepsin D–mRFP polarization at the synapse, B-cells were plated onto Ag-coated glass-bottom dishes (Fluorodish), and images were acquired every 5 or 10 s for 30 min with an exposure time of 100 ms.
For dynein-IC74-RFP analysis, B-cells were plated with the same technique for 15 min before imaging, and frames were acquired by streaming at 10 Hz for 1 min.
SIM imaging
Acquisitions were performed in 3D SIM mode with an n-SIM Nikon microscope before image reconstruction using NIS-Elements software based on Gustafsson et al. (2008). The system was equipped with an APO TIRF 100×/1.49 NA oil immersion objective and an EMCCD DU-897 Andor camera.
Scanning electron microscopy
For scanning electron microscopy, cells preincubated with Ag-coated beads were loaded on a polylysine-coated coverslip and fixed with 2% glutaraldehyde in phosphate buffer at room temperature for 1 h. Samples were vacuum dried and dehydrated by critical-point drying with CO2. The specimens were mounted on metallic supports with carbon tape and ion sputtered with cathodic gold. Analysis of samples was performed on a Cambridge S 260 microscope at pressure of 10−7 torr.
Image deconvolution
Images were acquired with a wide-field Eclipse NiU Upright Microscope (Nikon) equipped for image deconvolution. Acquisition was performed using a 100× Plan Apo VC 1.4 oil objective and a highly sensitive cooled interlined CCD camera (CoolSnap HQ2; Roper). The deconvolution code we used is described in Sibarita (2005).
Image analysis
Analysis of Par3-GFP/Lifeact-mCherry TIRFM movies.
TIRF images of Par3-GFP and LifeAct-CherryFP were quantified with a custom-made Matlab program applied to the dual-view TIRF images: at each time point, the cell was identified by Otsu threshold on the actin channel. A kymograph was built for each channel starting from this mask and computing the average fluorescence intensity in concentric rings of width 1 pixel obtained by eroding the mask progressively.
Radial line scan.
The density of the BCR clusters and Par3 (Figure 7A) was quantified on TIRF images convolved with a Gaussian filter to reduce background salt-pepper noise; the average intensity over the radius was computed using the radial line scan plug-in of Fiji over the radius of the cell and averaging over 10 frames the three different time points (t = 0, 15, 30 min). The plotted lines were normalized over the total intensity on each channel.
Cluster dynamics.
TIRF multipositioning time-lapse movies of anti-BCR–labeled supported lipid bilayers were quantified as follows: for each movie, an automatic threshold (triangle method) was applied and the particles statistics extracted using Fiji-based macro (particles <3 square pixels were discarded). For each cell at each time point, the average area of top 10% brightest clusters was computed. The fold increase was computed with respect to the first time point.
Dynein recruitment analysis in three dimensions.
Dynein recruitment was estimated using a custom-made ImageJ routine. In both control and shPar3 cells, first the fluorescence signal density (obtained as the integrated signal divided by the volume in voxels of the region of interest) was computed for the cytoplasm and the synapse (ρcytoplasm and ρsynapse, respectively). The synapse was considered as three planes starting from the bottom plane. Dynein enrichment was defined as the ratio between fluorescence signal densities, ρsynapse/ρcytoplasm (1 = no enrichment).
Single-particle tracking.
For the dynein tracking, cells transfected with dynein IC74-RFP plasmid were plated on IgG-coated coverslips and observed on a TIRF setup. Movies of 3 min were taken at 10 Hz. After a global background subtraction, dynein spots were tracked using Trackmate plug-in on Fiji (Schindelin et al., 2012), and trajectories were further elaborated with custom-made Matlab software to get the average residence time distribution along the radius of the cells.
Single-molecule tracking.
Cells were plated on planar lipid bilayers and filmed on the TIRF setup. Movies of 30 s at 20 Hz were taken, and single-particle tracking was performed with an adapted version of the multiple target tracking program MTT (Serge et al., 2008). The pointing accuracy was measured on fluorophore attached to the coverslip as 40 nm. Trajectories <5 frames were discarded from statistics. Diffusion coefficients (D) were measured from a linear fit of the mean square displacement MSD(t) = 4Dt on the number of points that minimizes the error in the coefficient, taking into account the pointing accuracy, according to Michalet (2010). Only diffusion coefficients with a relative SE of 33% were considered in the analysis. Particles were considered immobile when D < 0.01 μm2/s.
Polarity analysis.
Three-dimensional stacks acquired with a spinning-disk microscope were quantified with a custom-made Matlab program. Briefly, the images were binarized in the GFP channel using the maximal entropy method on the whole 3D stack to obtain the geometrical center of mass of the cell. The maximal fluorescence was used to position the MTOC. The weighted center of mass of different channels was used to define the average position (x, y, z) of the cellular components (dynein, lysosomes). Cross-correlation with a previously acquired image of the bead was used to position the bead in three dimensions. After we extracted the positions of the bead (B), the cell center of mass (C), and the MTOC (M) or another fluorescent marker (F), we computed the polarity index as projection of the vector  along the vector
  normalized by the distance of bead to center of mass:. The index ranges between −1 (antipolarized) and 1 (fully polarized, object on the bead). Analogously the index for another fluorescence channel (such as dynein or lysosomes) was computed as above, replacing the position (M) of the MTOC with the one (F) of the center of mass of the signal in the specific channel.
Cathepsin D–mRFP recruitment analysis.
B-cells were plated onto Ag-coated cover slides 15 min before TIRFM imaging, and frames were acquired by streaming at 20 Hz in stacks of 600 images. Image segmentation and single-particle tracking were done with Multidimensional Image Analysis software (Racine et al., 2007) as previously described (Desnos et al., 2007). The diffusion coefficient Dxy was calculated by fitting the mean square displacement MSD(t) = 4Dxyt extracted from each trajectory on the first 10 time points.
Statistical tests
Statistical analysis was performed with Prism (GraphPad Software) or Matlab (MathWorks). The p values were computed using different tests as indicated in the figure legends; *0.01 < p < 0.05, **0.001 < p < 0.01, ***p < 0.001; ns, nonsignificant.
Supplementary Material
ACKNOWLEDGMENTS
We thank Yolanda Carrasco, Yohanns Bellaiche, and Matthieu Piel for critical reading of the manuscript. We gratefully acknowledge the Nikon Imaging Center, CNRS-Institut Curie, and PICT-IbiSA, Institut Curie, Paris, and members of the France-BioImaging national research infrastructure, especially P. Paul-Gilloteaux and V. Fraisier. We thank François-Xavier Gobert for help with lentiviral production. Scanning electronic microscopy was performed at the Service de Microscopie Électronique of Paris 6 University (Paris, France). A.R. and M.-I.Y. were supported by fellowships from the Ministère de l'Éducation Nationale, the Association pour la Recherche contre le Cancer, and the Fondation pour la Recherche Médicale. This work was funded by grants from the Young Investigator Program from the City of Paris and the European Research Council (Strapacemi 243103) to A-M.L.-D. and the Association Nationale pour la Recherche (ANR-12-Polybex to A-M.L.-D. and F.D. and ANR-2010-JCJC-Immuphy to P.P.).
Abbreviations used:
- Ag
antigen
- aPKC
atypical protein kinase C
- BCR
B-cell receptor
- MHC
major histocompatibility complex
- MTOC
microtubule-organizing center
- SIM
structured illumination microscopy
- TIRFM
total internal reflection fluorescence microscopy.
Footnotes
This article was published online ahead of print in MBoC in Press (http://www.molbiolcell.org/cgi/doi/10.1091/mbc.E14-09-1373) on January 28, 2015.
*These authors contributed equally.
†These authors contributed equally.
‡These authors contributed equally.
The authors declare no conflicts of interest.
REFERENCES
- Angus KL, Griffiths GM. Cell polarisation and the immunological synapse. Curr Opin Cell Biol. 2013;25:85–91. doi: 10.1016/j.ceb.2012.08.013. [DOI] [PMC free article] [PubMed] [Google Scholar]
- Arana E, Vehlow A, Harwood NE, Vigorito E, Henderson R, Turner M, Tybulewicz VL, Batista FD. Activation of the small GTPase Rac2 via the B cell receptor regulates B cell adhesion and immunological-synapse formation. Immunity. 2008;28:88–99. doi: 10.1016/j.immuni.2007.12.003. [DOI] [PubMed] [Google Scholar]
- Barnett BE, Ciocca ML, Goenka R, Barnett LG, Wu J, Laufer TM, Burkhardt JK, Cancro MP, Reiner SL. Asymmetric B cell division in the germinal center reaction. Science. 2012;335:342–344. doi: 10.1126/science.1213495. [DOI] [PMC free article] [PubMed] [Google Scholar]
- Batista FD, Harwood NE. The who, how and where of antigen presentation to B cells. Nat Rev Immunol. 2009;9:15–27. doi: 10.1038/nri2454. [DOI] [PubMed] [Google Scholar]
- Brezski RJ, Monroe JG. B cell antigen receptor-induced Rac1 activation and Rac1-dependent spreading are impaired in transitional immature B cells due to levels of membrane cholesterol. J Immunol. 2007;179:4464–4472. doi: 10.4049/jimmunol.179.7.4464. [DOI] [PubMed] [Google Scholar]
- Carrasco YR, Fleire SJ, Cameron T, Dustin ML, Batista FD. LFA-1/ICAM-1 interaction lowers the threshold of B cell activation by facilitating B cell adhesion and synapse formation. Immunity. 2004;20:589–599. doi: 10.1016/s1074-7613(04)00105-0. [DOI] [PubMed] [Google Scholar]
- Chang JT, Palanivel VR, Kinjyo I, Schambach F, Intlekofer AM, Banerjee A, Longworth SA, Vinup KE, Mrass P, Oliaro J, et al. Asymmetric T lymphocyte division in the initiation of adaptive immune responses. Science. 2007;315:1687–1691. doi: 10.1126/science.1139393. [DOI] [PubMed] [Google Scholar]
- Desnos C, Huet S, Fanget I, Chapuis C, Bottiger C, Racine V, Sibarita JB, Henry JP, Darchen F. Myosin va mediates docking of secretory granules at the plasma membrane. J Neurosci. 2007;27:10636–10645. doi: 10.1523/JNEUROSCI.1228-07.2007. [DOI] [PMC free article] [PubMed] [Google Scholar]
- Eilers PHC, Goeman JJ. Enhancing scatterplots with smoothed densities. Bioinformatics. 2004;20:623–628. doi: 10.1093/bioinformatics/btg454. [DOI] [PubMed] [Google Scholar]
- Fleire SJ, Goldman JP, Carrasco YR, Weber M, Bray D, Batista FD. B cell ligand discrimination through a spreading and contraction response. Science. 2006;312:738–741. doi: 10.1126/science.1123940. [DOI] [PubMed] [Google Scholar]
- Gérard A, Mertens AE, van der Kammen RA, Collard JG. The Par polarity complex regulates Rap1- and chemokine-induced T cell polarization. J Cell Biol. 2007;176:863–875. doi: 10.1083/jcb.200608161. [DOI] [PMC free article] [PubMed] [Google Scholar]
- Goehring NW, Trong PK, Bois JS, Chowdhury D, Nicola EM, Hyman AA, Grill SW. Polarization of PAR proteins by advective triggering of a pattern-forming system. Science. 2011;334:1137–1141. doi: 10.1126/science.1208619. [DOI] [PubMed] [Google Scholar]
- Grakoui A, Bromley SK, Sumen C, Davis MM, Shaw AS, Allen PM, Dustin ML. The immunological synapse: a molecular machine controlling T cell activation. Science. 1999;285:221–227. doi: 10.1126/science.285.5425.221. [DOI] [PubMed] [Google Scholar]
- Gundelfinger ED, Kessels MM, Qualmann B. Temporal and spatial coordination of exocytosis and endocytosis. Nat Rev Mol Cell Biol. 2003;4:127–139. doi: 10.1038/nrm1016. [DOI] [PubMed] [Google Scholar]
- Gustafsson MGL, Shao L, Carlton PM, Wang CJR, Golubovskaya IN, Cande WZ, Agard DA, Sedat JW. Three-dimensional resolution doubling in wide-field fluorescence microscopy by structured illumination. Biophys J. 2008;94:4957–4970. doi: 10.1529/biophysj.107.120345. [DOI] [PMC free article] [PubMed] [Google Scholar]
- Ha J, Lo KWH, Myers KR, Carr TM, Humsi MK, Rasoul BA, Segal RA, Pfister KK. A neuron-specific cytoplasmic dynein isoform preferentially transports TrkB signaling endosomes. J Cell Biol. 2008;181:1027–1039. doi: 10.1083/jcb.200803150. [DOI] [PMC free article] [PubMed] [Google Scholar]
- Harwood NE, Batista FD. New insights into the early molecular events underlying B cell activation. Immunity. 2008;28:609–619. doi: 10.1016/j.immuni.2008.04.007. [DOI] [PubMed] [Google Scholar]
- Iden S, Collard JG. Crosstalk between small GTPases and polarity proteins in cell polarization. Nat Rev Mol Cell Biol. 2008;9:846–859. doi: 10.1038/nrm2521. [DOI] [PubMed] [Google Scholar]
- Kupfer A, Swain SL, Singer SJ. The specific direct interaction of helper T cells and antigen-presenting B cells. II. Reorientation of the microtubule organizing center and reorganization of the membrane-associated cytoskeleton inside the bound helper T cells. J Exp Med. 1987;165:1565–1580. doi: 10.1084/jem.165.6.1565. [DOI] [PMC free article] [PubMed] [Google Scholar]
- Lankar D, Vincent-Schneider H, Briken V, Yokozeki T, Raposo G, Bonnerot C. Dynamics of major histocompatibility complex class II compartments during B cell receptor-mediated cell activation. J Exp Med. 2002;195:461–472. doi: 10.1084/jem.20011543. [DOI] [PMC free article] [PubMed] [Google Scholar]
- Liu X, Kapoor TM, Chen JK, Huse M. Diacylglycerol promotes centrosome polarization in T cells via reciprocal localization of dynein and myosin II. Proc Natl Acad Sci USA 16. 2013;110:11976–11981. doi: 10.1073/pnas.1306180110. [DOI] [PMC free article] [PubMed] [Google Scholar]
- Ludford-Menting MJ, Oliaro J, Sacirbegovic F, Cheah ET, Pedersen N, Thomas SJ, Pasam A, Iazzolino R, Dow LE, Waterhouse NJ, et al. A network of PDZ-containing proteins regulates T cell polarity and morphology during migration and immunological synapse formation. Immunity. 2005;22:737–748. doi: 10.1016/j.immuni.2005.04.009. [DOI] [PubMed] [Google Scholar]
- McCaffrey LM, Macara IG. The Par3/aPKC interaction is essential for end bud remodeling and progenitor differentiation during mammary gland morphogenesis. Genes Dev. 2009;23:1450–1460. doi: 10.1101/gad.1795909. [DOI] [PMC free article] [PubMed] [Google Scholar]
- Mellman I, Nelson WJ. Coordinated protein sorting, targeting and distribution in polarized cells. Nat Rev Mol Cell Biol. 2008;9:833–845. doi: 10.1038/nrm2525. [DOI] [PMC free article] [PubMed] [Google Scholar]
- Michalet X. Mean square displacement analysis of single-particle trajectories with localization error: Brownian motion in an isotropic medium. Phys Rev E Stat Nonlin Soft Matter Phys. 2010;82:041914. doi: 10.1103/PhysRevE.82.041914. [DOI] [PMC free article] [PubMed] [Google Scholar]
- Milasta S, Evans NA, Ormiston L, Wilson S, Lefkowitz RJ, Milligan G. The sustainability of interactions between the orexin-1 receptor and beta-arrestin-2 is defined by a single C-terminal cluster of hydroxy amino acids and modulates the kinetics of ERK MAPK regulation. Biochem J. 2005;387:573–584. doi: 10.1042/BJ20041745. [DOI] [PMC free article] [PubMed] [Google Scholar]
- Mitchison NA. T-cell-B-cell cooperation. Nat Rev Immunol. 2004;4:308–312. doi: 10.1038/nri1334. [DOI] [PubMed] [Google Scholar]
- Moss CX, Tree TI, Watts C. Reconstruction of a pathway of antigen processing and class II MHC peptide capture. EMBO J. 2007;26:2137–2147. doi: 10.1038/sj.emboj.7601660. [DOI] [PMC free article] [PubMed] [Google Scholar]
- Natkanski E, Lee WY, Mistry B, Casal A, Molloy JE, Tolar P. B cells use mechanical energy to discriminate antigen affinities. Science. 2013;340:1587–1590. doi: 10.1126/science.1237572. [DOI] [PMC free article] [PubMed] [Google Scholar]
- Quann EJ, Merino E, Furuta T, Huse M. Localized diacylglycerol drives the polarization of the microtubule-organizing center in T cells. Nat Immunol. 2009;10:627–635. doi: 10.1038/ni.1734. [DOI] [PubMed] [Google Scholar]
- Racine V, Sachse M, Salamero J, Fraisier V, Trubuil A, Sibarita JB. Visualization and quantification of vesicle trafficking on a three-dimensional cytoskeleton network in living cells. J Microsc. 2007;225:214–228. doi: 10.1111/j.1365-2818.2007.01723.x. [DOI] [PubMed] [Google Scholar]
- Schebesta A, McManus S, Salvagiotto G, Delogu A, Busslinger Ga, Busslinger M. Transcription factor Pax5 activates the chromatin of key genes involved in B cell signaling, adhesion, migration, and immune function. Immunity. 2007;27:49–63. doi: 10.1016/j.immuni.2007.05.019. [DOI] [PubMed] [Google Scholar]
- Schindelin J, Arganda-Carreras I, Frise E, Kaynig V, Longair M, Pietzsch T, Preibisch S, Rueden C, Saalfeld S, Schmid B, et al. Fiji: an open-source platform for biological-image analysis. Nat Methods. 2012;9:676–682. doi: 10.1038/nmeth.2019. [DOI] [PMC free article] [PubMed] [Google Scholar]
- Schmoranzer J, Fawcett JP, Segura M, Tan S, Vallee RB, Pawson T, Gundersen GG. Par3 and dynein associate to regulate local microtubule dynamics and centrosome orientation during migration. Curr Biol. 2009;19:1065–1074. doi: 10.1016/j.cub.2009.05.065. [DOI] [PMC free article] [PubMed] [Google Scholar]
- Schnyder T, Castello A, Feest C, Harwood NE, Oellerich T, Urlaub H, Engelke M, Wienands J, Bruckbauer A, Batista FD. B cell receptor-mediated antigen gathering requires ubiquitin ligase Cbl and adaptors Grb2 and Dok-3 to recruit dynein to the signaling microcluster. Immunity. 2011;34:905–918. doi: 10.1016/j.immuni.2011.06.001. [DOI] [PubMed] [Google Scholar]
- Serge A, Bertaux N, Rigneault H, Marguet D. Dynamic multiple-target tracing to probe spatiotemporal cartography of cell membranes. Nat Methods. 2008;5:687–694. doi: 10.1038/nmeth.1233. [DOI] [PubMed] [Google Scholar]
- Sibarita JD. Deconvolution microscopy. Adv Biochem Eng Biotechnol. 2005;95:201–243. doi: 10.1007/b102215. [DOI] [PubMed] [Google Scholar]
- Thaunat O, Granja AG, Barral P, Filby A, Montaner B, Collinson L, Martinez-Martin N, Harwood NE, Bruckbauer A, Batista FD. Asymmetric segregation of polarized antigen on B cell division shapes presentation capacity. Science. 2012;335:475–479. doi: 10.1126/science.1214100. [DOI] [PubMed] [Google Scholar]
- Tolar P, Sohn HW, Liu W, Pierce SK. The molecular assembly and organization of signaling active B-cell receptor oligomers. Immunol Rev. 2009;232:34–41. doi: 10.1111/j.1600-065X.2009.00833.x. [DOI] [PubMed] [Google Scholar]
- Treanor B, Depoil D, Gonzalez-Granja A, Barral P, Weber M, Dushek O, Bruckbauer A, Batista FD. The membrane skeleton controls diffusion dynamics and signaling through the B cell receptor. Immunity. 2010;32:1–13. doi: 10.1016/j.immuni.2009.12.005. [DOI] [PMC free article] [PubMed] [Google Scholar]
- Vascotto F, Lankar D, Faure-Andre G, Vargas P, Diaz J, Roux D Le, Yuseff MI, Sibarita JB, Boes M, Raposo G, et al. The actin-based motor protein myosin II regulates MHC class II trafficking and BCR-driven antigen presentation. J Cell Biol. 2007;176:1007–1019. doi: 10.1083/jcb.200611147. [DOI] [PMC free article] [PubMed] [Google Scholar]
- Yi J, Wu X, Chung AH, Chen JK, Kapoor TM, Hammer JA. Centrosome repositioning in T cells is biphasic and driven by microtubule end-on capture-shrinkage. J Cell Biol. 2013;202:779–792. doi: 10.1083/jcb.201301004. [DOI] [PMC free article] [PubMed] [Google Scholar]
- Yu CG, Harris TJC. Interactions between the PDZ domains of Bazooka (Par-3) and phosphatidic acid: in vitro characterization and role in epithelial development. Mol Biol Cell. 2012;23:3743–3753. doi: 10.1091/mbc.E12-03-0196. [DOI] [PMC free article] [PubMed] [Google Scholar]
- Yuseff MI, Reversat A, Lankar D, Diaz J, Fanget I, Pierobon P, Randrian V, Larochette N, Vascotto F, Desdouets C, et al. Polarized secretion of lysosomes at the B cell synapse couples antigen extraction to processing and presentation. Immunity. 2011;35:361–374. doi: 10.1016/j.immuni.2011.07.008. [DOI] [PubMed] [Google Scholar]
Associated Data
This section collects any data citations, data availability statements, or supplementary materials included in this article.