Abstract
A low native membrane permeability and ineffective access to the cellular cytosol, together with aggressive proteolytic degradation, often severely hampers the practical application of any therapeutic protein or antibody. Through engineering the charging profile of mesoporous silica nanoparticles, cellular uptake and subsequent subcellular distribution can be controlled. We show herein that programmed cell death can subsequently be induced across a population of cancer cells with remarkable efficacy on conjugating a specific caspase-cascade-activating cytochrome to such cytosol-accessing particles.
Keywords: apoptosis, endosomal escape, nanomaterials, proteins, therapeutics
Introduction
The ability to deliver functionally competent proteins or nucleic acids into live cells constitutes a potentially hugely powerful therapeutic modality.[1] Combatting inherent poor cellular permeability and proteolytic degradation[1] has, however, been challenging. A number of methods have been employed, with varying degrees of success, in overcoming both the physical barrier presented by the cell membrane and the chemical barrier presented by cell internal protease. These have included chemical or biological modifications to increase affinity for membrane transport proteins or the cell membrane itself,[2] and the utilisation of nanoparticles,[2b,3] with the latter approach being suggested to be particularly beneficial in protecting supported biomolecules from proteolytic degradation.[2b,3a,b,4]
During the past decade, numerous studies have examined the interactions of nanoparticles, including those based on a silica scaffold, with live cells.[5] From this, it has generally become acknowledged that nanoparticles are taken up through endocytosis and that the involvement of acidic endosomes/lysosomes, central in cellular degradation of foreign material, is characteristic.[6] In the vast majority of cases, particles taken up in this way are subsequently trapped within these compartments, unable to access the cytoplasm or nucleus or to directly influence cellular physiology.[7] From either gene transfection or protein delivery perspectives, payload access to the cytosol is a requirement;[7a,8] therefore, a number of approaches have been examined to facilitate the escape of nanoparticles or therapeutic agents from this default and highly acidic endo/lysosomal pathway.[2c,3a,9] In many cases this has been through engineering destructive or penetrating interactions with the endosome/lysosome membrane.[9b,10] An alternative approach based on a pH-buffering (“proton sponge”) effect has also been proposed and employed with some degree of success with inorganic nanoparticles.[9c,11] The effect is mediated by agents with high buffering capacities (chemically these contain weak basic amine-derived functional groups, such as quinoline,[3a] imidazole[9a,11b] or tertiary amines[9c]) capable of soaking up protons and generating a difference in osmotic pressure between endosomes and the cytosol. The subsequent influx of ions and water leads to endosomal membrane rupturing.[9d] Though the effectiveness of these approaches has been increasingly utilised, an understanding of the key design or mechanistic criteria has generally been lacking. We have sought, in the first instance here, to systematically investigate and then propose a more universal means of enabling endo/lysosomal escape, facilitating payload access to the cell cytosol.
Apoptosis, defined by characteristic nuclear morphology change (including chromatin condensation and fragmentation), overall cell shrinkage and the formation of apoptotic bodies, is distinguished from innate cell death (necrosis) by a programmed collapse of cellular infrastructure through proteolytic digestion by members of the caspase family of proteases.[12] A dominant route to triggering this programmed cell death involves the mitochondrial pathway, in which the release of “cytochrome c” into the cytosol and the subsequent activation of a caspase cascade is characteristic.[8] There have been, accordingly, several studies in which attempts have been made to directly deliver this small, membrane-impermeable protein to live cells using various vehicles.[2b,3a,b,4a,13] In some cases apoptosis has been noted,[2b,3a,13a] although this has been by no means a consistent observation.[3b,4a,13b] Attempts using silica nanoparticles as delivery systems for this protein, thus far, have been entirely without indication of cell death.[3b,4a] The aim of this work was to engineer nanoparticle scaffolds capable of reliably escaping into the cellular cytosol once taken up by live cells. These same particles were to then be surface modified with cytochrome c without disruption of endo/lysosomal escaping capacity in the hope that they could induce effective and characterised apoptotic cell death (unprecedented for particles of this type). Finally, the importance of nanoparticle retention of the cytochrome, as opposed to its release, was to be assessed from a triggered cell-killing perspective.
Results and Discussion
Engineering endo/lysosomal escape
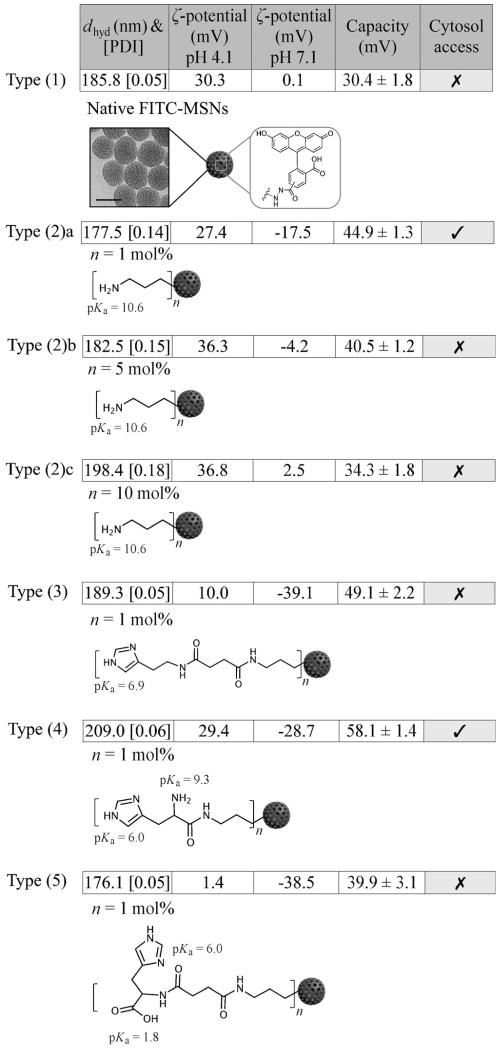
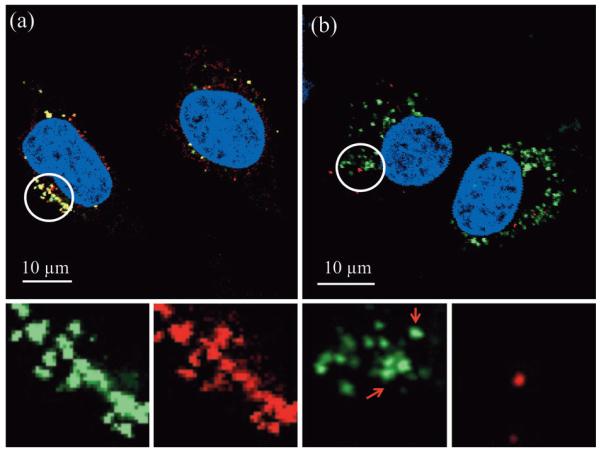
In order to effectively induce programmed cell death, it was initially necessary to design nanoparticles ultimately capable of reproducibly accessing the cellular cytoplasm. Significantly, though “proton-sponge effects” have been previously utilised, the associated chemistry is commonly cytotoxic,[14] and the significance of particle charging profile neither recognised nor examined. Herein, we start by preparing a range of mesoporous silica nanoparticles (MSNs) generated by a typical surfactant-templated and base-catalysed procedure.[15] MSNs were selected as the scaffold herein due to their convenient high surface area silanol surface modification and potential utility in further multimodal work. Surface modification and their ability to escape endo/lysosomal entrapment were investigated systematically. Particle distribution, stability, size and morphology, and the retention of these characteristics across all chemical and biological modifications was characterised by dynamic light scattering (DLS) and transmission electron microscopy (TEM; see Figure 1). The native luminescent MSNs were prepared by co-condensing tetraethyl orthosilicate (TEOS) and aminopropyltriethoxysilane (APTES) with templating cetyltrimethylammonium bromide (CTAB). The as-synthesised internally aminated MSNs were subsequently coupled with N-hydroxysuccinimide (NHS)-fluorescein to obtain internally luminescent MSNs where the unmodified external surfaces remain accessible for subsequent amine grafting and bio-functionalisation (FITC-MSNs, type (1); Figure 1). These constructs were then selectively modified with primary amines or imidazole functionalities. In the first instance, nanoparticle cytosol access was optimised through the mol% and pKa of amine groups post-grafted onto the MSNs. In order to initially consider the effects of functional group surface concentration, three different mol% (with respect to TEOS) of external primary amine modified luminescent MSNs were produced (namely 1 mol%, 5 mol% and 10 mol%) and designated as types (2)a, (2)b and (2)c, respectively (Figure 1). The cellular uptake characteristics (24 h incubations with human cervical carcinoma HeLa cells) of these are shown in the confocal images of Figure 2 and Figure S1 in the Supporting Information, which are representative of behaviour observed across the cell population. All three particle samples were reliably internalised within this timeframe by endocytosis. Although mitosis of HeLa cells occurs on a comparable time scale,[16] the cell contents, including endosomes and lysosomes, are generally distributed evenly,[17] and there are no grounds to believe this will affect the subcellular distribution of uptaken nanoparticles. The lack of overlap between type (2)a green particles and red endo/lysosomes (Figure 2b) illustrates that the particles have successfully escaped entrapment within these organelles (the coplanar characteristics of green particles, red endo/lysosomes and nucleus and their perfect spatial separation are shown in Z-stack images (Figure S1 in the Supporting Information), confirming the successful internalisation and cytosol access of nanoparticles. Note that nanoparticles present in cytosol are characteristically punctate in appearance; the perfect overlap shown in Figure 2a and Figure S1c of green particles and red endo/lysosomes with type (2)b and type (2)c nanoparticles indicates endo/lysosomal entrapment of particles.
Figure 1.
Structural representations of (1) native FITC-MSNs; (2) primary amine modified MSNs (a, b and c having 1, 5 and 10 mol% amination respectively); (3) 1 mol% imidazole modified MSNs; (4) 1 mol% primary amine and imidazole co-modified MSNs; (5) 1 mol % imidazole and carboxyl co-modified MSNs. Functional group pKa values and a summary of hydrodynamic diameter (dhyd), polydispersity index (PDI), ζ potential at two relevant pH boundaries, charging capacity and cytosol accessibility are also included. Data indicates surface modifications only have minor effects on particle hydrodynamic size and distribution (PDI values <0.3 across all particle types indicate excellent particle size distribution and colloidal stability). A typical TEM image of MSNs (95±8) nm is also shown in the first row (scale bar 100 nm). Note that DLS measures sizes based on the solvation state of particles in solution, resulting in larger values than that obtained from TEM.
Figure 2.
Merged representative confocal fluorescent images of HeLa cells 24 h after incubation (≈3×10³ cells with 200 μg mL−1 of MSNs) with a) 5 mol% primary amine modified MSNs, type (2)b, and b) 1 mol% primary amine modified MSNs, type (2)a. Spectrally resolved components of the circled regions are magnified and shown below each image. The images shown are entirely representative of the behaviour observed across the population of cells for each given particle type. The yellow in (a) indicates co-localisation of MSNs and endo/lysosomes. This localisation is confirmed on unmixing the particle and lysomal emissions (note the near perfect overlap of green particles and red lysosomes). For 1 mol% particles (b), subcellular distribution is markedly different and there is very little alignment of particle and lysosome emission. The ability of these particular particles to access the cytosol is additionally confirmed by Z-stack analysis, additional location specific staining, and control experiments with different exterior chemistries and protein appendages (Figure S1 in the Supporting Information).
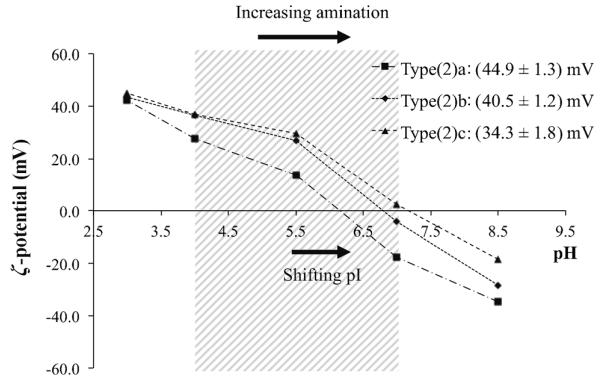
Initially, one may expect that a higher degree of amination, equating to a more potent pH-buffering ability, would translate into more effective escape from the endo/lysosomal pathway. Significantly, however, it was found that only the lowest mol% of aminated MSNs (1 mol%, type (2)a) were effective in this (Figure 2 and Figure S1 in the Supporting Information). To examine this further, the ζ potentials of the particles were screened across a broad pH range (Figure 3; the interior of an endosome is known to be acidic, pH≈6, becoming more so with fusion/maturation to lysosomes, pH≈4[18]). We define here as “charging capacity” the ζ-potential change between pH 4.1 and pH 7.1 (the shaded window in Figure 3). Significantly, 1 mol%, (2)a, and 10 mol%, (2)c, of aminated MSNs demonstrated the highest and the lowest charging capacities, respectively, among the three type (2) particles. A higher degree of surface amination (substitution of particle silanol groups pKa, ≈6.7, with primary APTES amine, pKa≈10.6)[19] specifically brought with it a progressive shift of particle pI towards higher values. Intimately associated with this was a progressive decrease in the magnitude of charging capacity within the pH window of interest (pH 4.1–7.1; see Figure 3). We suggest here that it was exactly this magnitude of particle charging that was dominant in triggering endo/lysosomal escape.
Figure 3.
Particle ζ potentials as a function of solution pH. Graph data points are the mean zeta values across five repetitions. The shaded area highlights the ζ-potential changes associated with the particles moving between pH 4.1 and pH 7.1. The charging capacities of each particle type are stated top right. A higher degree of amination pushes the particle pI towards higher values and the associated charging capacity within the window drops.
This optimal 1 mol% composition was subsequently mapped across particles decorated with different basic moieties. Type (3) particles bore surface imidazole groups; type (4) particles contained both primary amine and imidazole moieties on the surface; whereas particle type (5) possessed both carboxyl and imidazole groups (Figure 1). The successful introduction of each functional group was confirmed by tracking ζ-potential change (an accepted method of distinguishing nanoparticle surface modifications;[20] Table S1 in the Supporting Information) and FTIR following each reaction step (Figure S2 in the Supporting Information).
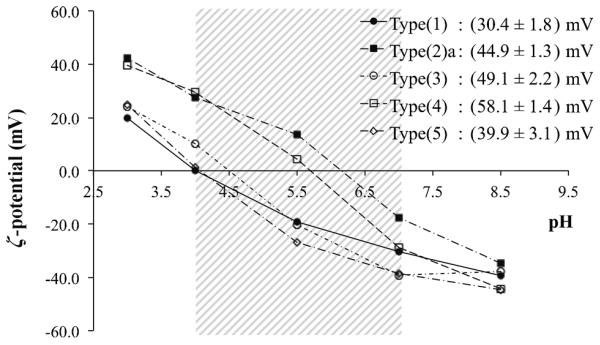
The specific ζ-potential changes of these particles are summarised in Figure 4. As expected, due to the absence of a basic function, native FITC-MSNs, type (1), demonstrated the lowest charging capacity within this low pH window (30 mV; it is likely that the secondary amine functions present in the FITC dye itself were responsible for the charging that was observed). For basic nanoparticles, consideration of the functional group pKa (APTES>histidine primary amine>imidazole>histidine imidazole>histidine carboxyl),[19a,21] allowed prediction of increasing pI in the order (5)<(3)<(4)<(2)a, a trend which was experimentally confirmed (Figure 4). Most significant here was the fact that type (4) particles had a pI located at the centre of the pH window of interest (≈pH 5.7) and accordingly exhibited the greatest charging capacity (the charging capacities of other particles fell as their pI’s moved away from this central point).
Figure 4.
Particle ζ potentials as a function of solution pH. Graph data points are the mean zeta values across five repetitions. The central shaded area highlights the ζ-potential changes across the pH 4.1–7.1 window. The charging capacities of each particle type are stated. pI increases through the particle series according to (5)<(3)<(4)<(2)a.
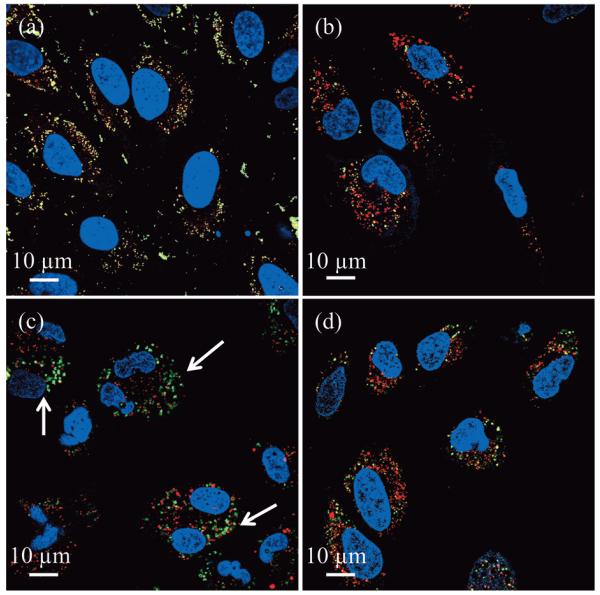
The uptake and subcellular distribution characteristics of these nanoparticle formulations (where yellow indicates a co-localisation of MSNs and endo/lysosomes) are summarised in Figure 5 and Figure S3 in the Supporting Information where it is evident that particles without possession of a basic moiety, type (1), were endo/lysosomally trapped. Significantly, the most charge sensitive particles, type (4), readily accessed the cell cytosol, but only if cationisation was marked in the pH range 4.1–7.1. Particle types (3) and (5), though exhibiting a large (>40 mV) charge change did not access the cytosol, presumably because cationisation, and thus association with the anionic membrane, even at pH 4.1, was limited (ζ potentials at pH 4.1 were (10.0±0.2) mV and (1.4±0.2) mV, respectively, compared to (29.4±0.2) mV for type (4)).
Figure 5.
Merged confocal fluorescent images of HeLa cells after 24 h incubation (≈3×10³ cells incubated with 200 μg mL−1 of MSNs) confirming that only 1 mol% primary amine and imidazole co-modified MSNs, type (4), are capable of escape into the cytosol. For the spectrally resolved components see Figure S3 in the Supporting Information. Images from (a) to (d) are the corresponding characteristic results associated with type (1), type (3), type (4) and type (5) particles, respectively. Yellow colour represents co-localised MSNs (green) and endo/lysosomes (red). Arrows indicate MSNs that have escaped endo/lysosomal entrapment. The images shown are entirely representative of the behaviour observed across the population of cells for each given particle type.
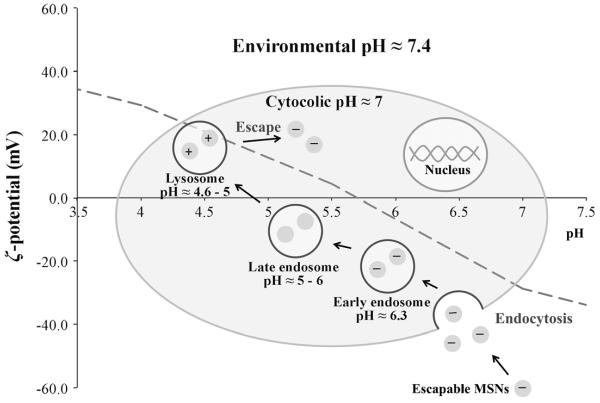
The uptake pathway of nanoparticles that were ultimately able to access the cell cytosol (type 2(a) and type (4)) can be resolved through co-localisation confocal studies at specific timeframes. After a 30 min incubation (that typical of early endosome confinement),[22] the particles indeed have shown no localisation within late endosomes/lysosomes (Figure S4a and c in the Supporting Information, stained with LysoTracker Red).[23] After 5 h, however, the particles were clearly entirely located within these locations, see Figure S4b and d in the Supporting Information—noting a perfect overlap between green nanoparticles and LysoTracker red. It is, thus, clear that the particles accessed the cell cytosol through the expected endocytotic pathway, having been taken up within 30 min (Figure S4 in the Supporting Information), ultimately localising in lysosomes after some 5 h, prior to escape into the cell cytosol (Figure 6), which occurred within 24 h.
Figure 6.
A schematic model of the endo/lysosomal escape process. The red pH profile shown is that of the optimised escapable nanoparticle, type (4). Particles initially exhibit a negative surface charge at pH≈7.4. After endocytosis, they are entrapped in acidic early endosomes (pH≈6.3) and then late endosomes (pH≈5–6), during which their surface charge becomes increasingly positively charged. When late endosomes fuse into lysosomes (pH≈4.6–5) the particle surface is highly cationic and escape occurs (see arrow indications in Figure 5c).
In a relatively simple consideration of functional group surface density and pKa, it was, thus, possible to demonstrate the importance of MSN surface charge profile (a substantial >40 mV change in ζ potential) and cationisation in facilitating escape from default endo/lysosomal entrapment following endocytosis. Our observations were consistent with particles initially passing into early endosomes (pH≈6.3,[18,24] where some retain a negative net charge). Maturation into late endosomes (pH≈5–6),[18,24] confirmed by the overlap of LysoTracker Red and particle emission[23] occurred after 5 h. Eventual fusion with lysosomes (pH≈4.6–5)[18,24] was followed by a surge in protonation/cationisaton, and osmotic pressure that resulted in rupturing and cytosolic release (Figure 2b, Figure 5c and Figure 6). The Z-stack analysis, location specific staining and control experiments unequivocally confirm cytosol access. In the next section, we utilise this ability to control subcellular nanoparticle localisation in triggering cell death.
Yeast cytochrome c (Cyt c)-induced programmed cell death
As noted earlier, several approaches to facilitate the delivery of cytochrome c to cells in an effort to effect programmed cell death have been reported. These have included the incubation of loaded nanoparticles (carbon nanotubes or MSNs),[3a,b,4a] pH-responsive polyionic micelles,[13b] or membrane penetration peptide-containing liposomes.[2b] The observations made across these works are highly varied; in some cases no toxic effects have been noted, even at comparatively high doses (750 pgcell−1, more than five-fold higher than used in this work—see below) for which the protein supposedly enjoys cytosol access.[4a]
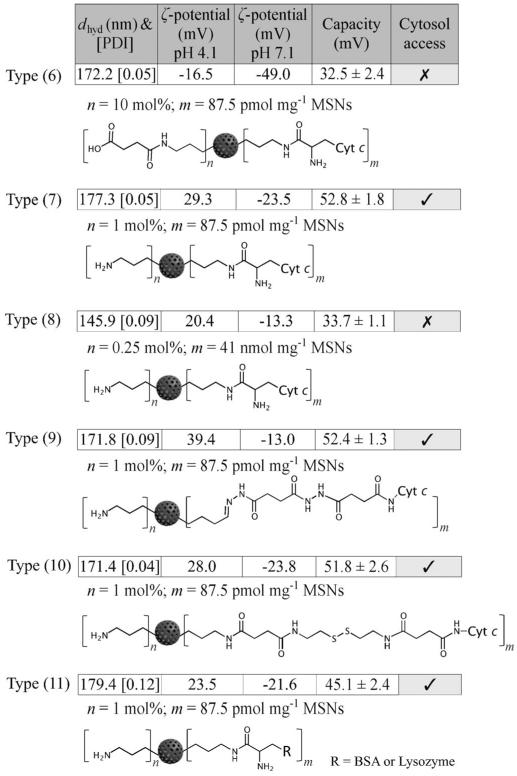
Herein, a number of cytochrome, bovine serum albumin (BSA) or lysozyme labelled MSNs were prepared using a range of linker chemistries (post grafted) through standard carbodiimide chemistry (particle types (6) to (11), Figure 7).[25] As the triggering of apoptosis requires the activation of cytosolic caspase by cytochrome c, all particles were designed using the cytosol-accessing surface chemistry detailed in the previous section by conjugating proteins onto 1 mol% primary amine modified particles and keeping the surface protein at a very low level (87.5 pmolmg−1, with a protein to amine molar ratio of <0.1%), such that the particle surface charge profiles, previously identified as being key to enabling subsequent endo/lysosomal escape, were unchanged. For type (7) and (11), note that the successful low-level protein modification was qualitatively confirmed by a BCA assay (shown in Figure S5 in the Supporting Information) and the charging/escape characteristics (charging capacity >40 mV with cationisation) of the nanoparticles remained after modification (see the tabulated summary in Figure 7). The exception was type (6) particles bearing 10 mol% surface carboxyl groups, which were used as negative controls (i.e., particles remained endo/lysosomally entrapped). MSNs with a higher cytochrome dose (type (8), 41 nmolmg−1 MSNs) but lacking endo/lysosomal escape capability were also produced to further examine the necessity of cytosolic access of cytochrome c to induce apoptosis. Notably, the protein was attached to particle types (6), (7), (8) and (11) through an uncleavable APTES linker.
Figure 7.
Structural representations of (6) cytochrome c (Cyt c) labelled MSNs with 10 mol% carboxyl coating; (7) cytochrome c labelled MSNs with 1 mol % primary amine coating; (8) cytochrome c labelled MSNs with 0.25 mol% primary amine coating; (9) acid-responsive cytochrome c labelled MSNs with 1 mol% primary amine coating; (10) reductant cleavable-responsive cytochrome c labelled MSNs with 1 mol% primary amine coating; (11) BSA or lysozyme labelled MSNs with 1 mol% primary amine coating. A summary of hydrodynamic diameter (dhyd), polydispersity index (PDI), ζ potential at two relevant pH boundaries, charging capacity and cytosol accessibility is also included for each particle type.
Acid-responsive hydrazine, type (9),[26] and redox-responsive disulfide, type (10),[27] chemistries were also used to create cleavable protein linkers in order to examine the potential importance of retaining the protein at the particle surface on its physiological activity. Particle chemical formulations were characterised by ζ-potential and FTIR changes following each reaction step (Table S1 and Figure S2 in the Supporting Information). Note that, since the low protein loadings fall below the threshold of FTIR, ratiometric BCA assays were employed to determine and semi-quantify protein presence. Importantly, the protein surface density (Figure S5 in the Supporting Information) on all the biomodified nanoparticles was kept consistent across the investigated samples unless otherwise stated.
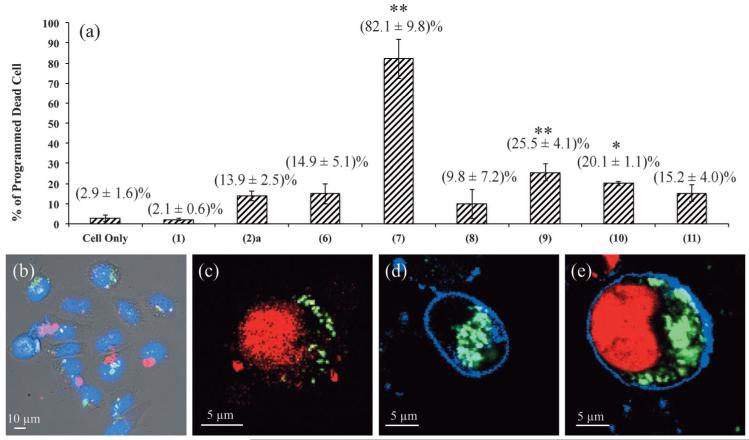
In line with the previously identified importance of nano-particle charging capacity, protein-modified particles (7), (9), (10) and (11) exhibited facile cytosol access whilst those of (6) and (8) did not (Figure 7 and Figure S6 in the Supporting Information). The physiological effects of these particles on HeLa cells (incubated at 200 μg mL−1 for 24 h) were examined using propidium iodide (PI), a dead cell stain (the percentage of cells undergoing programmed cell death was determined from the ratio of PI positive and negative cells), and summarised in Figure 8a and Table 1. The first point to note is that native FITC-MSNs, type (1), exhibited low cytotoxicity at doses up to 200 μg mL−1, comparable to nanoparticle-free cell controls (percentage of dead cells (2.1±0.6)% and (2.9±1.6)%, respectively). Particles capable of effective endo/lysosomal escape but without the appended cytochrome, type (2)a, exhibited slightly increased cellular toxicity (13.9±2.5)%. Most striking were the observations made with escapable cytochrome c functionalised particles, type (7), where cell death was dramatic (82.1±9.8)% across six repetitions and two separately prepared batches of particles, considerably exceeding that observed using microinjection[28] or polypeptides[13a] means of introducing this cytochrome. Significantly, this protein dose, delivered through an endocytic mechanism, is substantially lower than that used in prior work and represents the highest efficacy, in terms of cell death, reported to date.[4a]
Figure 8.
a) Haemocytometer data summarising the percentage of cells undergoing programmed cell death (determined from the ratio of PI positive and negative cells) as effected by dosing with different nanoparticle formulations as labelled (each dosage ≈3×10³ cells with 200 μg mL−1 MSNs, 24 h incubation). Data shown are the results of three repetitions across two separately prepared batches of particles (6 repetitions in total and an average of 250 cells analysed). * represents statistically significant results with P<0.05; ** with P<0.005. b) Merged confocal image with bright field, blue nucleus (Hoechst stained), green escapable cytochrome labelled type (7) particles and red caspase 3/7 at 9 h (at this time period, partial particle escape was observed and accordingly a caspase cascade initiation would be expected prior to high levels of cell death), confirming particle triggered caspase cascade, the precursor to apoptotic cell death. Confocal fluorescent images show HeLa cell suspensions after 24 h incubation with c) particle type (2)a and d), e) particle type (7). AnnV (blue) binds phosphatidylserine on the outer membrane leaflet of apoptotic cells and indicates the cell boundary within which MSNs are clearly internalised (green). The dead cell indicator, PI (red), binds to nucleic acids (nucleus). c) Necrotic cells are AnnV-negative/PI-positive showing only red nucleus; d) early apoptotic cells are AnnV-positive/PI-negative, showing only blue membrane stain; e) late apoptotic cells are AnnV-positive/PI-positive[29] showing both red nucleus and blue membrane stain. The images shown are entirely representative of the behaviour observed across the population of cells for each given particle type.
Table 1.
Summary of programmed cell death (24 h, 200 μg mL−1 dose).[a]
| MSN Type | Charging Capacity >40 mV | Highly Cationic at pH 4.1 | Endosomal Escape | Permanently Immobilised Cyt c | Programmed Cell Death |
|---|---|---|---|---|---|
| (1) | x | x | x | x | x |
| (2)a | ✓ | ✓ | ✓ | x | x |
| (6) | ✓ | x | x | ✓ | x |
| (7) | ✓ | ✓ | ✓ | ✓ | ✓ |
| (8) | x | ✓ | x | ✓ | x |
| (9) | ✓ | ✓ | ✓ | x | x |
| (10) | ✓ | ✓ | ✓ | x | x |
| (11) | ✓ | ✓ | ✓ | x | x |
✓=Presence of MSNs properties; x=absence of MSNs properties.
Entry of a cell into an apoptotic phase is associated with a series of caspase cascades and subsequent membrane inversion.[29b] A caspase 3/7 reporter based on a fluorescent inhibitor of caspase (FLICA) technique (Figure 8b);[30] was thus employed to confirm caspase activation (at 9 h, before significant cell death had occurred). To further confirm that these cells continued to later apoptosis with membrane inversion (and that cell death was not a result of any innate native nanoparticle toxicity), the cells were co-stained with Annexin V (AnnV), an accepted apoptotic cell indicator that binds to phosphatidyl serine on the outer membrane leaflet.[29] As shown in Figure 8c–e, necrotic cells were AnnV-negative/PI-positive, early apoptotic cells were AnnV-positive/PI-negative and late apoptotic cells were AnnV-positive/PI-positive.[29a] These analyses clearly demonstrated that cells treated with cytochrome labelled escapable particles, type (7), followed the apoptotic pathway of programmed cell death (Figure 8d and e). Figure S7 in the Supporting Information summarises the percentages of AnnV-positive cells and PI-positive cells with respect to the total cell number. Significantly, the cytochrome labelled particles, type (7), which induced the highest percentage of cell death have shown a correspondingly high percentage of AnnV-positive cells (compared to PI-positive cells), confirming, once more, that the cells died apoptotically.
An equivalent cell incubation with cytochrome c modified particles incapable of endo/lysosomal escape, type (6), led to limited cell death (14.9±5.1)%. Similarly, for non-escapable particles for which cytochrome loading was markedly increased (type (8), 500 fold to 41 nmol per mg MSNs), cell death was limited (9.8±7.2)%. Cell incubation with an equivalent dose (140 pgcell−1) of FITC-labelled cytochrome c alone (not particle bound) led to undetectable uptake by confocal fluorescent microscopy and low cell death, comparable to controls. To confirm that the observed profound nanoparticle toxicity was not a general feature of any protein-decorated MSN capable of accessing the cellular cytosol, that is, it was cytochrome c specific, we have examined the effects of an equivalent dose of BSA-labelled particles capable of endo/lysosomal escape, type (11), where only low toxicity levels (15.2±4.0)% were observed (Figure 8a). Another protein control with comparable size and pI to cytochrome c, lysozyme (14.3 kDa, pI=11.35), was also investigated showing no apoptosis triggering capability (Figure S7 in the Supporting Information). Worth noting again here is the fact that these potent particles were associated with uncleavable (amide) anchored cytochrome.[31]
As noted previously, loss of free protein or peptide activity through proteolytic degradation is well-documented,[1,2b,32] as is the potential stabilising effect of tethering proteins to nanoparticles.[2b,33] To examine the potential role of nanoparticle stabilisation of the functional protein in this work, we have generated and examined the impact of cellular exposure to particle formulations in which the protein was bound through a reductively[7b,27] or pH[4b,26]-cleavable linker, particle types (9) and (10). The pH or reductant-initiated cleavage of protein from these particles was initially confirmed (Figure S5 in the Supporting Information). Significantly, these particles, though exhibiting high levels of charge change and cytosol access (see Figure 7, Table 1 and Figure S6 in the Supporting Information), induced only limited degrees of cell death, (25.5±4.1)% and (20.1±1.1)%, respectively, consistent with the detrimental effects of rapid proteolytic degradation of released cytochrome and, consequently, a markedly reduced efficiency of caspase cascade triggering.[1b,13a,32,34] These observations demonstrate the importance of MSN confinement in stabilising the cytochrome against degradation (by either local pH as the particle moves through the endosomal pathway or cytosolic proteases once cytosol access is finally secured).
Conclusion
The development of efficient therapies based on proteins, protein fragments or antibodies requires that these molecules are efficiently and safely delivered and exposed to the cellular machinery on which they are designed to operate. The profoundly low membrane permeability and stability in the face of acidified environments or active proteases is, very commonly, prohibitively limiting. Herein, we have systematically investigated the importance of surface potential and cationisation in mediating the effective access of MSNs to the cytosol of human cancer cells through a careful engineering of particle pI by tracking modified particles as they were transported through late endosomes, lysosomes and finally into the cytosol with confocal microscopy. In doing so, we have shown that this was most effective when ζ-potential changes exceeded 40 mV (see Table 1) and noted that these modified particles demonstrated low native cytotoxic responses in vitro. The 12 kDa mitochondrial cytochrome, cytochrome c, is known to be effective in initiating the activation of a “caspase cascade” and, subsequently, cell death if cytosol access is achieved without rapid degradation. On incorporating a low dose (140 pgcell−1) of this protein onto the surface of optimised cytosol-accessing fluorescent MSN formulations it was possible to induce programmed cell death with remarkable efficacy (>80%) in human cervical carcinoma HeLa cells, as monitored using an apoptosis-specific Annexin V assay and a caspase reporter. This cell suicide pathway, mechanistically common to all mammalian cells,[8] was effected here by both the cytosolic accessibility of the nanoparticle payload and the conformational stability afforded to the cytochrome through its surface confinement (particles have a stabilising effect and prevent tethered proteins from proteolytic degradation).[2b] To the best of our knowledge, the delivery mechanism outlined herein is without precedent and we believe the work to be highly relevant to the development of nanoparticle-based therapies generally.
Experimental Section
The native luminescent MSNs are prepared by co-condensing tetraethyl orthosilicate (TEOS) and aminopropyltriethoxysilane (APTES) with templating cetyltrimethylammonium bromide (CTAB). The as-synthesised internally aminated MSNs are subsequently coupled with N-hydroxysuccinimide (NHS)-fluorescein to obtain internally luminescent MSNs. Three different mol % of APTES are post-grafted onto native FITC-MSNs to produce type (2) particles (1 mol%, 5 mol% and 10 mol% with respect to TEOS; mol % calculated from the molar percentage ratio of amine functionalities with respect to TEOS during the reaction steps). Type (3) particles are synthesised by post-carboxylation of type (2)a MSNs and subsequent N-(3-dimethylaminopropyl)-N′-ethylcarbodiimide (EDC) and NHS-promoted histamine conjugation. A substitution of histamine with histidine generates type (5) particles. Direct histidine conjugation onto type (2)a particles generates (4) bearing surface primary amine and imidazole groups. Type (6) particles are prepared by carboxylating 10 mol % aminated MSNs followed by 87.5 pmolmg−1 MSNs of cytochrome coupling. The same proportion of cytochrome c or BSA (87.5 pmolmg−1 MSNs) is coupled onto 1 mol% primary amine modified MSNs, to yield particle types (7) and (11), respectively. A higher amount of cytochrome c (41 nmolmg−1 MSNs) is coupled to 0.5 mol % primary amine modified MSNs to prepare particle type (8). For the preparation of particles with acid-responsive protein linkers, native FITC-MSNs are aldehyde modified by post-grafting triethoxysilylbutyraldehyde followed by nucleophilic addition of succinic dihydrazide. The resulting hydrazone modified MSNs are then post-functionalised with APTES at 1 mol% and conjugated with cytochrome c, to generate particle type (9). Disulfide linked particles (10) are prepared by coupling cystamine to carboxylated MSNs followed by 1 mol % of APTES grafting and cytochrome attachment. Particle modifications were tracked at each step using ζ potential and FTIR spectroscopy; for these, further details of concentrations of each reactant, the specific reaction conditions and cellular experiments, see the Supporting Information.
Supplementary Material
Acknowledgements
This work was supported by the Wellcome Trust (WT094114MA). The authors would like to thank the Research Complex, Harwell, Rutherford Appleton Laboratory, Oxford for use of electron microscopy facilities.
Footnotes
Supporting information for this article is available on the WWW under http://dx.doi.org/10.1002/chem.201303239.
References
- [1].a) Smith DA, van de Waterbeemd H. Curr. Opin. Chem. Biol. 1999;3:373–378. doi: 10.1016/s1367-5931(99)80056-8. [DOI] [PubMed] [Google Scholar]; b) Adessi C, Soto C. Curr. Med. Chem. 2002;9:963–978. doi: 10.2174/0929867024606731. [DOI] [PubMed] [Google Scholar]
- [2].a) Yang C, Tirucherai GS, Mitra AK. Expert Opin. Biol. Ther. 2001;1:159–175. doi: 10.1517/14712598.1.2.159. [DOI] [PubMed] [Google Scholar]; b) Kim SK, Foote MB, Huang L. Biomaterials. 2012;33:3959–3966. doi: 10.1016/j.biomaterials.2012.02.010. [DOI] [PMC free article] [PubMed] [Google Scholar]; c) Yang ST, Zaitseva E, Chernomordik LV, Melikov K. Biophys. J. 2010;99:2525–2533. doi: 10.1016/j.bpj.2010.08.029. [DOI] [PMC free article] [PubMed] [Google Scholar]
- [3].a) Kam NWS, Dai HJ. J. Am. Chem. Soc. 2005;127:6021–6026. [Google Scholar]; b) Slowing II, Trewyn BG, Lin VSY. J. Am. Chem. Soc. 2007;129:8845–8849. doi: 10.1021/ja0719780. [DOI] [PubMed] [Google Scholar]; c) Bale SS, Kwon SJ, Shah DA, Banerjee A, Dordick JS, Kane RS. ACS Nano. 2010;4:1493–1500. doi: 10.1021/nn901586e. [DOI] [PubMed] [Google Scholar]
- [4].a) Park HS, Kim C, Lee HJ, Choi JH, Lee SG, Yun YP, Kwon IC, Lee SJ, Jeong SY, Lee SC. Nanotechnology. 2010;21:225101–225109. doi: 10.1088/0957-4484/21/22/225101. [DOI] [PubMed] [Google Scholar]; b) Lin CH, Cheng SH, Liao WN, Wei PR, Sung PJ, Weng CF, Lee CH. Int. J. Pharm. 2012;429:138–147. doi: 10.1016/j.ijpharm.2012.03.026. [DOI] [PubMed] [Google Scholar]
- [5].a) Nan AJ, Bai X, Son SJ, Lee SB, Ghandehari H. Nano Lett. 2008;8:2150–2154. doi: 10.1021/nl0802741. [DOI] [PubMed] [Google Scholar]; b) Napierska D, Thomassen LCJ, Rabolli V, Lison D, Gonzalez L, Kirsch-Volders M, Martens JA, Hoet PH. Small. 2009;5:846–853. doi: 10.1002/smll.200800461. [DOI] [PubMed] [Google Scholar]; c) Li ZX, Barnes JC, Bosoy A, Stoddart JF, Zink JI. Chem. Soc. Rev. 2012;41:2590–2605. doi: 10.1039/c1cs15246g. [DOI] [PubMed] [Google Scholar]
- [6].a) Doherty GJ, McMahon HT. Annu. Rev. Biochem. 2009;78:857–902. doi: 10.1146/annurev.biochem.78.081307.110540. [DOI] [PubMed] [Google Scholar]; b) Iversen TG, Skotland T, Sandvig K. Nano Today. 2011;6:176–185. [Google Scholar]
- [7].a) Sokolova V, Epple M. Angew. Chem. 2008;120:1402–1416. doi: 10.1002/anie.200703039. [DOI] [PubMed] [Google Scholar]; Angew. Chem. Int. Ed. 2008;47:1382–1395. doi: 10.1002/anie.200703039. [DOI] [PubMed] [Google Scholar]; b) Sauer AM, Schlossbauer A, Ruthardt N, Cauda V, Bein T, Brauchle C. Nano Lett. 2010;10:3684–3691. doi: 10.1021/nl102180s. [DOI] [PubMed] [Google Scholar]
- [8].Jiang XJ, Wang XD. Annu. Rev. Biochem. 2004;73:87–106. doi: 10.1146/annurev.biochem.73.011303.073706. [DOI] [PubMed] [Google Scholar]
- [9].a) Mishra S, Heidel JD, Webster P, Davis ME. J. Controlled Release. 2006;116:179–191. doi: 10.1016/j.jconrel.2006.06.018. [DOI] [PubMed] [Google Scholar]; b) Febvay S, Marini DM, Belcher AM, Clapham DE. Nano Lett. 2010;10:2211–2219. doi: 10.1021/nl101157z. [DOI] [PMC free article] [PubMed] [Google Scholar]; c) Xia TA, Kovochich M, Liong M, Meng H, Kabehie S, George S, Zink JI, Nel AE. ACS Nano. 2009;3:3273–3286. doi: 10.1021/nn900918w. [DOI] [PMC free article] [PubMed] [Google Scholar]; d) Varkouhi AK, Scholte M, Storm G, Haisma HJ. J. Controlled Release. 2011;151:220–228. doi: 10.1016/j.jconrel.2010.11.004. [DOI] [PubMed] [Google Scholar]
- [10].Huang HW, Chen FY, Lee MT. Phys. Rev. Lett. 2004;92:198304–198307. doi: 10.1103/PhysRevLett.92.198304. [DOI] [PubMed] [Google Scholar]
- [11].a) Slowing I, Trewyn BG, Lin VSY. J. Am. Chem. Soc. 2006;128:14792–14793. doi: 10.1021/ja0645943. [DOI] [PubMed] [Google Scholar]; b) Mo R, Sun Q, Xue J, Li N, Li W, Zhang C, Ping Q. Adv. Mater. 2012;24:3659–3665. doi: 10.1002/adma.201201498. [DOI] [PubMed] [Google Scholar]
- [12].Kroemer G, El-Deiry WS, Golstein P, Peter ME, Vaux D, Vandenabeele P, Zhivotovsky B, Blagosklonny MV, Malorni W, Knight RA, Piacentini M, Nagata S, Melino G. Cell Death Differ. 2005;12:1463–1467. doi: 10.1038/sj.cdd.4401724. [DOI] [PubMed] [Google Scholar]
- [13].a) Barnes MP, Shen WC. Int. J. Pharm. 2009;369:79–84. doi: 10.1016/j.ijpharm.2008.10.036. [DOI] [PubMed] [Google Scholar]; b) Lee Y, Ishii T, Cabral H, Kim HJ, Seo JH, Nishiyama N, Oshima H, Osada K, Kataoka K. Angew. Chem. 2009;121:5413–5416. doi: 10.1002/anie.200900064. [DOI] [PubMed] [Google Scholar]; Angew. Chem. Int. Ed. 2009;48:5309–5312. doi: 10.1002/anie.200900064. [DOI] [PubMed] [Google Scholar]
- [14].Wagner E. Acc. Chem. Res. 2012;45:1005–1013. doi: 10.1021/ar2002232. [DOI] [PubMed] [Google Scholar]
- [15].Davis JJ, Huang W-Y, Davies G-L. J. Mater. Chem. 2012;22:22848–22850. doi: 10.1039/C2JM35116A. [DOI] [PMC free article] [PubMed] [Google Scholar]
- [16].Zeilig CE, Johnson RA, Sutherland EW, Friedman DL. J. Cell Biol. 1976;71:515–534. doi: 10.1083/jcb.71.2.515. [DOI] [PMC free article] [PubMed] [Google Scholar]
- [17].Bergeland T, Widerberg J, Bakke O, Nordeng TW. Curr. Biol. 2001;11:644–651. doi: 10.1016/s0960-9822(01)00177-4. [DOI] [PubMed] [Google Scholar]
- [18].Bright NA, Gratian MJ, Luzio JP. Curr. Biol. 2005;15:360–365. doi: 10.1016/j.cub.2005.01.049. [DOI] [PubMed] [Google Scholar]
- [19].a) Wang S, Xue J, Ge X, Fan H, Xu H, Lu JR. Chem. Commun. 2012;48:9415–9417. doi: 10.1039/c2cc34667b. [DOI] [PubMed] [Google Scholar]; b) Iler RK. Knovel (Firm) Wiley; New York: 1979. [Google Scholar]
- [20].Crayton SH, Tsourkas A. ACS Nano. 2011;5:9592–9601. doi: 10.1021/nn202863x. [DOI] [PMC free article] [PubMed] [Google Scholar]
- [21].a) Smith FA, Whittington J. J. Exp. Bot. 1988;39:1549–1560. [Google Scholar]; b) Voet D, Voet JG. Biochemistry. 2nd ed. Wiley; New York: 1995. [Google Scholar]
- [22].a) Slowing II, Vivero-Escoto JL, Wu CW, Lin VSY. Adv. Drug Delivery Rev. 2008;60:1278–1288. doi: 10.1016/j.addr.2008.03.012. [DOI] [PubMed] [Google Scholar]; b) Vonderheit A, Helenius A. PloS Biol. 2005;3:1225–1238. doi: 10.1371/journal.pbio.0030233. [DOI] [PMC free article] [PubMed] [Google Scholar]
- [23].a) Belleudi F, Leone L, Aimati L, Stirparo MG, Cardinali G, Marchese C, Frati L, Picardo M, Torrisi MR. FASEB J. 2006;20:395–397. doi: 10.1096/fj.05-3934fje. [DOI] [PubMed] [Google Scholar]; b) Huynh KK, Eskelinen EL, Scott CC, Malevanets A, Saftig P, Grinstein S. EMBO J. 2007;26:313–324. doi: 10.1038/sj.emboj.7601511. [DOI] [PMC free article] [PubMed] [Google Scholar]
- [24].Sorkin A, von Zastrow M. Nat. Rev. Mol. Cell Biol. 2002;3:600–614. doi: 10.1038/nrm883. [DOI] [PubMed] [Google Scholar]
- [25].Huang WY, Davies GL, Davis JJ. Chem. Commun. 2013;49:60–62. doi: 10.1039/c2cc37545a. [DOI] [PMC free article] [PubMed] [Google Scholar]
- [26].Lee CH, Cheng SH, Huang IP, Souris JS, Yang CS, Mou CY, Lo LW. Angew. Chem. 2010;122:8390–8395. doi: 10.1002/anie.201002639. [DOI] [PubMed] [Google Scholar]; Angew. Chem. Int. Ed. 2010;49:8214–8219. doi: 10.1002/anie.201002639. [DOI] [PubMed] [Google Scholar]
- [27].Luo Z, Cai KY, Hu Y, Zhao L, Liu P, Duan L, Yang WH. Angew. Chem. 2011;123:666–669. doi: 10.1002/anie.201005061. [DOI] [PubMed] [Google Scholar]; Angew. Chem. Int. Ed. 2011;50:640–643. doi: 10.1002/anie.201005061. [DOI] [PubMed] [Google Scholar]
- [28].Li F, Srinivasan A, Wang Y, Armstrong RC, Tomaselli KJ, Fritz LC. J. Biol. Chem. 1997;272:30299–30305. doi: 10.1074/jbc.272.48.30299. [DOI] [PubMed] [Google Scholar]
- [29].a) Baskic D, Popovic S, Ristic P, Arsenijevic NN. Cell Biol. Int. 2006;30:924–932. doi: 10.1016/j.cellbi.2006.06.016. [DOI] [PubMed] [Google Scholar]; b) Cho MH, Lee EJ, Son M, Lee JH, Yoo D, Kim JW, Park SW, Shin JS, Cheon J. Nat. Mater. 2012;11:978–985. doi: 10.1038/nmat3430. [DOI] [PubMed] [Google Scholar]
- [30].Darzynkiewicz Z, Pozarowski P, Lee BW, Johnson GL. Methods Mol. Biol. 2011;682:103–114. doi: 10.1007/978-1-60327-409-8_9. [DOI] [PMC free article] [PubMed] [Google Scholar]
- [31].Kalia J, Raines RT. Curr. Org. Chem. 2010;14:138–147. doi: 10.2174/138527210790069839. [DOI] [PMC free article] [PubMed] [Google Scholar]
- [32].Ferraro E, Pulicati A, Cencioni MT, Cozzolino M, Navoni F, di Martino S, Nardacci R, Carri MT, Cecconi F. Mol. Biol. Cell. 2008;19:3576–3588. doi: 10.1091/mbc.E07-09-0858. [DOI] [PMC free article] [PubMed] [Google Scholar]
- [33].a) Jordan BJ, Hong R, Gider B, Hill J, Emrick T, Rotello VM. Soft Matter. 2006;2:558–560. doi: 10.1039/b603980d. [DOI] [PubMed] [Google Scholar]; b) Petersen LK, Sackett CK, Narasimhan B. Acta Biomater. 2010;6:3873–3881. doi: 10.1016/j.actbio.2010.04.004. [DOI] [PubMed] [Google Scholar]
- [34].Huffman HA, Sadeghi M, Seemuller E, Baumeister W, Durin MF. Biochemistry. 2003;42:8679–8686. doi: 10.1021/bi027310+. [DOI] [PubMed] [Google Scholar]
Associated Data
This section collects any data citations, data availability statements, or supplementary materials included in this article.


