

Abstract
In this work, a new active cavitation mapping technique for pulsed high-intensity focused ultrasound (pHIFU) applications termed bubble Doppler is proposed and its feasibility tested in tissue-mimicking gel phantoms. pHIFU therapy uses short pulses, delivered at low pulse repetition frequency, to cause transient bubble activity that has been shown to enhance drug and gene delivery to tissues. The current gold standard for detecting and monitoring cavitation activity during pHIFU treatments is passive cavitation detection (PCD), which provides minimal information on the spatial distribution of the bubbles. B-mode imaging can detect hyperecho formation, but has very limited sensitivity, especially to small, transient microbubbles. The bubble Doppler method proposed here is based on a fusion of the adaptations of three Doppler techniques that had been previously developed for imaging of ultrasound contrast agents – color Doppler, pulse inversion Doppler, and decorrelation Doppler. Doppler ensemble pulses were interleaved with therapeutic pHIFU pulses using three different pulse sequences and standard Doppler processing was applied to the received echoes. The information yielded by each of the techniques on the distribution and characteristics of pHIFU-induced cavitation bubbles was evaluated separately, and found to be complementary. The unified approach - bubble Doppler – was then proposed to both spatially map the presence of transient bubbles and to estimate their sizes and the degree of nonlinearity.
Keywords: cavitation, pulsed high-intensity focused ultrasound, Doppler imaging
I. Introduction
Pulsed high-intensity focused ultrasound (pHIFU) therapy is a modality used in such clinical applications as drug and gene delivery, where mild mechanical disruption of tissue by bubbles is desired, and thermal effects are to be avoided. Therefore, pHIFU treatment protocols consist of short pulses, delivered at low pulse repetition frequency, to cause transient cavitation bubble activity. pHIFU exposures have been extensively used to enhance drug/gene delivery to tumors with and without the assistance of microbubbles [1]–[3]. In addition, low to moderate intensity ultrasound treatments, such as low intensity pulsed ultrasound (LIPUS) for orthopedic applications, or brain stimulation have recently gained momentum, and cavitation has often been suggested as one of the mechanisms of action; however, the existing methods of cavitation detection are not sensitive enough to prove this claim [4].
Passive cavitation detection (PCD) is considered to be the most reliable, cost-effective and sensitive means of real-time cavitation detection methods [5]. In that method, broadband emissions resulting from bubble collapses are detected by a single-element focused hydrophone, aligned confocally with the HIFU transducer. The amplitude of detected broadband noise was shown to correlate with the observed bioeffects at the cellular level [6]–[8]. Unfortunately, this technique does not monitor the spatial distribution of bubbles with respect to the tissue being treated.
Recently, a passive method to map broadband cavitation emissions with multi-element ultrasound arrays has been proposed [9], [10]. The method has been shown to detect the occurrence of thermal lesion in ex vivo bovine tissue [11]. However, the image reconstruction technique requires a large aperture transducer to achieve reasonable image quality that is not always acceptable in clinical applications.
One of the earlier active cavitation detection methods is B-mode imaging that utilizes the fact that cavitation bubbles are highly reflective and may appear as a hyperechoic region on the image [12]–[14]. This method has subsequently been shown to only be sensitive to large bubbles or bubble clouds that are reflective enough to be distinguishable from the tissue speckle pattern on the B-mode image [13]–[15].
Different Doppler ultrasound methods have been used to image blood vessels [16], [17], and ultrasound contrast agents (UCAs) in diagnostic applications for a long time [18], [19]. Recently, color Doppler, a method normally used to image moving scatterers in tissue, such as red blood cells, was also found to be sensitive to bubbles trapped in the cracks and crevices of solid concretions in soft tissues (e.g. kidney stones, calcifications or edges of medical instruments) [20]. Crevice bubbles have been shown to give rise to the so-called twinkling artifact (TA) - a dynamic color mosaic on the image of a hard concretion in the color Doppler ultrasound display [21]. Experimental evidence suggests that irregular scattering of Doppler ensemble pulses from the submicron-size fluctuating crevice microbubbles leads to the random amplitude and phase changes in received signals, which in turn causes the random color display. Based on this evidence, we hypothesized that color Doppler imaging may be a sensitive means to detect small-size transient bubbles induced by pHIFU.
Pulse inversion Doppler is a widespread method to image nonlinear scattering objects such as UCAs using a conventional color Doppler sequence modified by inverting every other transmit pulse [22]. Harmonic Doppler processing is then performed on the received echoes, so that only signals from moving nonlinear scatterers remain. The method provides superior contrast and sensitivity compared to other UCA imaging techniques, and may therefore be useful for detecting and characterizing pHIFU-induced bubbles.
Another Doppler-based approach to detection of UCAs is based on correlating Doppler ensemble pulses transmitted before and after destruction of the UCAs by a longer, higher amplitude ultrasound pulse [23], [24]. The change in echo signal associated with disruption of the UCAs and the release of free gas bubbles is construed as motion in color Doppler imaging and, similar to TA, is displayed as bright color mosaic. Since the distributions of cavitation bubbles induced by each pulse of pHIFU treatment are likely to be different, this decorrelation Doppler approach was hypothesized to be very sensitive to the presence of pHIFU-induced bubbles.
Although the Doppler imaging methods described above provide high sensitivity and spatial resolution in imaging UCAs, they may not be immediately applicable to mapping pHIFU-induced bubbles. Unlike UCAs, the size of these bubbles is not known in advance, and the bubbles are transient, i.e., disappear very quickly after HIFU has been turned off. Imaging bubbles during the HIFU pulse, however, is not always possible due to the strong HIFU backscatter which may saturate the imaging probe electronics. The goal of this study was to evaluate the feasibility of bubble imaging using Doppler ensembles transmitted between HIFU pulses. The experiments were performed in transparent polyacrylamide (PA) gel phantoms to enable visual observation of pHIFU-induced cavitation activity. The three Doppler methods – color Doppler, pulse inversion Doppler, and decorrelation Doppler - were assessed separately and their sensitivities were compared to that of PCD.
II. Materials and Methods
A. Experimental Setup
The experimental setup used in this study is shown in Fig. 1. The pHIFU exposures were performed in an acrylic water tank filled with purified water degassed to 20-24% oxygen saturation, as measured by a dissolved oxygen meter (WTW Oxi 330i, Weilheim, Germany). All pHIFU exposures were performed with a 1.27-MHz spherically focused transducer (Sonic Concepts, Bothell, WA) with 64 mm aperture and 64 mm radius of curvature, and a central circular opening of 22 mm in diameter. The HIFU transducer was powered by a computer-controlled combination of an RF amplifier (ENI 400B; ENI, Rochester, NY) and a function generator (AFG 3022B; Tektronix, Beaverton, Oregon). Before the experiments, focal pressure waveforms produced by the transducer in water at different power levels were measured by a fiber optic probe hydrophone (FOPH 2000; RP Acoustics, Leutenbach, Germany). To vary the amounts of induced cavitation activity and to determine cavitation thresholds, the focal peak negative HIFU pressure was varied within the range of 0.9 – 11 MPa, with a step of 0.5 MPa. A focused 5 MHz PCD transducer with 19 mm diameter and 49.5 mm focal length (Olympus NDT, Inc, Waltham, MA) was fitted into the circular opening of the HIFU transducer and aligned confocally with the HIFU transducer (Fig. 1). The dimensions of the focal areas for HIFU and PCD were 12 mm × 1.6 mm and 55 mm × 2 mm at −6dB level, respectively.
Fig. 1.

Schematic of the experimental setup. All pulsed HIFU exposures of the transparent polyacrylamide gel phantoms were performed in a large water tank with a 1.27 MHz transducer. Cavitation activity in the sample was monitored by three separate techniques simultaneously: passive cavitation detection (PCD) using a single element focused transducer, aligned confocally and coaxially with the HIFU transducer; active cavitation detection using the linear ultrasound imaging probe ATL L7-4 connected to a Verasonics imaging system; and visual observation of bubble activity using a high-speed camera. Acoustic absorbers were positioned behind the sample to avoid reverberations inside the tank.
For ultrasound imaging of the HIFU exposures, the Verasonics Ultrasound Engine (VUE, Verasonics, Redmond, WA) was used, with a clinical linear imaging probe ATL/Philips HDI L7-4 (Bothell, WA) consisting of 128 elements. The probe was aligned perpendicular to the HIFU transducer axis (Fig. 1). On the opposite side of the clinical probe, a Photron APX-RS high-speed camera (monochrome, Photron, San Diego, CA) was placed to visually observe and record bubble activity at the HIFU focus. The high-speed camera was set to a frame rate of 30 000 frames/s and a resolution of 256x512 pixels.
B. Gel Phantoms
To optically monitor bubble activity, all studies were performed in transparent PA (7% w/v) phantoms [25]–[27]. The gel was combined with 7% w/v bovine serum albumin (BSA) to serve as an indicator for thermal denaturation. To prepare the samples, a liquid mixture of PA gel constituents was degassed for 1 hour in a desiccant chamber by a vacuum pump (VTE8, Thomas, Sheboygan, WI). The degassed mixture was poured into a custom mold (5 cm wide by 5 cm tall by 8 cm deep). Polymerization was then initiated by the addition of a 10 % (w/v) ammonium persulfate solution (APS, Sigma) and N,N,N’,N’-tetra-methylethylene/diamine (TEMED, Sigma). After the PA gel phantom was set, it was placed into a custom designed holder. It had four side openings to provide both acoustic and optical windows for observation. The acoustic absorber was attached to the wall of the water tank opposite the HIFU transducer to reduce reverberation. The gel phantom was positioned so that the HIFU focus was 15 mm deep below the gel proximal surface.
C. PCD Signal Processing
During HIFU exposures, a series of 1 ms duration broadband signals were acquired by the PCD transducer and processed using a custom-made digital filter using MATLAB (MATLAB 2010b, The MathWorks, Natick, MA, USA) as described in our previous study [28]. Since the majority of focal HIFU waveforms used in this study were nonlinearly distorted (Fig. 2a), the backscattered harmonics of the HIFU wave dominated the band-pass filtered PCD signal. Fig. 2b shows an example of the frequency spectrum of the signal recorded by the PCD. A combination of a band-pass filter (Matlab function fir1) and a notch-shaped comb filter (Matlab function iirnotch) was used to separate frequency components associated with broadband noise emissions from inertially collapsing bubbles (Fig. 2c).
Fig. 2.
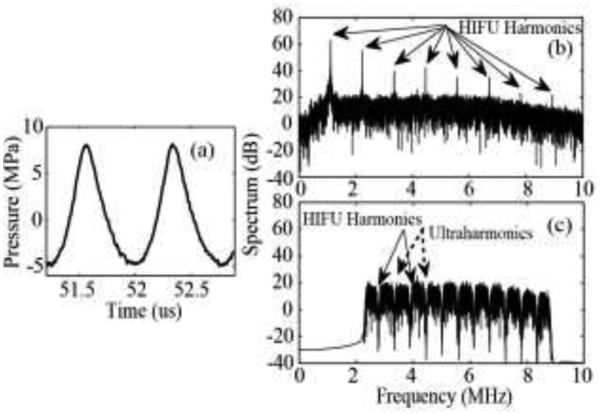
(a) An example of a nonlinearly distorted HIFU waveform. Frequency spectrum of a signal detected by the PCD transducer in polyacrylamide gel phantom before (b) and after (c) filtering. A combination of a band-pass filter (2.3 - 8.8MHz) and a notch shaped comb filter with a notch bandwidth of 100 kHz was applied to PCD signals in the frequency domain to suppress backscattered harmonics of the HIFU pulse and the ultraharmonics generated by stably oscillating bubbles.
The filtered PCD signal was further analyzed in the time domain to obtain a binary evaluation metric of whether a cavitation event took place within the HIFU pulse duration. The cavitation event was considered observed if the signal amplitude exceeded the maximum amplitude of the background noise by a factor of – the Rose criterion, which ensures the signal is distinguishable from a simple statistical variation of the background noise with a 98% confidence level [29]. This binary measure was obtained for pHIFU exposures at each of the peak negative pressure levels.
At each level, 20 different spots in the gel phantom were treated. We then calculated cavitation probability at each level as the ratio (expressed in percent) of the number of pHIFU focus locations, at which at least one cavitation event was observed throughout the exposure, to the total number of spots treated. Similar to our previous work, the cavitation threshold [28] was defined as the peak negative pressure level corresponding to a 50% probability of cavitation.
D. Ultrasound Imaging
Imaging was performed in a “flash” transmitting mode in which all array elements were excited simultaneously to emit a quasi-plane wave in the direction orthogonal to the radiating surface, i.e., a zero degree incident angle. Color Doppler imaging was followed by B-mode imaging. In Doppler mode, the central 64 elements were excited by a series of 14 Doppler ensemble pulses (the default number of pulses for VUE) emitted with a pulse repetition frequency (PRF) and an applied voltage level of 35 V set through VUE flash mode color Doppler programmable script [30]. The peak-rarefactional pressure P− of the imaging probe at the distance of HIFU focus was measured by a lipstick hydrophone (HGL-0085, ONDA Corporation, Sunnyvale, CA) to be P− = 1.7 MPa. The event sequence of the VUE script was modified so that Doppler pulses were transmitted following HIFU pulses. Each Doppler pulse was a 3-cycle tone burst with 5 MHz central frequency. In B mode, all 128 elements were excited by a single-cycle 5 MHz pulse. Received signals in both Doppler and B-mode regimes were sampled at 20 MHz with a 12-bit analog-to-digital convertor (ADC) and saved in the receive buffer of VUE. Saved radio-frequency (RF) signals were later used for Doppler processing and image reconstruction. The average image processing and reconstruction time was 24 ms.
It was important to note that, of the 14 Doppler ensemble pulses, the first two pulses were omitted to avoid possible unrepeatable tissue reverberation. The later 12 pulses were used in further Doppler processing and image reconstruction. Therefore, further in the text the third transmitted Doppler pulse would be referred to as the first Doppler pulse.
Three different pulse sequences were used here to synchronize HIFU pulses with the Doppler ensemble, as illustrated in Fig. 3. The first was referred to as color Doppler sequence (Fig. 3a). A series of twenty 1-ms HIFU pulses were delivered at a PRF of 1 Hz to a single treatment location. This HIFU pulsing scheme was chosen to match our previous work on the cavitation threshold in tissues and phantoms and chemotherapeutic drug delivery to pancreatic tumors [28].
Fig. 3.
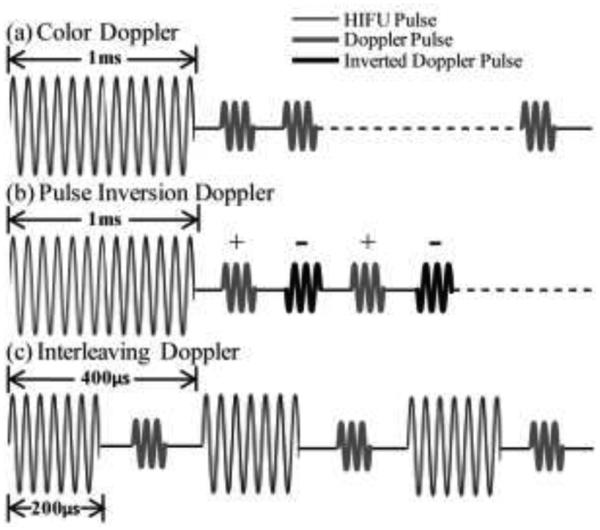
Pulse sequences of the different modes of the active cavitation technique employed here - “bubble Doppler”. In all cases, Doppler ensemble pulses were transmitted in a flash mode, in which all array elements were excited simultaneously to emit a quasi-plane wave. (a) Color Doppler: one 1-ms HIFU pulse (thin line) was followed by fourteen 3-cycle Doppler pulses (thick grey line). (b) Pulse inversion Doppler: one 1-ms HIFU pulse was followed by fourteen Doppler pulses, and every other pulse was inverted (thick and black lines). (c) Interleaving Doppler: each of the fourteen 200-µs HIFU pulses were followed by a single Doppler pulse. The HIFU-Doppler pulse pair was repeated with a period of 400 µ s.
After each HIFU pulse, a series of 14 Doppler ensemble pulses were transmitted and received by the imaging probe in flash mode with a PRF of 3 kHz. This PRF was chosen because it should properly sample the range of expected velocities and was typical for the Doppler regimes in clinical ultrasound machines. Each Doppler ensemble was transmitted with a 700 µs delay after the corresponding HIFU pulse to avoid interference between HIFU pulse reverberations in the tank and Doppler pulses. Received Doppler ensemble pulses were then stored for off-line processing and also used in real time to form a color Doppler image.
Immediately after transmitting and receiving Doppler pulses, a 1-cycle 5 MHz pulse was transmitted in flash mode and received by the imaging probe to form a B-mode image, which was then combined with the color Doppler image. After 20 sets of pulses (consisting of one HIFU pulse, 14 Doppler pulses and one B mode pulse) were transmitted, the focus was moved to a different location in the phantom.
The second pulse sequence - pulse inversion Doppler – was identical to color Doppler, with one modification: every other pulse in the Doppler ensemble following the HIFU pulse was inverted, as shown in Fig. 3b. This sequence can separate those components of the Doppler signal arising from nonlinear scattering, in particular – the second harmonic of the transmit signal [22]. Since the frequency band of the imaging probe was 4 – 7 MHz, the transmit frequency was set to 3 MHz so that the second harmonic (6 MHz) would be within the frequency band of the transducer.
The third pulse sequence was referred to as “interleaving Doppler” and is illustrated in Fig. 3c. Twenty sets of pulses, each consisting of 14 HIFU pulses interleaved with 14 Doppler ensemble pulses, were delivered to a single treatment spot at a PRF of 1 Hz. Each HIFU pulse was reduced in duration to 200 µs compared to the first two pulse sequences to keep the Doppler pulse PRF nearly the same - 2.5 kHz. Each Doppler pulse was transmitted with a 150 µs delay after the corresponding HIFU pulse to avoid interference. Similar to color Doppler and interleaving Doppler sequences, one Doppler image was reconstructed from the later 12 Doppler pulses. Immediately after each set of interleaved HIFU and Doppler pulses were delivered, a single 1-cycle 5 MHz signal was transmitted and received to form a B-mode image.
E. Signal Processing
All RF signals were analyzed in Matlab (MATLAB 2010b, The MathWorks, Natick, MA, USA) to reconstruct Doppler images according to the algorithm illustrated in Fig. 4. Consider a Doppler ensemble consisting of N = 12 pulses. The time from one transducer firing to the next was defined as “slow time”, and was denoted as the number of the pulse within the Doppler ensemble, i. The time elapsed during reception of each pulse was defined as “fast time”, t, and was determined by the round-trip time of flight of a Doppler pulse and measured in millimeters: l = ct/2, where c is the speed of sound. Received RF signals were first beamformed using conventional “delay-and-sum” processing. Then the signal was transformed to obtain the in-phase and quadrature (I/Q) components. In this study, Hilbert transform was used to perform I/Q processing. The received beamformed signal can be then represented as a complex (analytic) discrete signal Z(n), the real and imaginary parts of which are the I and Q components.
Fig. 4.

Flow diagram of Doppler signal processing employed in this study. Each of the twelve received pulses of the Doppler ensemble were first beamformed and then Hilbert transformed to obtain in-phase and quadrature components (IQ). They were then wall filtered along slow time to remove slow motions. For the color Doppler case, wall filtering is performed with a linear regression filter. For the pulse inversion case, wall filtering is performed with an additional low pass filtering at a cutoff frequency of PRF/4 so that only the signal associated with nonlinear scattering processes is retained. After wall filtering, the autocorrelation function of the complex signal along slow time at a lag of one Doppler pulse, R(1), was computed at each depth, i.e., for each fast time sample. If the amplitude of the autocorrelation function, |R(1)|, was lower than a threshold of 6 dB above the background noise level, the B-mode image was displayed in corresponding pixels. If |R(1)| was higher than the threshold, the corresponding pixels displayed color, which was determined by the phase of R(1). Arg{R(1)} corresponds to the derivative of the autocorrelation phase along slow time and can be converted to the velocity of moving scatterers.
Next, wall filtering (first order regression filter) was applied to the complex, beamformed signals along slow time to remove signals from stationary or slowly moving scatterers and separate only Doppler residuals [31]. For pulse inversion Doppler, an additional low pass filter along slow time was applied to remove signals associated with linear scatterers [22]. The cut-off frequency of the filter was PRF/4 (Matlab function sgolayfilt).
After wall filtering, we used the most common method for velocity and Doppler power estimation in modern systems, the autocorrelation algorithm [32].
Let R (k) be the Doppler autocorrelation function along slow time at a lag of k pulse repetition periods:
where N is the total number of Doppler pulses along slow time and i is the pulse number in the Doppler ensemble. According to Kasai et al. [32], the mean Doppler frequency shift can be calculated as the phase of the autocorrelation function at a lag of one Doppler pulse repetition period, arg{R(1)}:
Doppler power can be calculated as |R(1)|. The mean velocity can be also derived from as follows:
where ω0 is the angular frequency of the carrier signal, θ is the angle between the sound beam and the direction of the flow. Thus, both Doppler frequency shift and Doppler power at each fast time sampling point were calculated using this approach. At the final step, the Doppler power at each pixel of the image was compared to a threshold, and if it exceeded the threshold, color Doppler information, i.e., the phase of R(1), was displayed on top of B-mode pixels. The threshold and color priority was defined the same way as in Lu et al.[20]: the background noise level, defined as the average of the Doppler powers over all pixels in the image, multiplied by a factor of two. The color encoding priority was set to the highest level so that color pixels are plotted prioritized than grey scale pixels.
III. Results
A. Pilot observations with high-speed camera and color Doppler ultrasound imaging
In the first series of experiments, simultaneous observation of pHIFU-induced bubble activity in the gel phantom was performed by high-speed camera and Doppler ultrasound using two different pulse sequences – color Doppler and interleaving Doppler. The pHIFU focal peak negative pressure in this case was 5.1 MPa. The VUE ultrasound system was used to display color Doppler images in real time, without any further signal processing. The obtained color Doppler images of the HIFU transducer focal area are presented side-by-side with the corresponding high-speed camera images in Fig. 5 for both pulse sequences. Cavitation bubbles distributed throughout the transducer’s oval-shaped focal area were clearly visible in both high-speed camera images as dark spots (Figs. 5a,c). The bubbles were somewhat smaller in the interleaving Doppler pulse sequence (Fig. 5c) due to the smaller duration of the HIFU pulse in this case. Across the whole exposure, no thermal denaturation was observed in the gel phantoms. The size and position of the colored region in Doppler ultrasound corresponded well to the size and position of the bubble distribution seen on the high-speed camera images, providing one confirmation that the color region originates from cavitation bubbles. In both cases, the color region grew in size with increasing HIFU focal peak negative pressure, and disappeared as the peak negative pressure fell below a certain threshold (3.1 MPa for color Doppler and 1.9 MPa for interleaving Doppler).
Fig. 5.
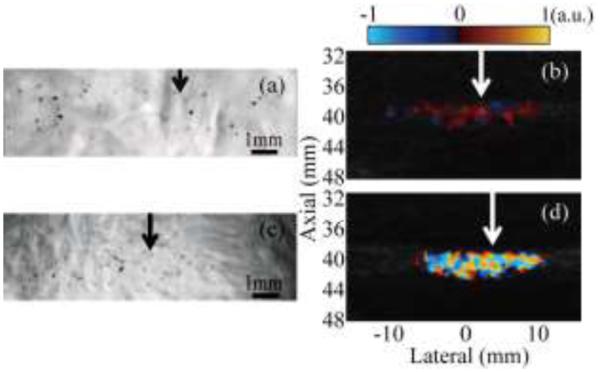
Simultaneous observation of HIFU-induced cavitation bubble activity performed with the high-speed camera and Doppler ultrasound for two pulse sequences: color Doppler ((a) and (b)) and interleaving Doppler ((c) and (d)). The HIFU transducer (focal region size 16 mm × 1.5 mm at the −6 dB level) is located to the left of all images; arrows indicate the lateral position of the focus. Cavitation bubbles were readily observed in both high-speed camera images, (a) and (c), as small black dots scattered throughout the focal region. The sizes and positions of these bubble distributions corresponded to the regions of alternating dark red and blue color in color Doppler regime (b), and to the bright color mosaic in the interleaving Doppler regime (d).
Doppler images for the two pulse sequences looked qualitatively different. In the color Doppler sequence, regions displaying color contained alternating dark red and blue areas that, in Doppler processing, would be interpreted as very slowly, chaotically moving scatterers (Fig. 5b). In interleaving Doppler, the color region contained a color mosaic characteristic of the TA typically seen on hard concretions in tissue (Fig. 5d), and would be interpreted as scatterers having the entire range of speeds and moving in all directions at once. These qualitative characteristics were the same across the whole range of pHIFU focal pressures.
B. Interpretation of pilot results
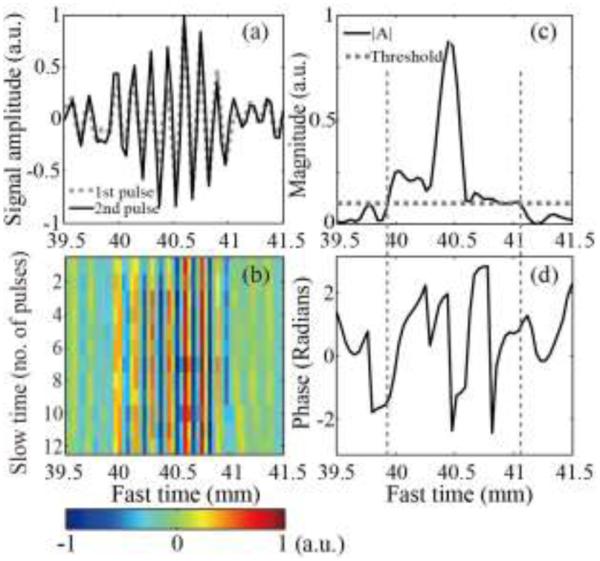
To explain the origin of the different color displays in color Doppler and interleaving Doppler, non-beamformed RF signals from the middle element of the ultrasound array were considered. Fig. 6a presents the first two waveforms from the ensemble of Doppler pulses from the depth corresponding to the HIFU focus. As seen, the amplitude of the first pulse was larger than that of the second pulse, but there was no visible phase shift between pulses. Fig. 6b shows the received signal amplitude plotted along slow time and fast time for the entire Doppler ensemble. At all of the fast time sampling points, the signal amplitude gradually declined across slow time, suggesting the presence of a scatterer with decreasing reflectance. The amplitude (Fig. 6c) of the autocorrelation function at lag one peaked in fast time at the point with the fastest decrease in signal amplitude over slow time (40.2 mm). The fast time range in which the amplitude of the autocorrelation exceeded the threshold for color display (39.4 – 41 mm) corresponded to the autocorrelation phase (Fig. 6d) that fluctuated around zero, within a narrow range of −0.3 − 0.3 radians.
Fig. 6.
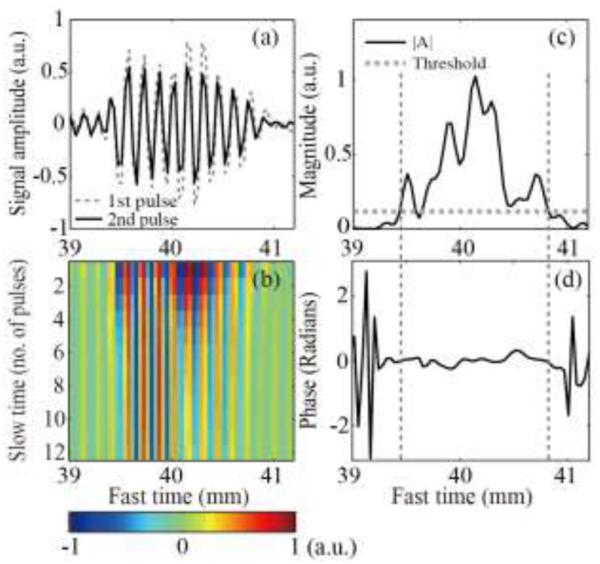
(a) Examples of the first two RF signals of the color Doppler ensemble received by the middle element of the imaging array, from the depth corresponding to the HIFU focus. The second pulse (solid line) had lower amplitude than the first (dashed line), but no phase shift. (b) All 12 received RF signals from the Doppler ensemble plotted along fast time (distance from the array element) and slow time (pulse number). The amplitude of the signals declined gradually across slow time, but the waveform remained unchanged and was not shifted in time. This suggested the presence of a stationary scatterer with declining reflectance, e.g. a shrinking bubble. (c) The magnitude and (d) the phase of the autocorrelation function at lag 1, calculated using the entire Doppler ensemble and plotted along fast time. The phase change was close to zero over the fast time segment (vertical dashed lines) in which the autocorrelation function amplitude exceeded the threshold (horizontal dashed line). Therefore, in the ultrasound image this region was displayed in color, corresponding to a very slowly moving scatterer (dark blue and red).
These observations suggested the following mechanism for the appearance of the dark red and blue area in the color Doppler image: pHIFU induced cavitation bubbles that gradually dissolved after the HIFU pulse was delivered. The amplitude of backscattered Doppler pulses was strongly affected by the change in the bubble size, and therefore the amplitude of the autocorrelation at lag 1 was high, and the bubble was displayed as color. However, the signal phase did not change from one Doppler pulse to the next, because bubbles were not moving, and the displayed speed was close to zero, as shown by the dark red and dark blue regions in the reconstructed color image (Fig. 5b).
For the interleaving Doppler pulse sequence, the overall levels of the first two signals of the Doppler ensemble were similar (Fig. 7a); however, noticeable phase shifts and amplitude fluctuations were present. As seen in Fig.7b, these fluctuations continued across slow time, suggesting that the backscattered signal from pHIFU-generated bubbles changed sporadically from one Doppler pulse to the next. Figs. 7c and 7d show that the fast time segment, at which the autocorrelation amplitude was above the threshold (39.8 - 41.2 mm), corresponds to phase fluctuations over a wide range (−π – π). This suggested that the distribution of bubbles resulting from each HIFU pulse differed in bubble size, number, and positions. These changes induced by different HIFU pulses resulted in large autocorrelation amplitude and random phase changes which manifested themselves as the color mosaic in the color Doppler image. In the control experiments, in which HIFU was not turned on, the received Doppler signals contained no subharmonic or superharmonic components in their spectrum. Therefore, the phase fluctuation could not have been associated with the nonlinear propagation effects in the gel phantom
Fig. 7.
(a) Examples of the first two RF signals of the interleaving Doppler ensemble received by the middle element of the imaging array, from the depth corresponding to the HIFU focus. The overall level of the first pulse (dashed line) was similar to that of the second pulse (solid line), but there were substantial differences between the two signals: noticeable temporal shift and relative fluctuations. (b) All 12 received RF signals from the Doppler ensemble plotted along fast time (distance from the array element) and slow time (pulse number). The signal amplitude changed sporadically across slow time. (c) The amplitude and (d) phase of the autocorrelation function at lag 1, calculated using the entire Doppler ensemble and plotted along fast time. The range of autocorrelation magnitude (vertical dashed lines) which was higher than the threshold (horizontal dashed line) corresponded to a randomly changing phase over a wide range, which produced the color mosaic in the Doppler image.
In pulse inversion Doppler, the sum of inverted and non-inverted subsequent Doppler pulses only contained the second harmonic of the transmitted signal, i.e., the signal associated with nonlinear scatterers. An example of the first two received RF signals from a pulse inversion Doppler ensemble is shown in Fig. 8a. The spectrum of both signals (Fig. 8b) contained harmonics of the center transmit frequency of 3 MHz. When the pulses were summed (Fig. 8c), only the second harmonic signal at 6MHz was left in the spectrum (Fig. 8d). This suggested that residual bubbles induced by the HIFU pulse produced a strong enough nonlinear response to be detectable by pulse inversion Doppler. In this particular example, the peak negative focal pressure of the HIFU pulse was 4.6 MPa.
Fig. 8.
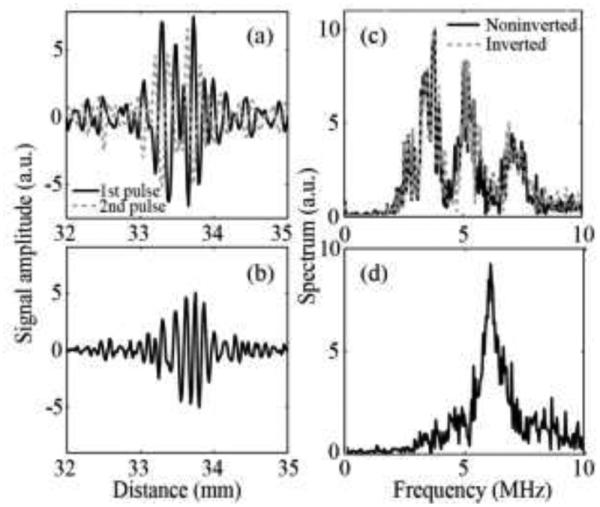
(a) An example of two consecutive RF signals from the pulse inversion Doppler ensemble received by the middle element of the array. The carrier frequency of the imaging pulses was set to 3 MHz. (b) The signal resulting from summation of the two received signals is shown in (a). (c) The frequency spectrum corresponding to the received signals and (d) summed signal in the range of 0-10MHz. After the signals were summed, only the second harmonic at 6 MHz was left in the spectrum.
The fast time range in which the amplitude of autocorrelation function (Fig. 9a) exceeded the threshold for color display (33 - 33.8 mm) had an autocorrelation phase (Fig. 9b) that fluctuated around zero, suggesting that bubbles did not move from one pulse to the next but did produce a nonlinear response.
Fig. 9.
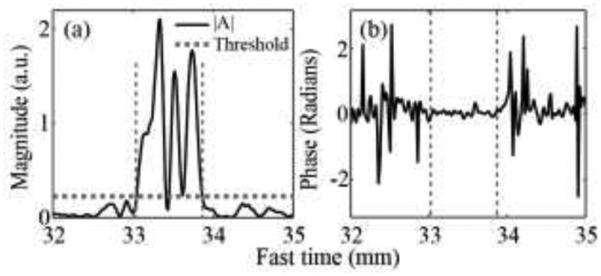
(a) The amplitude and (b) phase of autocorrelation function at lag 1 calculated using the entire pulse inversion Doppler ensemble, plotted along fast time. Similar to the color Doppler case, the phase was close to zero at the fast time segment (vertical dashed lines) that corresponded to the autocorrelation amplitude exceeding threshold (horizontal dashed line).
C. Investigation of the Doppler Techniques Sensitivity
Pilot experiments with all three pulse sequences indicated that in all cases the increased magnitude of the Doppler signal originated from changes in the pHIFU-induced bubble distribution across slow time, or from the nonlinearity of the bubbles. However, the Doppler signal phase did not correspond to true motion of the bubbles or reflect any of the bubble characteristics. Therefore, phase information was discarded in the future studies, and instead Doppler signal magnitude was displayed on top of the B-mode images, i.e., power Doppler regime, rather than color Doppler, was implemented. The corresponding images, reconstructed offline, for all three pulse sequences at two different pHIFU power levels are shown in Fig. 10.
Fig. 10.
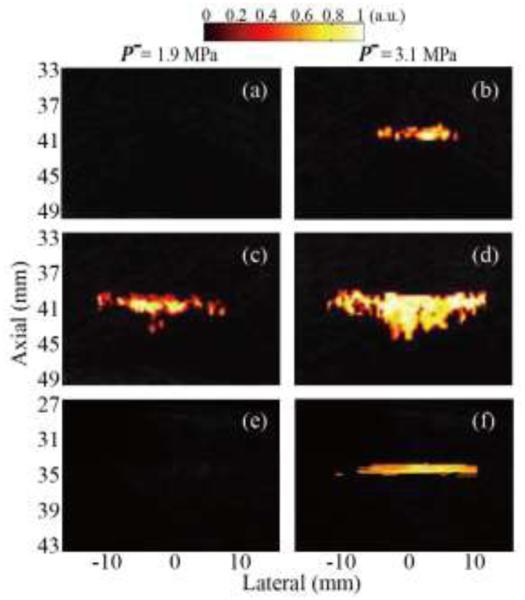
Reconstructed maps of normalized Doppler power representing cavitation activity induced by pHIFU with peak rarefactional focal pressure of 1.9 MPa (left column) and 3.1 MPa (right column) using the following pulse sequences: (a), (b) color Doppler, (c), (d) interleaving Doppler, and (e), (f) pulse inversion Doppler. The interleaving Doppler sequence appeared to be the most sensitive to the onset of cavitation, and the color region was displayed when HIFU focal peak rarefactional pressure exceeded 1.9 MPa. Both color Doppler and pulse inversion Doppler sequences had the same sensitivity to cavitation and color was displayed only at 3.1 MPa pressure.
Based on the pilot experimental results, the three Doppler techniques reflected different characteristics of the residual bubble distribution: bubble size and rate of dissolution (color Doppler), the degree of change in bubble distribution from one HIFU pulse to the next (interleaving Doppler) and the magnitude of the bubble nonlinear response (pulse inversion Doppler). Therefore, the sensitivities of the three techniques were likely to be different and were measured, similarly to PCD, in terms of the threshold for 50% probability of observation of a cavitation event (see Section II B). A cavitation event was considered observed if color was displayed on top of the B-mode image.
In the color Doppler sequence, color images were not displayed until HIFU focal peak negative pressure reached 3.1 MPa (Figs. 10a and 10b). The interleaving Doppler sequence appeared to have the lowest threshold of all techniques - 1.9 MPa (Figs. 10c and 10d), and the displayed distribution was larger in size than in the other sequences at the same HIFU power level. The threshold in the pulse inversion Doppler sequence was similar to that in the color Doppler sequence: 3.1 MPa (Figs. 10e and 10f).
The sensitivities of all Doppler techniques were compared to those of PCD and high-speed photography, as summarized in Table 1. The comparison was performed separately for interleaving Doppler to account for the smaller HIFU pulse duration used in this technique. The accuracy of the thresholds was mostly determined by the step size in changing peak negative focal HIFU pressure – 0.5 MPa. As seen, all of the Doppler techniques appeared substantially more sensitive than other methods.
TABLE 1.
Sensitivity Thresholds For Cavitation Detection Techniques
| Techniques | |||||||
|---|---|---|---|---|---|---|---|
| Single 1-ms HIFU pulse | Twelve 200-us HIFU pulses | ||||||
| PCD |
High Speed
photography |
Color
Doppler |
Pulse Inversion
Doppler |
PCD |
High Speed
photography |
Interleaving
Doppler |
|
| pHIFU peak-rarefractional pressure at 50% probability of cavitation event (MPa) |
4.6 | 5.1 | 3.1 | 3.1 | 5.1 | 5.6 | 1.9 |
IV. Discussion
In this work, we investigated the feasibility and sensitivity of three different Doppler techniques in detection of pHIFU induced cavitation bubbles: color Doppler, pulse inversion Doppler and interleaving Doppler. These techniques were found to be not only more sensitive than conventional PCD or high-speed photography, but also complementary to each other, i.e., providing different information about the bubble distribution.
For interleaving Doppler, the Doppler signal fluctuated over slow time (i.e., from one HIFU pulse to the next) because each HIFU pulse produced a different bubble distribution. It could therefore be interpreted as sensitive to the mere presence of bubbles, not necessarily bubble activity, and was found to be the most sensitive among the considered techniques. In concept, interleaving Doppler is similar to Doppler decorrelation algorithms [23], [33], which measure the decorrelation of backscattered signals from UCAs before and after they are disrupted by a more intense pulse. The difference in our case was that the intense pulse was the bubble-producing HIFU pulse, and more than two Doppler pulses were used.
The Doppler signal in the color Doppler mode originated from the change in the size of the bubbles as they dissolved rapidly after HIFU was turned off. The signal was therefore representative primarily of bubble size, but also of the elastic properties of the medium around the bubble, because it would influence dissolution speed. Pulse inversion Doppler was found to have similar sensitivity to color Doppler, and was an indicator of the strength of the bubble’s nonlinear response to Doppler ensemble pulses. This response was, in turn, dictated by bubble size and medium properties. However, pulse inversion Doppler has an important advantage over color Doppler for in vivo implementation – it is only sensitive to nonlinear scatterers, and is not cluttered by the linear signal component reflecting body motion or blood circulation.
In all the pulsing sequences used in this work, 12 Doppler pulses per ensemble were used, primarily because this is the default number for many clinical ultrasound machines. However, this number may potentially be reduced to increase imaging speed, depending on the bubble dissolution time (for color Doppler and pulse inversion Doppler) and the degree of change in bubble distribution between HIFU pulses. To determine the optimal number of pulses in the Doppler ensemble, the amplitude of the autocorrelation function between two consecutive RF pulses was plotted along slow time and compared between different pulse sequences (Fig. 11). As seen, the autocorrelation amplitude dropped very rapidly in the color Doppler case and hardly changed after the 6th pulse of the ensemble. Therefore, the number of pulses can be reduced in this case without loss of signal strength. For interleaving Doppler, the autocorrelation amplitude changes randomly across pulse pairs; therefore, the more pulses delivered, the stronger the Doppler signal. The number of pulses in the ensemble can thus be adjusted based on the needs in a particular situation.
Fig. 11.
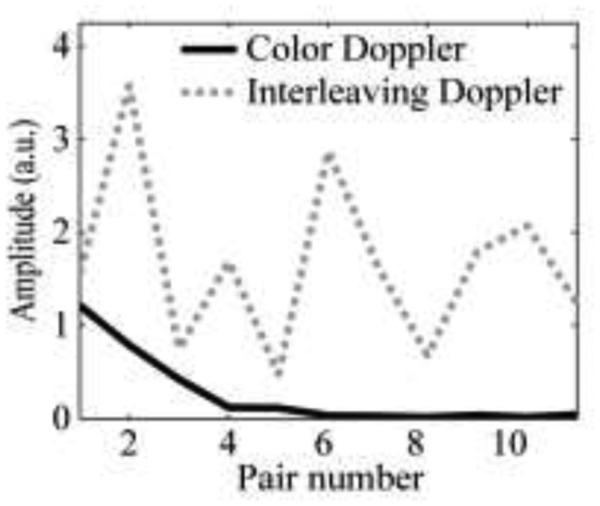
The amplitude of autocorrelation function at lag 1 calculated using a consecutive pair of Doppler pulses along slow time. The amplitude declines gradually with increasing pair number for color Doppler (solid line), but not for interleaving Doppler (dashed line).
In this work, all Doppler methods were implemented in flash mode, because cavitation bubbles are very transient, and transmitting multiple beams or waves at multiple angles would not be rapid enough to capture these bubbles. Flash mode is known to provide relatively poor spatial resolution in the transverse direction [34], [35] that was not critical in this pilot study, but would certainly be unacceptable in a clinical setting. However, since the number of pulses in a Doppler ensemble can be substantially reduced, it is potentially feasible to utilize multiple transmit beams or incident angles within the same imaging time, and enhance image resolution through coherent spatial compounding.
As interleaving Doppler and pulse inversion Doppler provided complementary information about cavitation bubbles, they can be combined into a single method using more complex pulse sequences with multiple HIFU pulses, followed by multiple Doppler ensemble pulses with interchanging polarities. This method, that we term “bubble Doppler” quantifies the bubble nonlinearity and map bubble presence at the same time. It should be able to provide superior sensitivity compared to PCD methods. It would also be readily translatable for clinical use, because it uses a commercially available imaging probe, which can be incorporated into a HIFU system.
The future work will apply the method of bubble Doppler for cavitation mapping in ex vivo tissues and in vivo animal models, such as mouse pancreatic tumor, during pHIFU exposures. We expect that bubble Doppler images could be displayed when HIFU reaches a similar peak-rarefactional level in in vivo pancreas as in PA gel phantoms, due to their similar cavitation thresholds characterized by PCD [28]. Comparing to the gel phantoms, there will be higher inhomogeneity in nuclei distribution in vivo, some regions of the tissues are likely to show a much brighter color region than other regions. In terms of the bubble dynamics, cavitation may occur sporadically over the course of HIFU exposure because cavitation nuclei are replenished and carried away by circulation at the HIFU focal region. Therefore, the bubble Doppler images will be interleaved with B-mode images stochastically during the delivery HIFU pulses.
V. Conclusions
In this manuscript, the methods for pHIFU-induced microbubble detection were studied. Color Doppler imaging showed the decrease in bubble size after the HIFU pulse. Pulse inversion could capture the nonlinearity of the bubbles. Interleaving Doppler was most sensitive to the presence of bubbles among all techniques. The combination of these techniques is likely to be beneficial for imaging bubble location and characterizing bubble nonlinearity. In summary, a new ultrasound imaging protocol was proposed to detect microbubbles induced by pHIFU using a modification of Doppler pulse sequences. This imaging modality was shown to provide sensitivity superior to that of existing cavitation detection methods, and at the same time can spatially resolve bubble location, similarly to conventional Doppler imaging.
Acknowledgment
The authors would like to thank Dr. Francesco Curra for his support in using the Verasonics ultrasound engine. This work was supported by NIH grants 1R01CA154451, 1K01EB015745 and Washington State Life Sciences Discovery Fund.
References
- [1].Ibsen S, Benchimol M, Simberg D, Esener S. Ultrasound mediated localized drug delivery. Adv. Exp. Med. Biol. 2012 Jan;733:145–53. doi: 10.1007/978-94-007-2555-3_14. [DOI] [PubMed] [Google Scholar]
- [2].Nomikou N, McHale AP. Exploiting ultrasound-mediated effects in delivering targeted, site-specific cancer therapy. Cancer Lett. 2010 Oct;296(2):133–143. doi: 10.1016/j.canlet.2010.06.002. [DOI] [PubMed] [Google Scholar]
- [3].Frenkel V. Ultrasound mediated delivery of drugs and genes to solid tumors. Adv. Drug Deliv. Rev. 2008 Jun;60:1193–208. doi: 10.1016/j.addr.2008.03.007. [DOI] [PMC free article] [PubMed] [Google Scholar]
- [4].Krasovitski B, Frenkel V, Shoham S, Kimmel E. Intramembrane cavitation as a unifying mechanism for ultrasound-induced bioeffects. Proc. Natl. Acad. Sci. U. S. A. 2011;108(8):3258–3263. doi: 10.1073/pnas.1015771108. [DOI] [PMC free article] [PubMed] [Google Scholar]
- [5].Coussios CC, Roy R. a. Applications of Acoustics and Cavitation to Noninvasive Therapy and Drug Delivery. Annu. Rev. Fluid Mech. 2008 Jan;40:395–420. [Google Scholar]
- [6].Hwang JH, Tu J, Brayman AA, Matula TJ, Crum LA. Correlation between inertial cavitation dose and endothelial cell damage in vivo. Ultrasound Med. Biol. 2006 Oct;32:1611–1619. doi: 10.1016/j.ultrasmedbio.2006.07.016. [DOI] [PubMed] [Google Scholar]
- [7].Chen W-S, Matula TJ, Brayman AA, Crum LA. A comparison of the fragmentation thresholds and inertial cavitation doses of different ultrasound contrast agents. J. Acoust. Soc. Am. 2003;113:643–651. doi: 10.1121/1.1529667. [DOI] [PubMed] [Google Scholar]
- [8].Hallow DM, Mahajan AD, McCutchen TE, Prausnitz MR. Measurement and correlation of acoustic cavitation with cellular bioeffects. Ultrasound Med. Biol. 2006;32(7):1111–1122. doi: 10.1016/j.ultrasmedbio.2006.03.008. [DOI] [PubMed] [Google Scholar]
- [9].Coussios CC, Gyongy M, Ritchie R, Webb I, Nandlall S, Jackson E, Arvanitis C, Bazan-Peregrino M, Arora M. Passive mapping for real-time monitoring of ultrasound therapy. J. Acoust. Soc. Am. 2010;128(4):2416. [Google Scholar]
- [10].Gyöngy M, Coussios C-C. Passive cavitation mapping for localization and tracking of bubble dynamics. J. Acoust. Soc. Am. 2010;128(4):EL175–L180. doi: 10.1121/1.3467491. [DOI] [PubMed] [Google Scholar]
- [11].Jensen CR, Ritchie RW, Gyongy M, Collin JRT, Leslie T, Coussios C-C. Spatiotemporal monitoring of high-intensity focused ultrasound therapy with passive acoustic mapping. Radiology. 2012;262(1):252–261. doi: 10.1148/radiol.11110670. [DOI] [PubMed] [Google Scholar]
- [12].Vaezy S, Shi X, Martin RW, Chi E, Nelson PI, Bailey MR, Crum LA. Real-time visualization of high-intensity focused ultrasound treatment using ultrasound imaging. Ultrasound in Medicine & Biology. 2001;27(1):33–42. doi: 10.1016/s0301-5629(00)00279-9. [DOI] [PubMed] [Google Scholar]
- [13].Rabkin BA, Zderic V, Vaezy S. Hyperecho in ultrasound images of HIFU therapy: Involvement of cavitation. Ultrasound Med. Biol. 2005;31(7):947–956. doi: 10.1016/j.ultrasmedbio.2005.03.015. [DOI] [PubMed] [Google Scholar]
- [14].Rabkin BA, Zderic V, Crum LA, Vaezy S. Biological and physical mechanisms of HIFU-induced hyperecho in ultrasound images. Ultrasound Med. Biol. 2006;32(11):1721–1729. doi: 10.1016/j.ultrasmedbio.2006.04.010. [DOI] [PubMed] [Google Scholar]
- [15].R. G. H. and R. A. R. Constantin -C. Coussios. Farny Caleb H., Thomas Charles R., Cleveland Robin O. Cavitation detection during and following HIFU exposure in vitro. Acoust. Soc. Am. J. 2001;115(5):2448. [Google Scholar]
- [16].Crowe JR, Shapo BM, Stephens DN, Bleam D, Eberle MJ, Ignacio Cespedes E, Wu CC, Muller DM, Kovach JA, Lederman RJ, O’Donnell M. Blood speed imaging with an intraluminal array. IEEE Trans. Ultrason. Ferroelectr. Freq. Control. 2000;47(3):672–681. doi: 10.1109/58.842055. [DOI] [PubMed] [Google Scholar]
- [17].Crowe JR, O’Donnell M. Quantitative blood speed imaging with intravascular ultrasound. IEEE Trans. Ultrason. Ferroelectr. Freq. Control. 2001;48(2):477–487. doi: 10.1109/58.911730. [DOI] [PubMed] [Google Scholar]
- [18].Ernst H, Hahn EG, Balzer T, Schlief R, Heyder N. Color doppler ultrasound of liver lesions: signal enhancement after intravenous injection of the ultrasound contrast agent Levovist. J Clin Ultrasound. 1996;24(1):31–35. doi: 10.1002/(SICI)1097-0096(199601)24:1<31::AID-JCU5>3.0.CO;2-M. [DOI] [PubMed] [Google Scholar]
- [19].Boussuges A. Detection of right-to-left shunts by transcranial contrast Doppler ultrasound. Bull. Med sub hyp. 1999;(9(suppl)):61–66. [Google Scholar]
- [20].Lu W, Sapozhnikov OA, Bailey MR, Kaczkowski PJ, Crum LA. Evidence for Trapped Surface Bubbles as the Cause for the Twinkling Artifact in Ultrasound Imaging. Ultrasound Med. Biol. 2013;39(6):1026–1038. doi: 10.1016/j.ultrasmedbio.2013.01.011. [DOI] [PMC free article] [PubMed] [Google Scholar]
- [21].Aytaç SK, Ozcan H. Effect of color Doppler system on the twinkling sign associated with urinary tract calculi. J. Clin. Ultrasound. 1999;27(8):433–439. doi: 10.1002/(sici)1097-0096(199910)27:8<433::aid-jcu4>3.0.co;2-1. [DOI] [PubMed] [Google Scholar]
- [22].Simpson DH, Chin CT, Burns PN. Pulse inversion Doppler: a new method for detecting nonlinear echoes from microbubble contrast agents. IEEE Trans. Ultrason. Ferroelectr. Freq. Control. 1999;46(2):372–382. doi: 10.1109/58.753026. [DOI] [PubMed] [Google Scholar]
- [23].Frinking P. Multi-pulse ultrasound contrast imaging based on a decorrelation detection strategy. IEEE Ultrason. Symp. Proc. 1998;2:1787–1790. [Google Scholar]
- [24].Tiemann K, Pohl C, Schlosser T, Goenechea J, Bruce M, Veltmann C, Kuntz S, Bangard M, Becher H. Stimulated acoustic emission: Pseudo-Doppler shifts seen during the destruction of nonmoving microbubbles. Ultrasound Med. Biol. 2000;26(7):1161–1167. doi: 10.1016/s0301-5629(00)00261-1. [DOI] [PubMed] [Google Scholar]
- [25].Khokhlova VA, Bailey MR, Reed JA, Cunitz BW, Kaczkowski PJ, Crum LA. Effects of nonlinear propagation, cavitation, and boiling in lesion formation by high intensity focused ultrasound in a gel phantom. J. Acoust. Soc. Am. 2006;119:1834. doi: 10.1121/1.2161440. [DOI] [PubMed] [Google Scholar]
- [26].Lafon C, Zderic V, Noble ML, Yuen JC, Kaczkowski PJ, Sapozhnikov OA, Chavrier F, Crum LA, Vaezy S. Gel phantom for use in high-intensity focused ultrasound dosimetry. Ultrasound Med. Biol. 2005 Oct;31:1383–1389. doi: 10.1016/j.ultrasmedbio.2005.06.004. [DOI] [PubMed] [Google Scholar]
- [27].Khokhlova TD, Canney MS, Khokhlova VA, Sapozhnikov OA, Crum LA, Bailey MR. Controlled tissue emulsification produced by high intensity focused ultrasound shock waves and millisecond boiling. J. Acoust. Soc. Am. 2011;130:3498–3510. doi: 10.1121/1.3626152. [DOI] [PMC free article] [PubMed] [Google Scholar]
- [28].Li T, Chen H, Khokhlova T, Wang Y-N, Kreider W, He X, Hwang JH. Passive cavitation detection during pulsed HIFU exposures of ex Vivo tissues and in vivo mouse pancreatic tumors. Ultrasound Med. Biol. 2014;40(7):1523–1534. doi: 10.1016/j.ultrasmedbio.2014.01.007. [DOI] [PMC free article] [PubMed] [Google Scholar]
- [29].Rose A. Human and electronic vision. Plenum Press; New York: 1974. [Google Scholar]
- [30].Daigle R. Sequence programming manual. Verasonics. 2011:64–65. [Google Scholar]
- [31].Evans DH, McDicken WN. Doppler Ultrasound - physics, instrumentation and clinical applications. 2000 [Google Scholar]
- [32].Kasai C, Namekawa K, Koyano A, Omoto R. Real-time two-dimensional blood flow imaging using an autocorrelation technique. IEEE Trans. Sonics Ultrason. 1985 May;32(3):458–464. [Google Scholar]
- [33].Rubin JM, Tuthill TA, Fowlkes JB. Volume flow measurement using doppler and grey-scale decorrelation. Ultrasound Med. Biol. 2001;27(1):101–109. doi: 10.1016/s0301-5629(00)00291-x. [DOI] [PubMed] [Google Scholar]
- [34].Montaldo G, Tanter M, Bercoff J, Benech N, Fink M. Coherent plane-wave compounding for very high frame rate ultrasonography and transient elastography. IEEE Trans. Ultrason. Ferroelectr. Freq. Control. 2009;56(3):489–506. doi: 10.1109/TUFFC.2009.1067. [DOI] [PubMed] [Google Scholar]
- [35].Tanter M, Fink M. Ultrafast imaging in biomedical ultrasound. IEEE Trans. Ultrason. Ferroelectr. Freq. Control. 2014;61(1):102–19. doi: 10.1109/TUFFC.2014.6689779. [DOI] [PubMed] [Google Scholar]