

Abstract
Limited data exist concerning the mechanisms that underlie the different motor features of Parkinson’s disease (PD) and their course over time. Our aims were (1) to identify longitudinal changes in PD patients and (2) to determine the neural correlates of the changes in movement initiation and velocity that occur in the course the disease. Thirteen early stage PD patients were scanned twice off antiparkinsonian medication with PET. Imaging was performed at baseline and again after 2 years while the subjects performed a motor task that was kinematically controlled across time. Paced reaching movements were made towards targets that were presented in a predictable order. Measures of movement onset time (OT) and mean velocity (MV) were recorded during PET. OT and MV decreased significantly from baseline to follow-up. With advancing disease, increasing subcortical activation was detected in the pallidum bilaterally and in the left putamen. In the cortex, motor-related activation increased in the right pre-SMA, anterior cingulate cortex and the left postcentral gyrus. Progressive delays in movement initiation (OT) correlated with increases in the right dorsal premotor cortex (dPMC). Slowing of movement (MV) was associated with declining activation in the left dorsolateral prefrontal cortex and dPMC. Our data suggest that with advancing PD, motor performance is associated with the recruitment of brain regions normally involved in the execution of more complex tasks.
Keywords: PET, Parkinson’s disease, Motor control, Longitudinal
Introduction
The cardinal signs of Parkinson’s disease (PD) include slowness of movement execution (bradykinesia) and initiation (akinesia). These clinical features of the disease have been observed to progress independently (Grafton, 2004; van Hilten et al., 1998). Nonetheless, the specific mechanisms underlying these aspects of motor impairment in PD as well as their differing time course with evolving disease are currently unknown. The mechanisms of parkinsonian bradykinesia are a topic of ongoing research (for reviews see Berardelli et al., 2001; Brooks, 1999; Hallett, 2003). At the muscle level, bradykinesia is characterized by a lack of activation in an appropriate time frame. The amount of EMG activity within a burst has been reported to be insufficient in PD (Baroni, 1984) requiring patients to repeat multiple cycles of triphasic bursts in order to finish a given movement extent. Similarly, it has been shown that the termination of a movement with the release of muscle force is slowed in PD (Jordan et al., 1992). Imaging studies have suggested that the central scaling mechanisms that are involved in movement velocity adaptation in health are dysfunctional in PD (Turner et al., 2003b). In particular, these investigators have suggested that defective cerebellar activation was a critical feature of parkinsonian bradykinesia. They also reported that PD patients performing tracking movements of increasing speed recruit brain areas that are not involved in velocity regulation in normals. These areas included premotor and parietal regions as well as the basal ganglia. Likewise, bradykinesia has been found to correlate with resting glucose utilization in the putamen and globus pallidus (Lozza et al., 2002).
Studies into the mechanisms of parkinsonian akinesia have suggested impairment at several levels (for review see Hallett, 2003). PD patients show longer simple reaction times (Bloxham et al., 1984; Hallett, 1990; Jahanshahi et al., 1992, 1993; Rafal et al., 1989) even if no motor requirements were imposed (Sheridan et al., 1987). Interestingly, rather than performing eye movements and limb movements in parallel, PD patients tend to finish necessary fixation movements prior to limb movement onset (Warabi et al., 1988). Electrophysiological studies have shown prolonged time between motor cortex activation and movement onset in PD patients (Chen et al., 2001; Pascual-Leone et al., 1994). The central mechanisms underlying delayed motor onset have been highlighted in imaging studies. Earlier studies in moderately advanced patients performing self-initiated movements have repeatedly demonstrated relative reductions of supplementary motor area (SMA) activation (Jahanshahi et al., 1995; Jenkins et al., 1992; Playford et al., 1992; Rascol et al., 1992). However, the results of recent studies involving early stage PD patients performing different motor tasks have been inconsistent. Freely chosen movements specifically induced relative deficits in pre-SMA activation across disease stages (Haslinger et al., 2001; Sabatini et al., 2000; Samuel et al., 1997). By contrast, externally triggered movements, as well as complex sequences, were not associated with differences in SMA activation (Catalan et al., 1999; Thobois et al., 2000), or may have involved relative increases in the activation of the SMA proper (Rowe et al., 2002; Sabatini et al., 2000; Turner et al., 2003a) or the pre-SMA (Eckert et al., 2006; Turner et al., 2003a).
SMA activation has been proposed to relate specifically to internally generated movements (Jenkins et al., 2000). However, it has recently been shown that healthy subjects activate SMA during externally cued movements, albeit with shorter latency before motor cortex activation than when movements were internally generated (Weilke et al., 2001). In PD, relative deficits in SMA activation were also found with externally paced bimanual movements (Samuel et al., 1997). By contrast, investigators using externally triggered motor activation paradigms and sequenced unimanual finger movements have also reported increased SMA activation in PD (Jahanshahi et al., 1995), particularly with increasing sequence length and complexity (Catalan et al., 1999). It has subsequently been suggested that lateral premotor (PMC), parietal and cerebellar regions compensate for SMA hypoactivity during parkinsonian movements (Catalan et al., 1999; Hanakawa et al., 1999; Haslinger et al., 2001; Rascol et al., 1997; Sabatini et al., 2000; Samuel et al., 1997). In keeping with the improvement in volitional movements by external cueing in PD, these areas were mainly found to be hyperactive during externally triggered motor tasks. Nonetheless, despite copious information regarding differences in motor activation response between PD patients and healthy control subjects, no data are available concerning longitudinal changes in brain activation during the course of the disease.
In this longitudinal study, we used a combined behavioral and imaging approach to assess longitudinal changes in movement initiation and velocity during the performance of a kinematically controlled sequential reaching task. At each time point, we used 15O-labeled water ( ) and PET to measure brain activation responses during task performance and to concurrently record descriptors of movement initiation and velocity. The aims of this study were to: (i) characterize longitudinal changes in movement-related brain activation occurring during the course of early PD, and (ii) identify the regional correlates of the changes in movement characteristics over the observational period.
Materials and methods
Patients
Thirteen early stage right-handed PD patients underwent PET imaging at baseline and again at mean follow-up of 2.3± 0.28 years [mean±SEM]. Patient characteristics are presented in Table 1. Briefly, at baseline, these subjects (age 58.5±10.2 years: disease duration 3.3±3.0 years, motor UPDRS 8.5±5.0; mean± SD) were hemiparkinsonian (Hoehn and Yahr Stages 1–1.5). Six patients had predominant left-sided limb involvement; the remaining seven had predominant clinical involvement of the right limbs. At follow-up subjects had progressed to a mean motor UPDRS of 16.7±8.8 (Hoehn and Yahr Stages 2–3). At baseline seven subjects were medication naïve and five were on levodopa/carbidopa, dopamine agonists, or both. The remaining subject was on deprenyl. By the second time point, all but one were medicated (see Table 1). A diagnosis of PD was made if the patient had pure parkinsonism without a history of causative factors such as encephalitis or neuroleptic treatment; did not have dementia, supranuclear gaze abnormalities or ataxia; and had a convincing response to a single oral dose of dopaminergic therapy (≥20% improvement in Unified Parkinson’s Disease Rating Scale (UPDRS) motor ratings).
Table 1.
Patient characteristics
| Patient | Initially
|
Baseline
|
Follow-up
|
||||||
|---|---|---|---|---|---|---|---|---|---|
| Sex | Age | Affected side | H and Y | UPDRS | Med. a | H and Y | UPDRS | Med. a | |
| 1 | M | 63 | L | 1 | 5 | 2 | 2 | 16 | 1, 2, 4 |
| 2 | M | 57 | L | 1 | 4.5 | 1, 2 | 2 | 8 | 4 |
| 3 | M | 49 | R | 1.5 | 10 | 1, 2, 3, 4 | 2 | 13 | 1, 2, 6 |
| 4 | M | 33 | L | 1 | 12 | None | 3 | 40 | 1, 4, 6 |
| 5 | M | 60 | L | 1 | 9 | None | 2.5 | 20 | 4 |
| 6 | M | 52 | R | 1 | 8 | None | 1.5 | 7 | 4 |
| 7 | M | 53 | R | 1 | 6 | None | 2 | 12 | None |
| 8 | F | 58 | L | 1.5 | 3 | 1, 2 | 2.5 | 11 | Missing data |
| 9 | F | 67 | R | 1.5 | 15 | None | 2.5 | 17 | 4 |
| 10 | M | 70 | R | 1 | 2 | 1 | 2.5 | 8 | 1, 4 |
| 11 | M | 70 | R | 1.5 | 19 | None | 2 | 22 | 1, 5 |
| 12 | F | 65 | L | 1 | 11.5 | 4 | 2 | 12 | 4 |
| 13 | M | 62 | R | 1 | 5 | None | 2 | 15 | 4 |
Medication key: 1=levodopa; 2=deprenyl; 3=anticholinergics; 4=dopamine agonists; 5=amantadine; 6=COMT inhibitor.
In the treated patients, antiparkinsonian medications were discontinued 12 h before behavioral assessment and PET imaging. PD patients were excluded from participation if Mini-Mental State Examination scores were less than 27. Further exclusion criteria included: (a) severe hypertension, cardiovascular disease, diabetes mellitus; (b) past or current psychiatric history; and (c) abnormal MRI. We have previously reported limited baseline behavioral and PET data from six out of these thirteen patients (Nakamura et al., 2001). In this study, the behavioral data (see below) from our PD patients were compared with those from a cohort of eight age-matched healthy volunteer subjects (age 55.8±11.4 years; p>0.5; four male). Recruitment criteria and limited data from these controls have appeared elsewhere (Carbon et al., 2003; Nakamura et al., 2001).
Behavioral tasks
During PET imaging, all subjects performed a motor task (CCW) and a sensory reference task (S). The characteristics of these tasks have been described in detail elsewhere (Carbon et al., 2003; Ghilardi et al., 2000; Nakamura et al., 2001). In both tasks, subjects observed a computer screen where eight radial targets were displayed. Targets were highlighted in synchrony with a tone at a set intertone interval of 1 s. During the motor task, targets appeared in a predictable counterclockwise (CCW) order and subjects were instructed to move a cursor on a digitizing tablet with their right hand out and back from a central starting position to one of eight radial targets. Subjects were also instructed to reach the target in synchrony with the tone. A successful hit was recorded if the movement reached the target within 250 ms prior to and after each tone. Successfully hit targets turned from black to grey. Thus, subjects were required to initiate each movement before each target and tone was presented and to reverse the movement in the target within this temporal window. Testing was done in separate trial blocks of 90 s. In the sensory reference (S) task, the eight targets were presented in random order and subjects were only instructed to observe the screen. All subjects learned to perform the task in a training session conducted 1 or 2 days before testing. Training was complete when performance in CCW reached a stable level of 90% correct hits.
The experimental constraints of the CCW motor task were kept constant across the two time points. Specifically, target rate and movement extent were identical for the activation experiments conducted at baseline and follow-up.
Motor performance: behavioral measures and data analysis
To characterize CCW performance during PET recording, we computed several kinematic measurements for each movement as described previously (Ghilardi et al., 2000). For the purpose of this study, we considered two measurements:
| Onset time (OT): | the interval between target and tone presentation and movement onset. Thus, onset times have negative values for all movements initiated before target appearance, as in timed response paradigms and positive values for movements initiated after target appearance, as in reaction time paradigms. |
| Mean velocity (MV): | the movement length (from onset to the reversal point) divided by the movement time. |
The former, onset time, can be considered the lead time prior to the movement start; the latter is a reflection of movement speed. Accordingly, motor performance worsens with decreases in OT, i.e., difficulties in movement initiation and increases in MV, i.e., motor slowing. For each subject, we computed the average value of these parameters for the PET epoch.
Paired t tests were performed on each of these variables to compare the baseline to the follow-up measures; these analyses were considered significant for p≤0.05. The change in the behavioral measures with respect to baseline was used as a covariate in image analysis (see below). These values were calculated as percent change (i.e., for onset time (OT) as [(OTbaseline − OTfollow-up)/OTbaseline]*100; and for mean velocity (MV) as [(MVbaseline − MVfollow-up)/MVbaseline]*100). Group comparisons of behavioral measurements were performed using analysis of variance (ANOVA). These effects were considered significant for p≤0.05.
Positron emission tomography
All subjects were scanned with PET at baseline and at follow-up. They fasted overnight prior to scanning and were withdrawn from antiparkinsonian medication for at least 12 h beforehand. PET imaging was performed using the GE Advance tomograph in 3D mode (Dhawan et al., 1998). Ethical permission for these studies was obtained from the Institutional Review Board of North Shore University Hospital. Written consent was obtained from each subject following detailed explanation of the procedures.
The details of the imaging procedures have been presented previously. At baseline as well as follow-up subjects underwent PET imaging while performing the CCW and S tasks twice in randomized order using the dominant right hand (Nakamura et al., 2001). In each task, relative regional cerebral blood flow (rCBF) was estimated using a modification of the slow bolus method (Silbersweig et al., 1993). Using this injection protocol, there was a time delay of approximately 17 s before onset of brain radioactivity, and the time from onset to peak count rate was 45–50 s. The timing of task initiation was individually adjusted so that the arrival of radioactivity occurred approximately 10 s after the start of each task. PET data acquisition began at the time of radioactivity arrival in the brain and continued for 80 s. The end of task thus coincided with the end of data acquisition. In this slow bolus PET method, images reflect rCBF during the rising phase of the brain radioactivity, corresponding to the 2nd–8th cycles in our tasks. The interval between successive administrations was 10 min to allow for the decay of radioactivity.
Image analysis
Scan preprocessing was performed using SPM 99 (Wellcome Department Cognitive Neurology, London, UK) implemented in Matlab (Mathworks, Sherborn, MA). The PET scans from each subject were realigned using the mean image as a reference. All images were proportionally rescaled to a global CBF of 50 ml/min/dl and stereotaxically normalized into a standard anatomical space developed at the Montreal Neurological Institute (Collins et al., 1994). The images were smoothed with an isotropic Gaussian kernel (FWHM 10 mm for all directions) to allow for interindividual gyral variation and to improve the signal to noise ratio.
The specific regions activated during CCW at baseline and follow-up were identified using the multi-subject conditions and covariate analysis option in SPM, with CCWbaseline, Sbaseline, CCWfollow-up, Sfollow-up representing the four conditions per subject. Comparison of rCBF during CCW was performed by generating SPM{t} maps. Areas with motor-related activation at both times were detected in the model by specifying a contrast of [CCWbaseline, CCWfollow-up] > [Sbaseline, Sfollow-up]. Areas with declining motor activation at follow-up relative to baseline were detected by specifying a contrast of CCWbaseline >CCWfollow-up. Similarly, areas with increasing motor activation at follow-up relative to baseline were detected by specifying a contrast of CCWbaseline <CCWfollow-up.
We also identified brain regions in which the change of activation responses during motor execution correlated with (1) the change in OT or (2) the change in MV. This was performed in two separate analyses using the multi-subject conditions and covariate analysis option in SPM. This analysis was applied to the rCBF scan data obtained during CCW performance at baseline and follow-up, with the percent change in OT or MV as the respective covariates of interest.
In all analyses, activations and regional correlations were considered significant at a false discovery rate (FDR) corrected threshold of p ≤0.05 (Genovese et al., 2002; Marchini and Presanis, 2004), as well as at a threshold of p≤0.05 voxel level corrected for multiple comparisons. Additionally, we reported activations at p ≤0.001 at peak voxel uncorrected (for> 100 contiguous voxels). Coordinates were reported in the standard anatomical space developed at the Montreal Neurological Institute.
For all correlation analyses, SPM was used as an exploratory tool to search for correlations; all correlations were confirmed post hoc with non-parametric tests. Post hoc analyses were also performed on all imaging data to assess confounding effects of the hemiparkinsonian subgroups. All calculations were performed on PCs running Windows 2000. All statistical analyses were performed using JMP software (SAS Institute Inc., Cary, NC) for PC.
Results
Behavioral analysis
Motor performance
Patients with PD performed the motor task at baseline and follow-up with a comparable hit rate (95.6±2.5% and 93.2±4.6%, respectively). OT decreased from baseline (−407.9 ms±52.5; mean±SD; range: −482.9–299.8 ms) to follow-up (−336.3 ms± 78.2; range: −435.9–127.6 ms; p<0.001) with a mean reduction of 16.6%. Compared to age-matched controls, who perform this task with a mean OT of −548.4 ms±182.3, the PD group shows a significant 25.6% reduction from normal (p=0.002) at baseline, and a 38.7% reduction from normal (p<0.0001) at follow-up. MV decreased from baseline (3.72 cm/s±1.35; range: 1.12–6.88 cm/s) to follow-up (3.06 cm/s±1.02; range: 0.70–4.28 cm/s; p=0.05) with a mean reduction of 12.7%. At both time points MV values of the PD patients were lower than those of the healthy control subjects (4.36±1.10 cm/s; p<0.01).
The relative changes in OT correlated significantly with the change in UPDRS motor scores (R=−0.79, p=0.002). By contrast, the relative changes in MV were not reflected in the change of UPDRS motor scores (R =0.33, p>0.3).
OT and MV did not correlate at baseline or follow-up (R <0.2, p>0.4). Additionally, OT at baseline did not predict OT at follow-up (R <0.2, p >0.4). MV values at baseline and follow-up were not significantly correlated, although a trend was noted across time points (R =0.33, p=0.12). Furthermore, the relative changes in MV and OT also show a trend towards correlation (R=−0.33, p=0.10). Both measures were therefore used only in separate design matrices for the image analysis.
We found behavioral differences between the left and right hemiparkinsonian subgroups. At baseline, OT was relatively longer (i.e., better movement initiation) in the left hemiparkinsonian subgroup compared to the right hemiparkinsonian group (L-Hemi: −445.0 ms±26.4; R-Hemi −382.2±51.8; p=0.003). By contrast, MV was comparable across these subgroups (L-Hemi: 3.52 cm/s± 1.04; R-Hemi: 3.67 cm/s±1.72; p>0.5). At follow-up, OT was comparable across groups (L-Hemi: −334.0 ms±97.6; R-Hemi: −351.1±70.6; p>0.5), while MV tended to be relatively faster in the left hemiparkinsonian subgroup (L-Hemi: 3.4 cm/s±0.85; R-Hemi: 2.76 cm/s±1.1; p=0.13). As a consequence the percent reduction over time in OT was more pronounced in the left hemiparkinsonian subgroup (L-Hemi: 29.2% ± 19.2; R-Hemi: 7.8%±16.4; p=0.02); with OT changing significantly only in the L-Hemi (p=0.001). By contrast, the percent reduction in MV was marginally more pronounced in R-Hemi (25.6%± 27.9) compared to L-Hemi (2.6%±37.3; p =0.07); with significant changes in MV in each of the two subgroups (p=0.05).
Image analysis
Main effect of sequential reaching
Analysis of motor execution at baseline and follow-up gave rise to two large activation clusters (Fig. 1). The first cluster (x=−36, y =−14, z=62; Zmax =Inf; ke =11156; pcorr <0.0001) covered the left sensorimotor cortices (SMC, BAs 1–4) with additional small contribution of the right-sided homologues. This cluster also contained bilateral contributions from the premotor cortex (PMC) (extending from the dorsal to ventral borders of this structure on the left, and restricted to its dorsal aspect on the right), supplementary motor area (SMA, BA 6), and in the anterior cingulate region (BA 24/32), with left sided predominance. The cluster also extended into the left parietal association regions (BA 5, 7, 40). The second large cluster centered around the right cerebellar hemisphere (x = 20, y = −56, z = −24; Zmax = Inf; ke =8893; pcorr <0.0001) and covered the vermis, superior right cerebellum, and the pons. This cluster extended into the cuneus and occipital association regions (mainly BA 17/18/19, left>right), and into the left posterior cingulate region.
Fig. 1.

Significant (pcorr <0.05) activation responses during the execution of an externally cued repetitive reaching task (see text). The surface rendering of the statistical map (SPM 99 canonical template) reflects the main effect of the task in 13 early stage PD patients scanned at baseline and at 2 years follow-up. The motor activation response was localized to the primary (sensorimotor cortex, SMC) and secondary motor areas (premotor cortex, PMC; and supplementary motor area, SMA) and to parietal (PAR) and occipital association cortices (OCC). Significant cerebellar and basal ganglia activation responses were also present.
A smaller cluster covered partly the left putamen and lateral globus pallidus (x=−34, y=−2, z=4; Zmax =5.3; ke =813; pcorr < 0.0001).
Longitudinal changes in brain activation during sequential reaching
There was no effect of time on global cerebral blood flow
At follow-up, significant changes in movement-related brain activation were identified relative to baseline (see Table 2, Fig. 2). Relative increases in activation were detected in the globus pallidus (GP) bilaterally, extending into the left putamen, and in the right ventral posterior thalamus. Additional regional increases were identified in the right pre-SMA (BA 6) and anterior cingulate cortex (BA 32), and in the left postcentral gyrus (BA 5), medial superior temporal gyrus (BA 38), and parahippocampal cortex. Other regions with increased task-related activation included the left cerebellar dentate nucleus and the dorsal pons in the vicinity of the pedunculopontine nucleus.
Table 2.
Brain regions with significant increases in motor-related brain activation over time (CCWbaseline <CCWfollow-up) (see Fig. 2)
| Brain region | Coordinates (MNI)
|
Cluster extent
|
|||
|---|---|---|---|---|---|
| Zmax | x | y | z | ke | |
| L putamen/GPea,b | 5.8 | −28 | 8 | 0 | 1781 |
| L cerebellum, dentate nucleus a | 4.0 | −24 | −44 | −32 | 61 |
| R GPea,b | 4.8 | 24 | −20 | 2 | 164 |
| R anterior cingulate a, BA 32 | 4.0 | 6 | 28 | −8 | 48 |
| R pre-SMA a, BA 6 | 3.8 | 14 | 22 | 66 | 30 |
| L postcentral gyrus a, BA 5 | 3.9 | −8 | −50 | 74 | 32 |
| R superior temporal/parahippocampal gyrusa,b, BA 38 | 4.6 | 32 | 2 | −18 | 190 |
| Inferior brainstema,b | 5.2 | −4 | −38 | −36 | 175 |
p<0.05 FDR corrected.
SPM cluster level corrected p<0.05.
Fig. 2.

Significant increases in motor-related brain activation with disease progression in early stage PD (see text). SPM{t} maps were superimposed on a single-subject MRI T1 template (left panel: axial slices; right panel: sagittal slices). Relatively increased activation at follow-up was localized to the globus pallidus bilaterally, extending into the left putamen. Longitudinal motor activation increases were also noted in the right anterior cingulate, pre-SMA and in the inferior brainstem [the color scale represents T values thresholded at 4.55; p=0.05, corrected for multiple comparisons].
Relative declines in activation were present in the right inferior parietal cortex (BA 40; pcorr <0.05) and in the right superior temporal sulcus (puncorr < 0.001) (see Table 3, Fig. 3). No differences in the rCBF changes with time were found between the left and right hemiparkinsonian subgroups.
Table 3.
Brain regions with decreases in motor-related brain activation over time (CCWbaseline >CCWfollow-up) (see Fig. 3)
| Brain region | Coordinates (MNI)
|
Cluster extent
|
|||
|---|---|---|---|---|---|
| Zmax | x | y | z | ke | |
| R inferior parietal cortex (BA 40) a | 4.3 | 72 | −30 | 24 | 351 |
| R superior temporal (BA 22) b | 3.9 | 54 | −10 | −8 | 115 |
SPM cluster level corrected p<0.05.
SPM peak voxel uncorrected p<0.001.
Fig. 3.
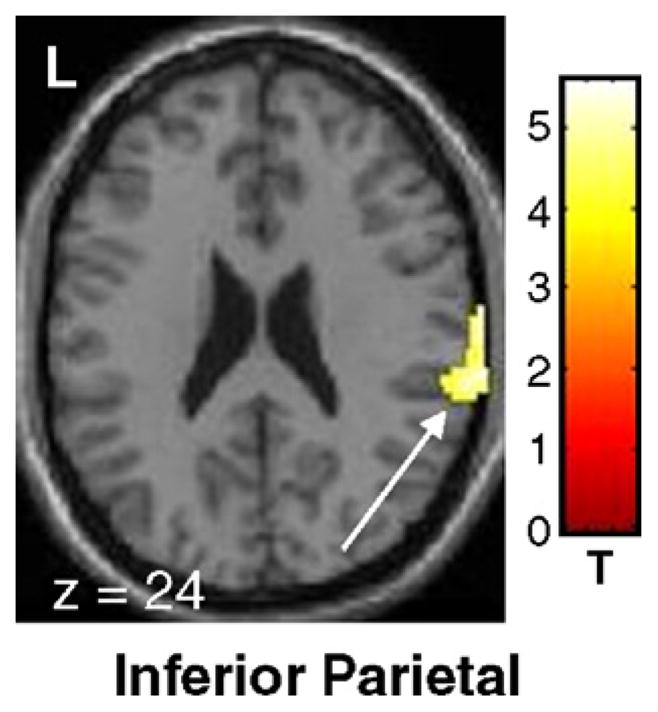
Significant declines in motor-related brain activation with disease progression in early stage PD (see text). SPM{t} maps were superimposed on a single-subject MRI T1 template (overlay as in Fig. 2: axial slice). At follow-up, a significant decline was present in the right inferior parietal region (BA 40) [the color scale represents T values thresholded at 3.55; p<0.001, uncorrected for multiple comparisons].
Relationships of longitudinal changes in brain activation to changes in onset time
The change in OT from baseline to follow-up was correlated with the longitudinal activation increase during motor execution (CCWfollow-up >CCWbaseline). A positive correlation (SPM peak voxel, puncorr <0.001) (see Table 4, Fig. 4) was detected in the right dorsal PMC (dPMC, BA 6). In this region, activation responses increased with time in association with progressive delays in movement onset. We found no regions with significant negative correlations between these variables. These relationships were similar in both hemiparkinsonian subgroups (R-Hemi: R =0.60, p=0.05; L-Hemi: R =0.80, p=0.01).
Table 4.
Brain regions with associations of longitudinal changes in brain activation to changes in onset time and mean velocity (see Figs. 4, 5)
| Brain region | Covariate | Coordinates (MNI)
|
Correlation coefficient a
|
|||
|---|---|---|---|---|---|---|
| Zmax | x | y | z | R | ||
| R dorsal premotor cortex b, BA 6 | Onset time | 5.0 | 39 | −2 | 56 | 0.63 |
| L dorsal premotor cortex b, BA 6 | Velocity | 4.4 | −52 | 4 | 50 | −0.66 |
| L DLPFC c, BA 45/46/47 | Velocity | 5.1 | −52 | 36 | 16 | −0.69 |
Post hoc VOI based Spearman rank correlation coefficient; p<0.01 for all post hoc analyses.
SPM peak voxel uncorrected p<0.001.
SPM cluster level corrected p<0.05.
Fig. 4.
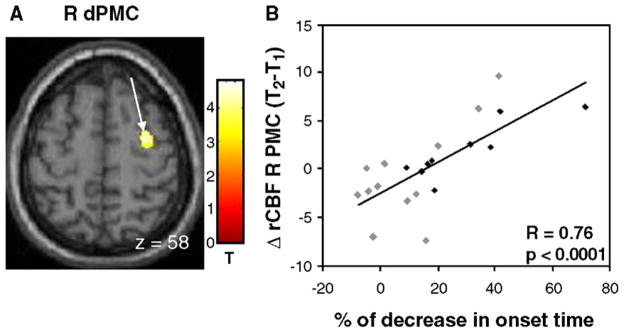
Relationship between progressive slowing in movement initiation and longitudinal changes in motor activation. (A) A significant correlation between these variables was identified in the right dorsal premotor cortex (dPMC) [the color stripe represents T values thresholded at 3.23; p<0.001, uncorrected]. (B) Scatterplot of individual subject rCBF values extracted from the cluster displayed in panel A (arrow; gray diamonds=R-Hemi; black diamonds=L-Hemi; see text). A significant correlation was present between worsening OT measures at follow-up and increasing activation within the right dPMC.
Relationships of longitudinal changes in brain activation to changes in mean velocity
The change in MV over time was correlated with the longitudinal change in activation during motor execution (CCWfollow-up > CCWbaseline). Significant correlations (pcorr <0.05) between declines in MV (see Table 4, Fig. 5) and changes in motor activation responses were detected in the left dorsolateral prefrontal cortex (DLPFC, BA 45/46/47). Additionally, correlations (SPM peak voxel, uncorrp <0.001) were detected in the left dPMC (BA 6). In these regions, activation responses at follow-up increased with increases in MV and declined in association with progressive slowing of movement velocity. We found no significant negative correlations between these variables. As with OT, these relationships were similar in both hemiparkinsonian subgroups (for the left dPMC: R-Hemi: R=0.69, p=0.01; L-Hemi: R=0.70, p=0.02; for the left DLPFC: R-Hemi: R =0.59, p=0.05; L-Hemi: R=0.78, p=0.005).
Fig. 5.

Relationship between changes in movement velocity and longitudinal changes in motor activation (positive values indicate increases in speed and negative values indicating movement slowing). (A) Significant correlations between these variables were identified in the left premotor cortex (dPMC; top) and in the dorsolateral prefrontal cortex (DLPFC; bottom) [the color stripe represents T values thresholded at 3.23; p<0.001, uncorrected]. (B) Scatterplots of individual subject rCBF values extracted from the clusters displayed in panel A (arrows; gray diamonds=R-Hemi; black diamonds=L-Hemi; see text). Significant correlations were present between the reduction in mean velocity at follow-up and declining activation within the left dPMC and DLPFC.
Discussion
This is the first longitudinal imaging study of motor activation responses in PD. At both time points, the pattern of motor activation in this early stage PD cohort was similar to that seen in healthy control subjects, with involvement of cortical motor regions as well as the basal ganglia, thalamus, and cerebellum (Ghilardi et al., 2003; Grafton et al., 1996). However, significant regional changes were identified across time. Surprisingly, declines in motor-related activation with disease progression were restricted to the right inferior parietal cortex and the right temporal sulcus, but did not include primary or secondary motor areas. By contrast, increasing activation was localized to the lateral pallidum bilaterally as well as to the left putamen, notably covering 2232 voxels on the left side. Cortical activation increases included the right pre-SMA, the anterior cingulate cortex (BA 32) and the right parahippocampal cortex.
Longitudinal changes in motor activation
We found a longitudinal decline in task-related activation in the inferior parietal cortex (BA 40) ipsilateral to the reaching hand. As this area is known to be involved in visual–spatial integration of reaching movements (Goodale et al., 1991; Taira et al., 1990), this decline may point to increasing difficulties in processing visual–spatial demands with disease progression. Decreased activation of the right parietal region has also been reported for self-initiated finger extension in PD compared to controls (Jahanshahi et al., 1995), although that task may require less visual–spatial integration. We also found a decline in task-related activation in the right superior temporal cortex. This area was activated during reaching movements in health (Winstein et al., 1997), but the specific role of this area in motor control is not known.
Increasing motor-related activation was localized to the lateral pallidum bilaterally, the right pre-SMA, the anterior cingulate cortex (BA 32) and the parahippocampal cortex. In general, our study design does not allow for a separation of compensatory brain activation from pathologic disinhibition. Nevertheless, performance measures for the whole group, in particular those of movement initiation and velocity, declined during the follow-up period. This suggests that compensatory brain activation responses were not fully effective.
Interestingly, previous imaging studies of motor-related activation in PD have not shown differences in pallidal activation compared to controls, although the globus pallidus is located in a key position in cortico-striato-pallido-thalamic (CSPTC) loops and is heavily implicated in models of PD (Bergman et al., 1998). Our results are in line with electrophysiological recordings in parkinsonism showing a loss of spatial selectivity in experimental animal models (e.g., Boraud et al., 2000, 2002; Wichmann et al., 1994) and in PD patients (Williams et al., 2005). Pallidal recordings in primates demonstrated that after MPTP treatment a greater proportion of pallidal neurons responded to passive movements of the contralateral limb with firing rate increases (Boraud et al., 2000). The same study also showed that after MPTP treatment there was a loss of selectivity in pallidal neurons with a smaller proportion of neurons responding selectively to contralateral movements. Instead, an increased proportion of pallidal neurons responded nonselectively to either contralateral or ipsilateral movement. Additionally, the proportion of pallidal neurons responding to more than one joint movement increased, indicating a further loss of selectivity of pallidal activation. Intraoperative electrophysiological recordings in PD patients during motor activation showed that nondirectional cells had significantly higher firing rates than directionally selective cells. Our results of increasing motor-related pallidal blood flow with disease progression are consistent with the notion of concomitant increases in the recruitment of nondirectional cells in PD, reflecting a loss of spatial selectivity. Alternatively, it could be suggested that activation increases in the external pallidal segment (GPe) point to a preponderance of the indirect striatopallidal system (Mitchell et al., 1989) with disease progression resulting in a net movement inhibitory effect. Additionally, it is possible that increasing pallidal activation over time reflected compensatory activation within the basal ganglia (see, e.g., Bezard et al., 2003). However, our data cannot be used to determine whether such responses reflect a compensatory or pathological activity.
In our cohort, activation of the putamen contralateral to the moving hand also increased over time. These results contrast with the findings of Playford et al. (1992), showing decreased putamen activation during self-initiated movements compared to controls. Differences in motor paradigms may account for these seeming discrepancies. In contrast to the earlier study, we used a mixed paradigm where target appearance was both spatially and temporally predictable. This is a mixed task with characteristics of both internally and externally generated movements. Reduced putamenal activation in PD has not been shown for externally cued movements. Moreover, increasing putamenal activation over time may be secondary to enhanced cortical activation, with increased feedback to the basal ganglia via the CSPTC loops.
A loss of functional segregation of CSPTC loops has been suggested as a specific consequence of decreasing dopaminergic input into the pallidum (Bergman et al., 1998). Mink (1996) suggested that pallidal disinhibition leads to downstream disinhibition of competing motor programs and failure to facilitate desired motor programs. This loss of inhibition of competing programs may be the cause for the increased pre-SMA activation in a task which includes only minimal motor planning. We note, however, that our group of PD patients performed the task to a comparable degree at both baseline and follow-up. Thus, at follow-up, the patients are likely to have invested neural resources to compensate for increasing motor impairment. Increased activation of the right anterior cingulate might reflect an increased need for spatial attention (Thiel et al., 2004; Waberski et al., 2002; Wenderoth et al., 2005). In keeping with this suggestion, Sabatini et al. (2000) reported increased motor-related anterior cingulate activation in PD patients compared to controls. Similarly, increasing pre-SMA activation with disease progression is in line with the findings of prior studies that described increasing SMA or pre-SMA activation (Catalan et al., 1999; Eckert et al., 2006) in PD, as well as increasing pre-SMA activation in controls performing motor tasks with greater complexity (Boecker et al., 1998). Indeed, using continuous visuomotor tracking, Turner et al. (2003b) reported increased pre-SMA activation in moderate to advanced stage PD patients relative to controls.
Additional increases in cortical activation were detected in the right parahippocampal gyrus. In health, this area is involved in visuospatial navigation during movement (Ekstrom et al., 2003; Epstein and Kanwisher, 1998; Malouin et al., 2003). However, the navigational stimuli in these studies were represented in three-dimensional space, while in our experiment only a two-dimensional target array was involved. Nevertheless, it may be reasonable to suggest that increasing activation of the medial temporal and parahippocampal cortex during sequential reaching in PD relates to decreased selectivity in visuospatial processing. This is also in line with the idea that with advancing PD increasing cortical control is needed to execute movements to a similar degree of accuracy.
Surprisingly at follow-up, PD patients also displayed increasing activation of the left (contralateral) cerebellar dentate nucleus. Although motor preparation and execution-related cerebellar activation is localized contralateral to the moving extremity, fMRI studies have described bilateral cerebellar activation in healthy subjects during unilateral movements (Cui et al., 2000). Recruitment of contralateral homologues is often seen as a compensatory mechanism (Mentis et al., 2003; Nakamura et al., 2001). Thus, the presence of increasing contralateral cerebellar activation may be interpreted in a similar vein.
Correlates of the changes in movement characteristics over time
As expected, we found that during the early course of PD, OT and MV worsen slightly but significantly. These changes were significant for the entire group, although not every individual subject displayed increasing measures of akinesia and bradykinesia at follow-up.
Longitudinal changes in movement initiation were more pronounced in the left hemiparkinsonian subgroup. We note that during the follow-up period, all patients transitioned from Hoehn and Yahr Stage I, defined as unilateral PD, to Stage II, which is defined as bilateral disease. All subjects performed the task with their dominant right hand. Thus, at baseline the left hemiparkinsonian subgroup did not display clinical symptoms of PD in the limb involved in the motor task. However, akinesia, as measured by reduced OT in our paradigm, developed on the right side as well by the time of follow-up. By contrast, the right hemiparkinsonian subgroup displayed shorter movement initiation intervals at baseline in accordance with the presence of clinical signs of PD in the limb involved in the motor task. To detect changes in activation relating specifically to these features of parkinsonian movement, we performed univariate correlations between changes in motor-related activation over time and changes in the associated kinematic descriptors.
We found relative activation increases relating to the change in movement onset times in the right dPMC (BA 6). PMC activation increases in akinetic PD patients relative to controls have been reported earlier (Catalan et al., 1999; Hanakawa et al., 1999; Haslinger et al., 2001; Rascol et al., 1997; Sabatini et al., 2000; Samuel et al., 1997). These studies suggested a compensatory role of the PMC for SMA activation deficits: a feature that we could not detect in this cohort. As suggested above, increasing bilateralization of motor activation with disease progression may also arise from a loss of functional selectivity of motor programs with increasing basal ganglia dysfunction.
Decreases in MV correlated with relative decreases in left dPMC and DLPFC activation over the course of time. The dPMC has been implicated in the modulation of velocity with ipsilateral activation in healthy controls (Turner et al., 2003a; Winstein et al., 1997) and bilateral activation in PD (Turner et al., 2003b). Relative to controls, moderately advanced PD patients (Turner et al., 2003b) employed a far broader array of brain regions to control velocity; i.e., bilateral lateral, mesial and ventral PMC as well as left basal ganglia and midline cerebellum. The fact that this cohort of early PD patients shows a decrease in left dPMC activation concomitant with a decline in MV suggests that broad involvement of motor cortical areas in velocity control is a characteristic of advanced disease stages only.
We also observed a modulation of DLPFC activation with changes in movement velocity. A decreased DLPFC activation in PD compared to controls was found in earlier studies (Cunnington et al., 2001; Jahanshahi et al., 1995; Playford et al., 1992; Sabatini et al., 2000). However, the specific role of DLPFC activation in parkinsonian movement has not been studied. In health, this area has been implicated in attention to action (Jueptner et al., 1997). It is possible that the subjects in our study, who succeeded to increase their movement speed substantially at follow-up, did so to compensate for a delay in movement initiation. A secondary analysis with the exclusion of these subjects (n=4) revealed that brain activation–behavior relationships in BA 6 persisted for the remaining subgroup, while those in DLPFC did not. It is therefore possible that DLPFC activation is a feature of a successful compensatory trade-off between movement initiation and velocity. In the setting of evolving bradykinesia, the PD subjects succeeded in speeding up movements to compensate for the progressive delays in movement initiation that were observed.
The current experiments were designed to assess the longitudinal changes of motor-related activation in the early course of PD. These changes encompass increasing pathology and compensatory efforts at the same time. We have previously reported that early PD patients (partly overlapping with this group) performing the same motor task did not exhibit abnormal activation (Nakamura et al., 2001). Similarly, our current group of PD patients did not show significant activation differences compared to controls (data not shown). However, without longitudinal follow-up data in the healthy controls, we cannot exclude the possibility that motor-related brain activation changed during the follow-up period.
The motor task used in this study was designed to provide stable and reproducible motor activation responses at each time point. We therefore chose a mixed motor paradigm with movements that were externally cued but have to be anticipatorily initiated. This way, all subjects performed the same number of reaching movements during the scanning period. More importantly, using this methodology we ensured that patients were able to perform the same number of movements at baseline and at follow-up. External cueing has been shown not only to improve movement preparation time (which would be reflected in OT in our paradigm), but also movement times (which would be reflected in MV in our paradigm) (Georgiou et al., 1994). The OT changes in our paradigm may not only reflect a delay in movement initiation, but may also be influenced by impaired timing perception (Elsinger et al., 2003) which may have affected target anticipation.
Conclusions
Our data indicate that with advancing PD, the greatest regional change in motor activation is localized to the globus pallidus. This finding is in keeping with physiological and metabolic data implicating increased activity in this area as the primary functional mediator of the motor manifestations of this disorder. By contrast, individual differences in the progression of movement initiation and velocity are associated with changes in motor association and prefrontal areas. We found that with disease progression brain regions were recruited to modulate motor performance that was normally associated with the execution of more complex tasks. This may either reflect an increasing loss of functional selectivity with advancing disease or inefficient compensatory activation.
Acknowledgments
This work was supported by P50 NS 38370 and RO1 NS 35069 (D.E.). Dr. Carbon was supported by the Veola T. Kerr Fellowship of the Parkinson Disease Foundation. We additionally extend thanks to Ms. Toni Flanagan, Ms. Christine Edwards, and Mr. Aaron Edelstein for editorial assistance, and to Dr. Giulia Silvestri for assistance with the experiments. We acknowledge the valuable technical support provided by Dr. Abdel Belakhleff and Mr. Claude Margouleff.
References
- Baroni A. Human ballistic arm abduction movements: effects of L-dopa treatment in Parkinson’s disease. Neurology. 1984;34:868–876. doi: 10.1212/wnl.34.7.868. [DOI] [PubMed] [Google Scholar]
- Berardelli A, Rothwell JC, Thompson PD, Hallett M. Pathophysiology of bradykinesia in Parkinson’s disease. Brain. 2001;124:2131–2146. doi: 10.1093/brain/124.11.2131. [DOI] [PubMed] [Google Scholar]
- Bergman H, Feingold A, Nini A, et al. Physiological aspects of information processing in the basal ganglia of normal and parkinsonian primates. Trends Neurosci. 1998;21:32–38. doi: 10.1016/s0166-2236(97)01151-x. [DOI] [PubMed] [Google Scholar]
- Bezard E, Gross CE, Brotchie JM. Presymptomatic compensation in Parkinson’s disease is not dopamine-mediated. Trends Neurosci. 2003;27:127–128. doi: 10.1016/S0166-2236(03)00038-9. [DOI] [PubMed] [Google Scholar]
- Bloxham CA, Mindel TA, Frith CD. Initiation and execution of predictable and unpredictable movements in Parkinson’s disease. Brain. 1984;107 (Pt. 2):371–384. doi: 10.1093/brain/107.2.371. [DOI] [PubMed] [Google Scholar]
- Boecker H, Dagher A, Ceballos-Baumann AO, et al. Role of the human rostral supplementary motor area and the basal ganglia in motor sequence control: investigations with H2 15O PET. J Neurophysiol. 1998;79:1070–1080. doi: 10.1152/jn.1998.79.2.1070. [DOI] [PubMed] [Google Scholar]
- Boraud T, Bezard E, Bioulac B, Gross CE. Ratio of inhibited-to-activated pallidal neurons decreases dramatically during passive limb movement in the MPTP-treated monkey. J Neurophysiol. 2000;83:1760–1763. doi: 10.1152/jn.2000.83.3.1760. [DOI] [PubMed] [Google Scholar]
- Boraud T, Bezard E, Bioulac B, Gross CE. From single extracellular unit recording in experimental and human Parkinsonism to the development of a functional concept of the role played by the basal ganglia in motor control. Prog Neurobiol. 2002;66:265–283. doi: 10.1016/s0301-0082(01)00033-8. [DOI] [PubMed] [Google Scholar]
- Brooks DJ. Functional imaging of Parkinson’s disease: is it possible to detect brain areas for specific symptoms? J Neural Transm. 1999;56(Suppl):139–153. doi: 10.1007/978-3-7091-6360-3_8. [DOI] [PubMed] [Google Scholar]
- Carbon M, Ghilardi MF, Feigin A, et al. Learning networks in health and Parkinson’s disease: reproducibility and treatment effects. Hum Brain Mapp. 2003;19:197–211. doi: 10.1002/hbm.10115. [DOI] [PMC free article] [PubMed] [Google Scholar]
- Catalan MJ, Ishii K, Honda M, Samii A, Hallett M. A PET study of sequential finger movements of varying length in patients with Parkinson’s disease. Brain. 1999;122 (Pt. 3):483–495. doi: 10.1093/brain/122.3.483. [DOI] [PubMed] [Google Scholar]
- Chen R, Kumar S, Garg RR, Lang AE. Impairment of motor cortex activation and deactivation in Parkinson’s disease. Clin Neurophysiol. 2001;112:600–607. doi: 10.1016/s1388-2457(01)00466-7. [DOI] [PubMed] [Google Scholar]
- Collins DL, Neelin P, Peters TM, Evans AC. Automatic 3D intersubject registration of MR volumetric data in standardized Talairach space. J Comput Assist Tomogr. 1994;18:192–205. [PubMed] [Google Scholar]
- Cui SZ, Li EZ, Zang YF, Weng XC, Ivry R, Wang JJ. Both sides of human cerebellum involved in preparation and execution of sequential movements. NeuroReport. 2000;11:3849–3853. doi: 10.1097/00001756-200011270-00049. [DOI] [PubMed] [Google Scholar]
- Cunnington R, Egan GF, O’Sullivan JD, Hughes AJ, Bradshaw JL, Colebatch JG. Motor imagery in Parkinson’s disease: a PET study. Mov Disord. 2001;16:849–857. doi: 10.1002/mds.1181. [DOI] [PubMed] [Google Scholar]
- Dhawan V, Kazumata K, Robeson W, et al. Quantitative brain PET. Comparison of 2D and 3D acquisitions on the GE advance scanner. Clin Positron Imaging. 1998;1:135–144. doi: 10.1016/s1095-0397(98)00009-0. [DOI] [PubMed] [Google Scholar]
- Eckert T, Peschel T, Heinze HJ, Rotte M. Increased pre-SMA activation in early PD patients during simple self-initiated hand movements. J Neurol. 2006 Feb;253 (2):199–207. doi: 10.1007/s00415-005-0956-z. [DOI] [PubMed] [Google Scholar]
- Ekstrom AD, Kahana MJ, Caplan JB, et al. Cellular networks underlying human spatial navigation. Nature. 2003;425:184–188. doi: 10.1038/nature01964. [DOI] [PubMed] [Google Scholar]
- Elsinger CL, Rao SM, Zimbelman JL, Reynolds NC, Blindauer KA, Hoffmann RG. Neural basis for impaired time reproduction in Parkinson’s disease: an fMRI study. J Int Neuropsychol Soc. 2003;9:1088–1098. doi: 10.1017/S1355617703970123. [DOI] [PubMed] [Google Scholar]
- Epstein R, Kanwisher N. A cortical representation of the local visual environment. Nature. 1998;392:598–601. doi: 10.1038/33402. [DOI] [PubMed] [Google Scholar]
- Genovese CR, Lazar NA, Nichols T. Thresholding of statistical maps in functional neuroimaging using the false discovery rate. NeuroImage. 2002;15:870–878. doi: 10.1006/nimg.2001.1037. [DOI] [PubMed] [Google Scholar]
- Georgiou N, Bradshaw JL, Iansek R, Phillips JG, Mattingley JB, Bradshaw JA. Reduction in external cues and movement sequencing in Parkinson’s disease. J Neurol, Neurosurg Psychiatry. 1994;57:368–370. doi: 10.1136/jnnp.57.3.368. [DOI] [PMC free article] [PubMed] [Google Scholar]
- Ghilardi M, Ghez C, Dhawan V, et al. Patterns of regional brain activation associated with different forms of motor learning. Brain Res. 2000;871:127–145. doi: 10.1016/s0006-8993(00)02365-9. [DOI] [PubMed] [Google Scholar]
- Ghilardi MF, Eidelberg D, Silvestri G, Ghez C. The differential effect of PD and normal aging on early explicit sequence learning. Neurology. 2003;60:1313–1319. doi: 10.1212/01.wnl.0000059545.69089.ee. [DOI] [PubMed] [Google Scholar]
- Goodale MA, Milner AD, Jakobson LS, Carey DP. A neurological dissociation between perceiving objects and grasping them. Nature. 1991;349:154–156. doi: 10.1038/349154a0. [DOI] [PubMed] [Google Scholar]
- Grafton ST. Contributions of functional imaging to understanding parkinsonian symptoms. Curr Opin Neurobiol. 2004;14:715–719. doi: 10.1016/j.conb.2004.10.010. [DOI] [PubMed] [Google Scholar]
- Grafton ST, Fagg AH, Woods RP, Arbib MA. Functional anatomy of pointing and grasping in humans. Cereb Cortex. 1996;6:226–237. doi: 10.1093/cercor/6.2.226. [DOI] [PubMed] [Google Scholar]
- Hallett M. Clinical neurophysiology of akinesia. Rev Neurol (Paris) 1990;146:585–590. [PubMed] [Google Scholar]
- Hallett M. Parkinson revisited: pathophysiology of motor signs. Adv Neurol. 2003;91:19–28. [PubMed] [Google Scholar]
- Hanakawa T, Fukuyama H, Katsumi Y, Honda M, Shibasaki H. Enhanced lateral premotor activity during paradoxical gait in Parkinson’s disease. Ann Neurol. 1999;45:329–336. doi: 10.1002/1531-8249(199903)45:3<329::aid-ana8>3.0.co;2-s. [DOI] [PubMed] [Google Scholar]
- Haslinger B, Erhard P, Kampfe N, et al. Event-related functional magnetic resonance imaging in Parkinson’s disease before and after levodopa. Brain. 2001;124:558–570. doi: 10.1093/brain/124.3.558. [DOI] [PubMed] [Google Scholar]
- Jahanshahi M, Brown RG, Marsden CD. Simple and choice reaction time and the use of advance information for motor preparation in Parkinson’s disease. Brain. 1992;115 (Pt. 2):539–564. doi: 10.1093/brain/115.2.539. [DOI] [PubMed] [Google Scholar]
- Jahanshahi M, Brown RG, Marsden CD. A comparative study of simple and choice reaction time in Parkinson’s, Huntington’s and cerebellar disease. J Neurol, Neurosurg Psychiatry. 1993;56:1169–1177. doi: 10.1136/jnnp.56.11.1169. [DOI] [PMC free article] [PubMed] [Google Scholar]
- Jahanshahi M, Jenkins IH, Brown RG, Marsden CD, Passingham RE, Brooks DJ. Self-initiated versus externally triggered movements: I. An investigation using measurement of regional cerebral blood flow with PET and movement-related potentials in normal and Parkinson’s disease subjects. Brain. 1995;118 (Pt. 4):913–933. doi: 10.1093/brain/118.4.913. [DOI] [PubMed] [Google Scholar]
- Jenkins IH, Fernandez W, Playford ED, et al. Impaired activation of the supplementary motor area in Parkinson’s disease is reversed when akinesia is treated with apomorphine. Ann Neurol. 1992;32:749–757. doi: 10.1002/ana.410320608. [DOI] [PubMed] [Google Scholar]
- Jenkins IH, Jahanshahi M, Jueptner M, Passingham RE, Brooks DJ. Self-initiated versus externally triggered movements: II. The effect of movement predictability on regional cerebral blood flow. Brain. 2000;123 (Pt. 6):1216–1228. doi: 10.1093/brain/123.6.1216. [DOI] [PubMed] [Google Scholar]
- Jordan N, Sagar HJ, Cooper JA. A component analysis of the generation and release of isometric force in Parkinson’s disease. J Neurol, Neurosurg Psychiatry. 1992;55:572–576. doi: 10.1136/jnnp.55.7.572. [DOI] [PMC free article] [PubMed] [Google Scholar]
- Jueptner M, Stephan KM, Frith CD, Brooks DJ, Frackowiak RS, Passingham RE. Anatomy of motor learning: I. Frontal cortex and attention to action. J Neurophysiol. 1997;77:1313–1324. doi: 10.1152/jn.1997.77.3.1313. [DOI] [PubMed] [Google Scholar]
- Lozza C, Marie RM, Baron JC. The metabolic substrates of bradykinesia and tremor in uncomplicated Parkinson’s disease. Neuro-Image. 2002;17:688–699. [PubMed] [Google Scholar]
- Malouin F, Richards CL, Jackson PL, Dumas F, Doyon J. Brain activations during motor imagery of locomotor-related tasks: a PET study. Hum Brain Mapp. 2003;19:47–62. doi: 10.1002/hbm.10103. [DOI] [PMC free article] [PubMed] [Google Scholar]
- Marchini J, Presanis A. Comparing methods of analyzing fMRI statistical parametric maps. NeuroImage. 2004;22:1203–1213. doi: 10.1016/j.neuroimage.2004.03.030. [DOI] [PubMed] [Google Scholar]
- Mentis MJ, Dhawan V, Feigin A, et al. Early stage Parkinson’s disease patients and normal volunteers: comparative mechanisms of sequence learning. Hum Brain Mapp. 2003;20:246–258. doi: 10.1002/hbm.10142. [DOI] [PMC free article] [PubMed] [Google Scholar]
- Mink JW. The basal ganglia: focused selection and inhibition of competing motor programs. Prog Neurobiol. 1996;50:381–425. doi: 10.1016/s0301-0082(96)00042-1. [DOI] [PubMed] [Google Scholar]
- Mitchell IJ, Clarke CE, Boyce S, et al. Neural mechanisms underlying parkinsonian symptoms based upon regional uptake of 2-deoxyglucose in monkeys exposed to 1-methyl-4-phenyl-1,2,3,6-tetra-hydropyridine. Neuroscience. 1989;32:213–226. doi: 10.1016/0306-4522(89)90120-6. [DOI] [PubMed] [Google Scholar]
- Nakamura T, Ghilardi MF, Mentis M, et al. Functional networks in motor sequence learning: abnormal topographies in Parkinson’s disease. Hum Brain Mapp. 2001;12:42–60. doi: 10.1002/1097-0193(200101)12:1<42::AID-HBM40>3.0.CO;2-D. [DOI] [PMC free article] [PubMed] [Google Scholar]
- Pascual-Leone A, Valls-Sole J, Brasil-Neto JP, Cohen LG, Hallett M. Akinesia in Parkinson’s disease: I. Shortening of simple reaction time with focal, single-pulse transcranial magnetic stimulation. Neurology. 1994;44:884–891. doi: 10.1212/wnl.44.5.884. [DOI] [PubMed] [Google Scholar]
- Playford ED, Jenkins IH, Passingham RE, Nutt J, Frackowiak RS, Brooks DJ. Impaired mesial frontal and putamen activation in Parkinson’s disease: a positron emission tomography study. Ann Neurol. 1992;32:151–161. doi: 10.1002/ana.410320206. [DOI] [PubMed] [Google Scholar]
- Rafal RD, Friedman JH, Lannon MC. Preparation of manual movements in hemiparkinsonism. J Neurol, Neurosurg Psychiatry. 1989;52:399–402. doi: 10.1136/jnnp.52.3.399. [DOI] [PMC free article] [PubMed] [Google Scholar]
- Rascol O, Sabatini U, Chollet F, et al. Supplementary and primary sensory motor area activity in Parkinson’s disease. Regional cerebral blood flow changes during finger movements and effects of apomorphine. Arch Neurol. 1992;49:144–148. doi: 10.1001/archneur.1992.00530260044017. [DOI] [PubMed] [Google Scholar]
- Rascol O, Sabatini U, Fabre N, et al. The ipsilateral cerebellar hemisphere is overactive during hand movements in akinetic parkinsonian patients. Brain. 1997;120 (Pt. 1):103–110. doi: 10.1093/brain/120.1.103. [DOI] [PubMed] [Google Scholar]
- Rowe J, Stephan KE, Friston K, Frackowiak R, Lees A, Passingham R. Attention to action in Parkinson’s disease: impaired effective connectivity among frontal cortical regions. Brain. 2002;125:276–289. doi: 10.1093/brain/awf036. [DOI] [PubMed] [Google Scholar]
- Sabatini U, Boulanouar K, Fabre N, et al. Cortical motor reorganization in akinetic patients with Parkinson’s disease: a functional MRI study. Brain. 2000;123 (Pt. 2):394–403. doi: 10.1093/brain/123.2.394. [DOI] [PubMed] [Google Scholar]
- Samuel M, Ceballos-Baumann AO, Blin J, et al. Evidence for lateral premotor and parietal overactivity in Parkinson’s disease during sequential and bimanual movements. A PET study. Brain. 1997;120 (Pt. 6):963–976. doi: 10.1093/brain/120.6.963. [DOI] [PubMed] [Google Scholar]
- Sheridan MR, Flowers KA, Hurrell J. Programming and execution of movement in Parkinson’s disease. Brain. 1987;110 (Pt. 5):1247–1271. doi: 10.1093/brain/110.5.1247. [DOI] [PubMed] [Google Scholar]
- Silbersweig DA, Stern E, Frith CD, et al. Detection of thirty-second cognitive activations in single subjects with positron emission tomography: a new low-dose H2(15)O regional cerebral blood flow three-dimensional imaging technique. J Cereb Blood Flow Metab. 1993;13:617–629. doi: 10.1038/jcbfm.1993.80. [DOI] [PubMed] [Google Scholar]
- Taira M, Mine S, Georgopoulos AP, Murata A, Sakata H. Parietal cortex neurons of the monkey related to the visual guidance of hand movement. Exp Brain Res. 1990;83:29–36. doi: 10.1007/BF00232190. [DOI] [PubMed] [Google Scholar]
- Thiel CM, Zilles K, Fink GR. Cerebral correlates of alerting, orienting and reorienting of visuospatial attention: an event-related fMRI study. NeuroImage. 2004;21:318–328. doi: 10.1016/j.neuroimage.2003.08.044. [DOI] [PubMed] [Google Scholar]
- Thobois S, Dominey PF, Decety PJ, et al. Motor imagery in normal subjects and in asymmetrical Parkinson’s disease: a PET study. Neurology. 2000;55:996–1002. doi: 10.1212/wnl.55.7.996. [DOI] [PubMed] [Google Scholar]
- Turner RS, Desmurget M, Grethe J, Crutcher MD, Grafton ST. Motor subcircuits mediating the control of movement extent and speed. J Neurophysiol. 2003a;90:3958–3966. doi: 10.1152/jn.00323.2003. [DOI] [PubMed] [Google Scholar]
- Turner RS, Grafton ST, McIntosh AR, DeLong MR, Hoffman JM. The functional anatomy of parkinsonian bradykinesia. Neuro-Image. 2003b;19:163–179. doi: 10.1016/s1053-8119(03)00059-4. [DOI] [PubMed] [Google Scholar]
- van Hilten JJ, van Eerd AA, Wagemans EA, Middelkoop HA, Roos RA. Bradykinesia and hypokinesia in Parkinson’s disease: what’s in a name? J Neural Transm. 1998;105:229–237. doi: 10.1007/s007020050051. [DOI] [PubMed] [Google Scholar]
- Waberski TD, Gobbele R, Darvas F, Schmitz S, Buchner H. Spatiotemporal imaging of electrical activity related to attention to somatosensory stimulation. NeuroImage. 2002;17:1347–1357. doi: 10.1006/nimg.2002.1222. [DOI] [PubMed] [Google Scholar]
- Warabi T, Yanagisawa N, Shindo R. Changes in strategy of aiming tasks in Parkinson’s disease. Brain. 1988;111 (Pt. 3):497–505. doi: 10.1093/brain/111.3.497. [DOI] [PubMed] [Google Scholar]
- Weilke F, Spiegel S, Boecker H, et al. Time-resolved fMRI of activation patterns in M1 and SMA during complex voluntary movement. J Neurophysiol. 2001;85:1858–1863. doi: 10.1152/jn.2001.85.5.1858. [DOI] [PubMed] [Google Scholar]
- Wenderoth N, Debaere F, Sunaert S, Swinnen SP. The role of anterior cingulate cortex and precuneus in the coordination of motor behaviour. Eur J Neurosci. 2005;22:235–246. doi: 10.1111/j.1460-9568.2005.04176.x. [DOI] [PubMed] [Google Scholar]
- Wichmann T, Bergman H, DeLong MR. The primate subthalamic nucleus: I. Functional properties in intact animals. J Neurophysiol. 1994;72:494–506. doi: 10.1152/jn.1994.72.2.494. [DOI] [PubMed] [Google Scholar]
- Williams ZM, Neimat JS, Cosgrove GR, Eskandar EN. Timing and direction selectivity of subthalamic and pallidal neurons in patients with Parkinson disease. Exp Brain Res. 2005;162:407–416. doi: 10.1007/s00221-004-2035-6. [DOI] [PubMed] [Google Scholar]
- Winstein CJ, Grafton ST, Pohl PS. Motor task difficulty and brain activity: investigation of goal-directed reciprocal aiming using positron emission tomography. J Neurophysiol. 1997;77:1581–1594. doi: 10.1152/jn.1997.77.3.1581. [DOI] [PubMed] [Google Scholar]