

Abstract
In recent years a number of multivariate approaches have been introduced to map neural systems in health and disease. In this review, we focus on spatial covariance methods applied to functional imaging data to identify patterns of regional activity associated with behavior. In the rest state, this form of network analysis can be used to detect abnormal topographies reflecting regional changes in distributed neural systems. In activation experiments, this approach can be used to quantify network–performance relationships in normal and disease cohorts. Functional changes in the relevant neural systems are likely to underlie the behavioral abnormalities observed in a variety of disease and treatment conditions.
Keywords: Neural systems, Covariance analysis, Sequence learning, Positron emission tomography (PET), Parkinson’s disease (PD)
1. Introduction
The concept of spatially distributed neural networks has been applied to functional brain imaging data, especially in the context of activation experiments. However, the demonstration of multiple discrete regions with signiWcant activation responses during task performance does not necessarily imply a functional relationship of these regions to one another as elements of a distinct neural system. Moreover, even if a large local activation response can be detected by image subtraction (i.e., subtracting the activation from the reference conditions to create a “difference” image), the individual differences across subjects and/or experimental conditions often are not related to task performance (Sidtis, Strother, & Rottenberg, 2003). In recent years, a number of multivariate approaches have been developed to characterize spatial covariance patterns in rest and activation imaging data (e.g., McIntosh, Bookstein, Haxby, & Grady, 1996; Worsley, Poline, Friston, & Evans, 1997). These approaches have been particularly useful in identifying functional networks associated with quantitative performance indices in both normal and disease states (Alexander et al., 1999; Nakamura et al., 2001). In this paper, we will show how this neural systems approach can be used to study the relationship between learning performance and simultaneously recorded patterns of regional activation. Likewise, we will demonstrate the utility of the approach to quantify behaviorally relevant network measures in the resting state.
2. Abnormal neural systems in the resting state: Spatial covariance patterns in disease
The movement disorders constitute a subtype of neurological disease in which the functional organization of neural systems is disrupted, resulting in a set of fairly consistent phenotypes (Wichmann & DeLong, 1998). Of these, Parkinson’s disease (PD) is the most common and probably the best understood from the standpoint of network organization. In this chapter, we will focus on the issue of imaging to quantify network activity in imaging data acquired in the resting condition, as opposed to data acquired during the performance of a behavioral activation task in PD, particularly with respect to network progression and treatment effects. We will also examine the relationship between network activity and learning performance in healthy volunteers and PD patients. These studies will provide an example of how brain activation experiments can be used to assess the status of biologically relevant neural systems in neurological disease.
2.1. Parkinson’s disease-related spatial covariance patterns
Parkinson’s disease is a neurodegenerative disorder characterized by motor and non-motor symptoms. The three cardinal motor symptoms of PD are resting tremor, bradykinesia (slowing of movement), and rigidity; non-motor features can include, cognitive impairment, affective disorder, and other clinical features (Langston, 2006). Data from experimental animal models consistently suggest that the manifestations of parkinsonism cannot be attributed to dysfunction of the basal ganglia in isolation. A comprehensive understanding of the clinical signs and symptoms of PD should ideally take into account the functional interactions of the basal ganglia with the thalamus and motor cortices within the context of spatially distributed neural networks (Eidelberg et al., 1994). To identify specific spatial covariance patterns associated with PD and other movement disorders, we have used resting state PET imaging in conjunction with network analysis of multisubject and multiregional data (Alexander & Moeller, 1994; see e.g., Eidelberg, Edwards, Mentis, Dhawan, & Moeller, 2000; Carbon & Eidelberg, 2002; Eckert & Eidelberg, 2005). This technique is based upon principal component analysis (PCA) and allows for the identification of disease-related patterns of regional metabolic covariation (i.e., brain networks) and the quantiWcation of pattern expression (i.e., network activity) in individual subjects. This spatial covariance pattern approach can be applied to imaging data analyzed with either region-of-interest (ROI) or voxel-based methods (Moeller et al., 1999). Using network analysis, we identified a specific regional metabolic network in PD patients scanned in the resting state (Asanuma et al., 2005; Eidelberg et al., 1994; Moeller et al., 1999; Trošt et al., 2006). The PD-related covariance pattern (PDRP; Fig. 1A) is characterized by pallidal and thalamic hypermetabolism associated with metabolic decrements in the lateral premotor cortex (PMC), the supplementary motor area (SMA), the dorsolateral prefrontal cortex (DLPFC), and the parieto-occipital association regions (Fig. 1A). This abnormal topography has since been validated in different ways: (1) PDRP activity reproducibly discriminates PD patients from controls in subsequent populations (Asanuma et al., 2005). Indeed, this pattern has been identified in six independently scanned patient populations (Feigin et al., 2002a; Lozza et al., 2004; Moeller et al., 1999). (2) PDRP measurements are highly reproducible within and between PET imaging sessions (Ma, Tang, Spetsieris, Dhawan, & Eidelberg, in press). (3) PDRP activity in individual patients (i.e., the subject scores) correlates consistently with motor disability in multiple independent patient populations (Asanuma et al., in press; Eidelberg et al., 1995; Lozza et al., 2004). (4) The PDRP is detectable early in the course of disease and its expression increases with disease progression (Eckert & Eidelberg, 2005). (5) PDRP activity correlates with internal pallidal (GPi) single unit activity recorded during surgery (Eidelberg et al., 1997b) and is modulated by focal stereotaxic interventions in the ventral GPi pallidum and in the subthalamic nucleus (STN) (Fukuda et al., 2001b; Su et al., 2001; Trošt et al., 2003; Asanuma et al., in press; Trošt et al., 2006). These data relate the PDRP network to the motoric features of parkinsonism. However, recently conducted network analyses of FDG PET data have revealed additional statistically independent (orthogonal) metabolic topographies associated with the cognitive manifestations of this disorder (Fig. 1B, cf. Lozza et al., 2004; Mentis et al., 2002). These reproducible PD-related cognitive patterns (PDCPs) have a slower evolution during early disease stages than the PDRP (Huang, Carbon, Mattis, & Eidelberg, 2006).
Fig. 1.

Identified Parkinson’s disease spatial covariance patterns. (A) Parkinson’s disease-related metabolic covariance pattern (PDRP). This PD-related pattern (PDRP) was identified by network analysis of [18F]-fluorodeoxyglucose (FDG) positron emission tomography scans from 20 PD patients and 20 age-matched healthy volunteers (Carbon & Eidelberg, 2002). This pattern (representing the Wrst principal component, which accounted for 20.7% of the subject × voxel variation) was characterized by relative pallidothalamic (left), pontine, and cerebellar hypermetabolism (right), associated with metabolic decrements in the lateral premotor and posterior parietal areas (bottom). PDRP expression was significantly increased in the PD cohort (p < .00001) compared to controls. In a prospective individual case analysis, we computed the expression of the PDRP in 14 subsequent PD patients and 14 control subjects (Asanuma et al., 2005). As in the original analysis, prospectively computed PDRP scores were significantly elevated in the disease group (p < .00001). [The display represents voxels associated with a significant correlation (p < .001) between local metabolic rate and pattern expression. These were also demonstrated to be reliably different from zero by bootstrap estimation procedures (p < .001). Voxels with positive region weights (metabolic increases) are color coded from red to yellow; those with negative region weights (metabolic decreases) are color coded from blue to purple]. (B) Parkinson’s disease-related metabolic pattern associated with cognitive performance (PDCP). This cognition-related spatial covariance pattern was identified in the network analysis of FDG PET scans from 15 non-demented PD patients with mild-moderate motor symptoms (Mentis et al., 2002). This metabolic network was independent (orthogonal) to the PDRP and accounted for 17.6% of the subject × voxel variation. This pattern was characterized by relative hypometabolism of dorsolateral prefrontal cortex (DLPFC), preSMA, and superior parietal regions (right), associated with cerebellar/dentate nucleus (DN) metabolic increases (left). Subject scores for this pattern correlated significantly (p < .01) with psychometric indices of executive functioning and verbal learning (California Verbal Learning Test, CVLT). The activity of this network was highest and cortical metabolism lowest in subjects with impaired verbal learning and executive functioning. In a prospective analysis, we quantiWed PDCP expression in the FDG PET scans of 32 subsequent PD patients on an individual case basis. Those computed scores accurately predicted verbal learning performance in these subjects (p < .005). [The display represents voxels that contribute significantly to the network at p < .001 and that are reliably different from zero by bootstrap estimation procedures (p < .05). Voxels with positive region weights (metabolic increases) are color coded from red to yellow; those with negative region weights (metabolic decreases) are color coded from blue to purple].
These resting state studies indicate that the PDRP and associated metabolic covariance patterns are not simply statistical features of brain function in PD. Rather, these topographies represent robust disease descriptors linked to the spatially distributed network abnormalities that characterize this illness. Our findings also suggest that the mechanisms underlying the non-motor features of disease are distinct from those associated with motor disability. In the next two sections, we will show how these abnormal patterns can be used to determine rates of disease progression and to assess treatment responses on a systems basis.
2.2. Network evolution during disease progression
In a recently completed longitudinal study (Asanuma, Dhawan, Carbon, & Eidelberg, 2004; Huang, Feigin, Ma, & Eidelberg, 2005), we scanned 15 early stage PD patients [Hoehn & Yahr 1; disease duration ≤2 years] at baseline, 24 and 48 months. All subjects underwent serial PET imaging to determine longitudinal changes in resting state metabolic network expression. The patients were also scanned with [18F] fluoropropyl βCIT to quantify caudate and putamen dopamine transporter (DAT) binding, a measure of nigrostriatal dopamine loss (Ma et al., 2002). We found that disease severity ratings increased over the four-year study period, at a 2.2 U per year corresponding to an annualized rate of 23% (p<.0001). Concurrently, putamen DAT binding declined at an annualized rate of 6.6% (p<.005). An increase in PDRP expression was also noted with disease progression (p<.0001; Fig. 2, top) at a rate of 2.6 U per year. The changes in PDRP score correlated with concurrent increases in the motor UPDRS (r=.62,p<.005) and declines in putamen DAT binding (r=−.56, p<.02). The presence of moderate correlations between the clinical and the imaging descriptors suggests that only approximately 30% of the variability in clinical progression can be explained by either of the two imaging descriptors. These data are consistent with the notion that different types of biomarkers (clinical, dopaminergic, and network) are associated with distinct aspects of disease progression.
Fig. 2.
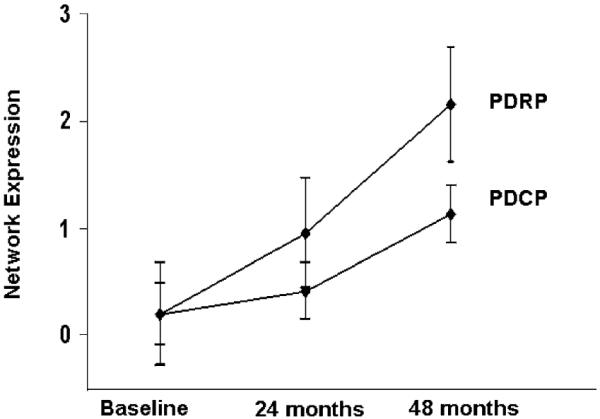
Changes in network expression with disease progression. Mean expression of the PD-related metabolic covariance patterns (Fig. 1) computed in 15 early PD patients scanned longitudinally with FDG PET (see text). The data indicate that the activity of both metabolic topographies progress over time (p < .005). However, the rate of change in network expression is significantly slower for the cognition-related PDCP pattern (p < .02).
We additionally found that PDCP expression also increased with time (p<.0001; Fig. 2, bottom). However, these scores changed at a rate of 1.5 U per year, which was slower than for the PDRP. Notably, increases in PDCP expression relative to baseline reached significance only at the third time point (p<.0001, post hoc t-test), compatible with a curvilinear trajectory characterized by a slow increase followed by late acceleration. Within-subject correlations of PDCP scores with changes in UPDRS ratings and caudate/putamen DAT binding were not significant (p>.1). These findings indicate that the expression of PD-related spatial covariance patterns increases during the early clinical stages of the disease. The time course of the PDRP and PDCP topographies appears to be different, suggesting that disease progression can vary in “motor” and “non-motor” pathways.
2.3. Effects of treatment on network expression
Stereotaxic surgical interventions afford a unique way of assessing network changes in brain function subsequent to discrete lesioning or stimulation of key nodes within the cortico-striato-pallido-thalamocortical (CSPTC) circuitry (Wichmann & DeLong, 1996). [In PD, this motor loop is altered in that it is associated with increased STN and internal pallidal (GPi) activity, resulting in excessive inhibitory outflow from the basal ganglia to the thalamus and brainstem (Eidelberg et al., 1997b; cf. Vitek & Giroux, 2000)]. The results of a comprehensive study of changes in network activity with intervention, has been summarized elsewhere (Asanuma et al., in press; Eckert & Eidelberg, 2005). The initial studies examined the effects of deep brain stimulation (DBS) of the internal globus pallidus (GPi) (Fukuda et al., 2001b). We used FDG PET to scan PD patients with GPi DBS in the 12 h off-medication resting state (12 h after the cessation of oral antiparkinsonian medications) to compare brain glucose metabolism on and off stimulation. GPi stimulation led to significant suppression of PDRP network activity; the degree to which the network was reduced by DBS correlated significantly with improvement in standardized motor ratings.
Subsequently, we reported similar findings with subthalamic nucleus (STN) lesioning (Su et al., 2001; Trošt et al., 2003) and DBS (Asanuma et al., in press; Trošt et al., 2006). Although PDRP suppression was common to these interventions, the magnitude of network reduction differed according to mode of treatment (lesion or stimulation) and stereotaxic target (GPi or STN), with the STN being perhaps the most metabolically influential node within the motor CSPTC circuit (cf. Hamani, Saint-Cyr, Frasier, Kaplitt, & Lozano, 2004). Indeed, the degree of network modulation with STN DBS is comparable to that of acute levodopa infusion (Asanuma et al., in press; Feigin et al., 2001), consistent with the mechanistic similarities of the two interventions. By contrast, PDCP expression was not altered by any of these antiparkinsonian interventions, including levodopa administration, in keeping with the clinical ineffectiveness of such intervention in treating non-motor PD signs and symptoms.
In summary, the network analysis of resting state functional imaging data can reveal specific patterns of abnormal brain organization. Indeed, we have found that the metabolic topography of PD, an akinetic-rigid movement disorder, is quite different from those identified in hyperkinetic disorders such as Tourette syndrome and Huntington’s disease (Eckert & Eidelberg, 2005; Eidelberg et al., 1997a). In these conditions, the metabolic topography involves reductions in striatal and thalamic activity associated with relative increases in motor cortical regions (cf. Asanuma et al., 2005). Moreover, within a given disease, sets of independent topographies may underlie discrete aspects of the clinical phenotype that may differ according to natural history and treatment response. In the next section, we will describe how network modeling can provide insights into the relationship between spatially distributed neural responses and task performance during activation.
3. Modulation of neural systems during activation: Brain networks and task performance
Spatial covariance methods have also been applied to activation data to characterize regional patterns associated with task performance. specifically, PCA can be used to capture the multidimensional nature of activation responses in individual brain regions. In one variant of this approach, activation and rest scans are subtracted prior to PCA (Alexander et al., 1999; Nakamura et al., 2001). A recent extension of this model has been developed to identify covariance patterns in which regional activation changes with task condition on a subject-by-subject basis (Habeck et al., 2005). This more general approach utilizes canonical variates analysis (CVA) and has been applied successfully in several cognitive imaging studies (e.g., Bell-McGinty et al., 2004; Habeck et al., 2004). Irrespective of the multivariate model employed, the biological relevance of the resulting spatial covariance patterns rests upon the demonstration of a reproducible relationship between network activity and individual differences in task performance measured during imaging.
In this section, we will discuss motor sequence learning as an example of how this network approach can be used to map neural systems in brain activation experiments. The processing of complex behaviors such as the learning of sequential information requires the concerted interaction of cortico-cortical and cortico-subcortical functional pathways (e.g., Hikosaka et al., 1999; Koechlin, Anton, & Burnod, 1996). Because standard univariate correlations between behavior and brain activity do not directly assess these regional interactions, alternative multivariate approaches are needed to quantify changes in the activity of distributed networks across tasks and treatment conditions.
As part of these studies, we developed a behavior paradigm (Nakamura et al., 2001) to study sequence learning performance and its relationship to brain activation in healthy volunteers. Briefly, during H215O PET imaging, all subjects performed two reaching tasks with similar kinematic requirements: (1) SEQ: a motor sequence learning task, and (2) CCW: a motor execution reference task requiring movements to targets appearing in a counterclockwise fashion. In both tasks, subjects moved a cursor on a digitizing tablet with their dominant right hand out and back from a central starting position to one of eight radial targets that were displayed on a computer screen. In SEQ, the eight targets were presented in a repeating non-predictable order. Subjects were explicitly instructed to learn the order of the sequence while reaching for the targets, and when possible, to anticipate target appearance and to reach each target in synchrony with the tone. In the motor reference task targets appeared in a predictable counterclockwise order. During the recording of rCBF in SEQ, we measured the total number of correct anticipatory movements. This measure was considered to reXect an index of the overall retrieval of previously acquired targets (Ghilardi, Eidelberg, Silvestri, & Ghez, 2003a). In each cycle, we also identified the number of correctly anticipated targets that had not been anticipated in the previous cycle. This measure reflects the successful acquisition (ACQ) of new targets (Carbon et al., 2004a). Learning indices were utilized as behavioral comparators and as covariates for image analyses.
The kinematic similarity of the SEQ and CCW tasks justified an image subtraction approach, which we used in conjunction with PCA to identify specific activation patterns related to learning performance. Indeed, in healthy volunteers, target acquisition and retrieval were each associated with reproducible, statistically independent (orthogonal) covariance patterns (Nakamura et al., 2001). The acquisition of target order during the initial phases of learning was associated with activation of a network involving the striatum and left ventral prefrontal cortex (vPFC) (Fig. 3A). By contrast, the retrieval of learned targets was associated with activation of a more widespread network comprising the dorsolateral prefrontal cortex (DLPFC), premotor cortices, and the anterior cingulate area, as well as the parietal and occipital association regions (Fig. 3B). In a prospective analysis of a second group of normal subjects scanned during task performance, computed scores for the two patterns predicted approximately 60–65% of intersubject differences in learning performance (Carbon et al., 2003).
Fig. 3.

Network analysis of activation data from healthy volunteers scanned during motor sequence learning. (A) Target acquisition: principal components analysis (PCA) of image subtraction data from 18 healthy volunteers (Carbon et al., 2003) disclosed a significant spatial covariance pattern associated with target acquisition. This network topography (accounting for 9.0% of the subject × voxel variation) was characterized by learning-related activations (SEQ > CCW, see text) in the caudate and ventral prefrontal cortex, as well as in the superior temporal gyrus and posterior parietal regions. Subject scores for this pattern correlated with concurrent behavioral measures of target acquisition (R2 =.31, p < .01). Reprinted with permission of Wiley-Liss, Inc. a subsidiary of John Wiley & Sons, Inc. (B) Target retrieval: in the same analysis, an independent spatial covariance pattern was associated with target retrieval. This network topography (accounting for 9.2% of the subject × voxel variation) was characterized by bilateral learning-related activations in the dorsolateral prefrontal cortex (DLPFC) and premotor cortex (PMC), and in the left anterior cingulate area and the right inferior parietal cortex. Subject scores for this pattern correlated with concurrently measured retrieval indices (R2 =.60, p < .001). [Positive region weights (red–yellow) were thresholded at Z =2 to display clusters contributing significantly (p < .01) to the network].
Analogous prospective computations in separate cohorts of unmedicated PD patients revealed that the retrieval network was preserved in this disorder (Carbon et al., 2003). Having established this pattern as a functional imaging marker for sequence learning, we considered the possibility that effective antiparkinsonian therapy is associated with modulation of network activity. We compared the effects of deep brain stimulation (DBS) of the internal globus pallidus to the effects of acute levodopa infusion on learning network activation (Carbon et al., 2003). This was accomplished by prospectively computing network expression in the individual scans obtained in the different treatment conditions. Notably, both treatments yielded similar motor benefit as measured in CCW performance as well as in change of UPDRS motor scores assessed during the imaging session (Feigin et al., 2002b; Fukuda et al., 2001a). However, DBS and levodopa had opposite effects on both learning performance and network activity. GPi stimulation improved sequence learning and enhanced the expression of the retrieval network (Carbon et al., 2003; Fukuda et al., 2002). By contrast, levodopa infusion titrated to achieve a similar degree of motor benefit as DBS, reduced learning performance and related network activity (Carbon et al., 2003; Feigin et al., 2003). When both treatment groups were combined, the treatment-induced changes in learning correlated significantly with alterations in network activity (Fig. 4). Indeed, we have recently observed similar findings in PD patients scanned while executing the learning and control tasks during STN stimulation.
Fig. 4.
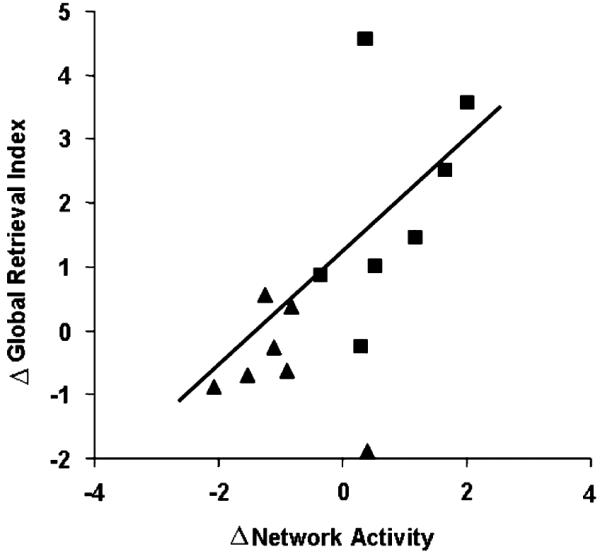
Changes in learning performance and network activity during acute antiparkinsonian intervention with deep brain stimulation (DBS) (squares) or levodopa infusion (triangles). Treatment-mediated changes in the subject scores for the normal retrieval network (Fig. 3B) correlated significantly with concurrently measured changes in the global retrieval index (R2 =.40, p < .01). Learning performance and network activity tended to increase during DBS and to decline with levodopa infusion (see Carbon et al., 2003). Reprinted with permission of Wiley-Liss, Inc. a subsidiary of John Wiley & Sons, Inc.
Overall, the application of network analysis to activation data has provided a number of insights into mechanisms of learning in health and disease. In healthy volunteers, prospectively computed measures of network activity accurately predicted individual learning performance. This suggests that the neural systems mediating this form of learning are fairly constant from a topographical point of view. Moreover, these patterns are also engaged in cohorts of unmedicated PD patients performing the sequence learning task. Thus, the same neural systems normally involved in sequence learning are also employed in affected parkinsonian patients. This is a reasonable expectation in the setting of a neurodegenerative process that begins at mid-life (see e.g., Moeller & Eidelberg, 1997).
We note that sequence learning may also be impaired in other neurological conditions, even in the absence of motor manifestations. In these situations, exemplified by non-penetrant mutation carriers for hereditary movement disorders (Eidelberg and Carbon, 2003), task performance is associated with alternative learning networks. For instance, in non-manifesting carriers of the DYT1 gene for torsion dystonia, sequence learning is mediated by a cerebellar-prefrontal activation pattern (Carbon, Trošt, Ghilardi, & Eidelberg, 2004b; Ghilardi et al., 2003b). Similarly, preclinical carriers of the Huntington disease (HD) mutation utilize a mediodorsal thalamic-orbitofrontal functional pathway during task performance (Feigin et al., 2006). In both conditions, early striatal dysfunction appears to be compensated by default systems that are not necessarily optimized to achieve normal levels of sequence learning.
Network analysis of activation data has also been valuable in determining the effects of treatment on relevant neural systems. In PD, a salient finding has been that different therapeutic approaches, while yielding comparable motor benefit, can exert opposite effects on learning performance and associated activation responses (Carbon & Eidelberg, 2002). This observation suggests that DBS can enhance the functioning of higher order CSPTC loops and related pathways. The effect of levodopa on learning-related activation, however, appears to be more heterogeneous. Using different tasks with a stronger emphasis on working memory, others have shown an improvement of cognitive functioning and a normalization of related brain activation (Cools, Stefanova, Barker, Robbins, & Owen, 2002; Mattay et al., 2002). We hypothesize that in the setting of equivalent motor benefit, the divergent effects of levodopa and DBS on learning reflect the differential contribution of tonic (motor execution) and phasic (learning) striatal dopamine release in the respective processes. The effects of new antiparkinsonian strategies such as subthalamic gene therapy on these neural systems are a topic of ongoing investigation (Feigin et al., 2005b). A network approach to quantify the modulation of neural circuitry during treatment may help to determine the potential utility of these novel interventions.
4. Summary
The application of spatial covariance methods to functional imaging has proven useful in identifying abnormal patterns of regional activity in neurological disease, particularly in Parkinson’s disease and related disorders. Imaging subjects in the resting state is technically simple and can be exploited to reveal disease-specific alterations in functional brain organization. By contrast, experimentally more challenging activation studies can provide relevant information concerning adaptive mechanisms to compensate for ongoing neurodegenerative processes.
Acknowledgments
This work was supported by NIH R01 NS 35069, 37564, 047668, and P50 38370.
References
- Alexander GE, Moeller JR. Application of the scaled subprofile model to functional imaging in neuropsychiatric disorders: a principal component approach to modeling brain function in disease. Human Brain Mapping. 1994;2:1–16. [Google Scholar]
- Alexander GE, Mentis MJ, Van Horn JD, Grady CL, Berman KF, Furey ML, et al. Individual differences in PET activation of object perception and attention systems predict face matching accuracy. Neuroreport. 1999;10:1965–1971. doi: 10.1097/00001756-199906230-00032. [DOI] [PubMed] [Google Scholar]
- Asanuma K, Dhawan V, Carbon M, Eidelberg D. Assessment of disease progression in parkinsonism. Journal of Neurology. 2004;251(Suppl. 7):4–8. doi: 10.1007/s00415-004-1703-6. [DOI] [PubMed] [Google Scholar]
- Asanuma K, Ma Y, Huang C, Carbon-Correll M, Edwards C, Raymond D, et al. The metabolic pathology of doparesponsive dystonia. Annals of Neurology. 2005;57:596–600. doi: 10.1002/ana.20442. [DOI] [PubMed] [Google Scholar]
- Asanuma K, Tang C, Ma Y, Dhawan V, Mattis P, Edwards C, et al. Network modulation in the treatment of Parkinson’s disease. Brain. doi: 10.1093/brain/awl162. in press. (Epub ahead of print) [DOI] [PMC free article] [PubMed] [Google Scholar]
- Bell-McGinty S, Habeck C, Hilton HJ, Rakitin BC, Scarmeas N, Zarahn E, et al. Identification and differential vulnerability of a neural network in sleep deprivation. Cerebral Cortex. 2004;14:496–502. doi: 10.1093/cercor/bhh011. [DOI] [PubMed] [Google Scholar]
- Carbon M, Eidelberg D. Modulation of regional brain function by deep brain stimulation: studies with positron emission tomography. Current Opinion in Neurology. 2002;15:451–455. doi: 10.1097/00019052-200208000-00008. [DOI] [PubMed] [Google Scholar]
- Carbon M, Ghilardi MF, Feigin A, Fukuda M, Nakamura T, Dhawan V, et al. Learning networks in health and Parkinson’s disease: reproducibility and treatment effects. Human Brain Mapping. 2003;19:197–211. doi: 10.1002/hbm.10115. [DOI] [PMC free article] [PubMed] [Google Scholar]
- Carbon M, Ma Y, Barnes A, Dhawan V, Chaly T, Ghilardi MF, et al. Caudate nucleus: influence of dopaminergic input on sequence learning and brain activation in parkinsonism. Neuroimage. 2004a;21:1497–1507. doi: 10.1016/j.neuroimage.2003.12.014. [DOI] [PubMed] [Google Scholar]
- Carbon M, Trošt M, Ghilardi MF, Eidelberg D. Abnormal brain networks in primary torsion dystonia. Advances in Neurology. 2004b;94:155–170. [PubMed] [Google Scholar]
- Cools R, Stefanova E, Barker RA, Robbins TW, Owen AM. Dopaminergic modulation of high-level cognition in Parkinson’s disease: the role of the prefrontal cortex revealed by PET. Brain. 2002;125:584–594. doi: 10.1093/brain/awf052. [DOI] [PubMed] [Google Scholar]
- Eckert T, Eidelberg D. Neuroimaging and therapeutics in movement disorders. NeuroRx. 2005;2:361–371. doi: 10.1602/neurorx.2.2.361. [DOI] [PMC free article] [PubMed] [Google Scholar]
- Eidelberg D, Moeller JR, Dhawan V, Spetsieris P, Takikawa S, Ishikawa T, et al. The metabolic topography of parkinsonism. Journal of Cerebral Blood Flow and Metabolism. 1994;14:783–801. doi: 10.1038/jcbfm.1994.99. [DOI] [PubMed] [Google Scholar]
- Eidelberg D, Moeller JR, Ishikawa T, Dhawan V, Spetsieris P, Chaly T, et al. Assessment of disease severity in parkinsonism with fluorine- 18-fluorodeoxyglucose and PET. Journal of Nuclear Medicine. 1995;36:378–383. [PubMed] [Google Scholar]
- Eidelberg D, Moeller J, Antonini A, Kazumata K, Dhawan V, Budman C, et al. The metabolic anatomy of Tourette syndrome. Neurology. 1997a;48:927–934. doi: 10.1212/wnl.48.4.927. [DOI] [PubMed] [Google Scholar]
- Eidelberg D, Moeller JR, Kazumata K, Antonini A, Sterio D, Dhawan V, et al. Metabolic correlates of pallidal neuronal activity in Parkinson’s disease. Brain. 1997b;120:1315–1324. doi: 10.1093/brain/120.8.1315. [DOI] [PubMed] [Google Scholar]
- Eidelberg D, Edwards C, Mentis M, Dhawan V, Moeller JR, Mazziotta JC, Toga AW, Frackowiak RSJ. Brain mapping: The disorders. Academic Press; San Diego: 2000. Movement disorders: Parkinson’s disease; pp. 241–261. [Google Scholar]
- Feigin A, Fukuda M, Dhawan V, Przedborski S, Jackson-Lewis V, Mentis MJ, et al. Metabolic correlates of levodopa response in Parkinson’s disease. Neurology. 2001;57:2083–2088. doi: 10.1212/wnl.57.11.2083. [DOI] [PubMed] [Google Scholar]
- Feigin A, Antonini A, Fukuda M, DeNotaris R, Benti R, Pezzoli G, et al. Tc-99m ethylene cysteinate dimer SPECT in the differential diagnosis of parkinsonism. Movement Disorders. 2002a;17:1265–1270. doi: 10.1002/mds.10270. [DOI] [PubMed] [Google Scholar]
- Feigin A, Ghilardi MF, Fukuda M, Mentis MJ, Dhawan V, Hacking A, et al. Effects of levodopa on motor activation responses in Parkinson’s disease. Neurology. 2002b;59:220–226. doi: 10.1212/wnl.59.2.220. [DOI] [PubMed] [Google Scholar]
- Feigin A, Ghilardi MF, Carbon M, Edwards C, Mattis P, Mentis MJ, et al. Effects of levodopa on motor sequence learning in Parkinson’s disease. Neurology. 2003;60:1744–1749. doi: 10.1212/01.wnl.0000072263.03608.42. [DOI] [PubMed] [Google Scholar]
- Feigin A, Ghilardi MF, Huang C, Ma Y, Carbon M, Guttman M, et al. Preclinical Huntington’s disease: compensatory brain responses during learning. Annals of Neurology. 2006;59:53–59. doi: 10.1002/ana.20684. [DOI] [PMC free article] [PubMed] [Google Scholar]
- Feigin A, Kaplitt MG, During MJ, Strybing K, Cox M, Dhawan V, et al. Gene therapy for Parkinson’s disease with AAV-GAD: an open label, dose escalation, safety-tolerability trial. Movement Disorders. 2005b;20:1236. [Google Scholar]
- Fukuda M, Mentis MJ, Ghilardi MF, Dhawan V, Antonini A, Hammerstad J, et al. Functional correlates of pallidal stimulation for Parkinson’s disease. Annals of Neurology. 2001a;49:155–165. doi: 10.1002/1531-8249(20010201)49:2<155::aid-ana35>3.0.co;2-9. [DOI] [PubMed] [Google Scholar]
- Fukuda M, Mentis MJ, Ma Y, Dhawan V, Antonini A, Lang AE, et al. Networks mediating the clinical effects of pallidal brain stimulation for Parkinson’s disease: a PET study of resting state glucose metabolism. Brain. 2001b;124:1601–1609. doi: 10.1093/brain/124.8.1601. [DOI] [PubMed] [Google Scholar]
- Fukuda M, Ghilardi MF, Carbon M, Dhawan V, Ma Y, Feigin A, et al. Pallidal stimulation for parkinsonism: improved brain activation during sequence learning. Annals of Neurology. 2002;52:144–152. doi: 10.1002/ana.10261. [DOI] [PubMed] [Google Scholar]
- Ghilardi M, Eidelberg D, Silvestri G, Ghez C. The differential effect of PD and normal aging on early explicit sequence learning. Neurology. 2003a;60:1313–1319. doi: 10.1212/01.wnl.0000059545.69089.ee. [DOI] [PubMed] [Google Scholar]
- Ghilardi MF, Carbon M, Silvestri G, Dhawan V, Tagliati M, Bressman SB, et al. Impaired sequence learning in carriers of the DYT1 dystonia mutation. Annals of Neurology. 2003b;54:102–109. doi: 10.1002/ana.10610. [DOI] [PubMed] [Google Scholar]
- Habeck C, Rakitin BC, Moeller J, Scarmeas N, Zarahn E, Brown T, et al. An event-related fMRI study of the neurobehavioral impact of sleep deprivation on performance of a delayed match-to-sample task. Cognitive Brain Research. 2004;18:306–321. doi: 10.1016/j.cogbrainres.2003.10.019. [DOI] [PubMed] [Google Scholar]
- Habeck C, Krakauer JW, Ghez C, Sackheim HA, Stern Y, Eidelberg D, et al. A new approach to spatial covariance modeling of functional brain imaging data: ordinal trend analysis. Neural Computation. 2005;17:1602–1645. doi: 10.1162/0899766053723023. [DOI] [PubMed] [Google Scholar]
- Hamani C, Saint-Cyr J, Frasier J, Kaplitt MG, Lozano AM. The subthalamic nucleus in the context of movement disorders. Brain. 2004;127:4–20. doi: 10.1093/brain/awh029. [DOI] [PubMed] [Google Scholar]
- Hikosaka O, Nakahara H, Rand MK, Sakai K, Lu X, Nakamura K, et al. Parallel neural networks for learning sequential procedures. Trends in Neuroscience. 1999;22:464–471. doi: 10.1016/s0166-2236(99)01439-3. [DOI] [PubMed] [Google Scholar]
- Huang C, Feigin A, Ma Y, Eidelberg D. Imaging measures of longitudinal change in Parkinson’s disease. Neurology. 2005;64:A235. [Google Scholar]
- Huang C, Carbon M, Mattis P, Eidelberg D. Metabolic patterns associated with cognitive function in Parkinson’s disease. Movement Disorders. 2006;20:S108. doi: 10.1016/j.neuroimage.2006.09.003. [DOI] [PMC free article] [PubMed] [Google Scholar]
- Koechlin E, Anton JL, Burnod Y. Dynamical computational properties of local cortical networks for visual and motor processing: a bayesian framework. Journal of Physiology-Paris. 1996;90:257–262. doi: 10.1016/s0928-4257(97)81435-0. [DOI] [PubMed] [Google Scholar]
- Langston JW. The Parkinson’s complex: parkinsonism is just the tip of the iceberg. Annals of Neurology. 2006;59:591–596. doi: 10.1002/ana.20834. [DOI] [PubMed] [Google Scholar]
- Lozza C, Baron JC, Eidelberg D, Mentis MJ, Carbon M, Marie RM. Executive processes in Parkinson’s disease: FDG PET and network analysis. Human Brain Mapping. 2004;22:236–245. doi: 10.1002/hbm.20033. [DOI] [PMC free article] [PubMed] [Google Scholar]
- Ma Y, Dhawan V, Mentis M, Chaly T, Spetsieris P, Eidelberg D. Parametric mapping of [18F] FPCIT binding in early stage Parkinson’s disease: a PET study. Synapse. 2002;45:125–133. doi: 10.1002/syn.10090. [DOI] [PubMed] [Google Scholar]
- Ma Y, Tang C, Spetsieris P, Dhawan V, Eidelberg D. Abnormal metabolic network activity in Parkinson’s disease: testretest reproducibility. Journal of Cerebral Blood Flow and Metabolism. doi: 10.1038/sj.jcbfm.9600358. [DOI] [PMC free article] [PubMed] [Google Scholar]
- Mattay VS, Tessitore A, Callicott JH, Bertolino A, Goldberg TE, Chase TN, et al. Dopaminergic modulation of cortical function in patients with Parkinson’s disease. Annals of Neurology. 2002;51:156–164. doi: 10.1002/ana.10078. [DOI] [PubMed] [Google Scholar]
- McIntosh AR, Bookstein FL, Haxby JV, Grady CL. Spatial pattern analysis of functional brain images using partial least squares. Neuroimage. 1996;3:143–157. doi: 10.1006/nimg.1996.0016. [DOI] [PubMed] [Google Scholar]
- Mentis MJ, McIntosh AR, Feigin A, Perrine K, Dhawan V, Mattis P, et al. Relationships between the metabolic patterns that correlated with mnemonic, visuospatial, and mood symptoms in Parkinson’s disease. American Journal of Psychiatry. 2002;159:746–754. doi: 10.1176/appi.ajp.159.5.746. [DOI] [PubMed] [Google Scholar]
- Moeller JR, Eidelberg D. Divergent expression of regional metabolic topographies in Parkinson’s disease and normal ageing. Brain. 1997;120:2197–2206. doi: 10.1093/brain/120.12.2197. Pt. 12. [DOI] [PubMed] [Google Scholar]
- Moeller JR, Nakamura T, Mentis MJ, Dhawan V, Spetsieris P, Antonini A, et al. Reproducibility of regional metabolic covariance patterns: comparison of four populations. Journal of Nuclear Medicine. 1999;40:1264–1269. [PubMed] [Google Scholar]
- Nakamura T, Ghilardi MF, Mentis M, Dhawan V, Fukuda M, Hacking A, et al. Functional networks in motor sequence learning: abnormal topographies in Parkinson’s disease. Human Brain Mapping. 2001;12:42–60. doi: 10.1002/1097-0193(200101)12:1<42::AID-HBM40>3.0.CO;2-D. [DOI] [PMC free article] [PubMed] [Google Scholar]
- Sidtis JJ, Strother SC, Rottenberg DA. Predicting performance from functional imaging data: Methods matter. NeuroImage. 2003;20:615–624. doi: 10.1016/S1053-8119(03)00349-5. [DOI] [PubMed] [Google Scholar]
- Su PC, Ma Y, Fukuda M, Mentis MJ, Tseng HM, Yen RF, et al. Metabolic changes following subthalamotomy for advanced Parkinson’s disease. Annals of Neurology. 2001;50:514–520. doi: 10.1002/ana.1232. [DOI] [PubMed] [Google Scholar]
- Trošt M, Barnes A, Simon ES, Dhawan V, Eidelberg D, Fodstad H. Changes in activity of abnormal metabolic brain networks in Parkinson’s disease patients treated with Vim DBS. Journal of Neurology. 2003;S2:250. [Google Scholar]
- Trošt M, Su S, Su PC, Yen R-F, Tseng H-M, Barnes A, et al. Network modulation by the subthalamic nucleus in the treatment of Parkinson’s disease. Neuroimage. 2006;31:301–307. doi: 10.1016/j.neuroimage.2005.12.024. [DOI] [PMC free article] [PubMed] [Google Scholar]
- Vitek JL, Giroux M. Physiology of hypokinetic and hyperkinetic movement disorders: model for dyskinesia. Annals of Neurology. 2000;47:S131–S140. [PubMed] [Google Scholar]
- Wichmann T, DeLong MR. Functional and pathophysiological models of the basal ganglia. Current Opinion in Neurobiology. 1996;6:751–758. doi: 10.1016/s0959-4388(96)80024-9. [DOI] [PubMed] [Google Scholar]
- Wichmann T, DeLong MR. Models of basal ganglia function and pathophysiology of movement disorders. Neurosurgery Clinics of North America. 1998;9:223–236. [PubMed] [Google Scholar]
- Worsley KJ, Poline JB, Friston KJ, Evans AC. Characterizing the response of PET and fMRI data using multivariate linear models. Neuroimage. 1997;6:305–319. doi: 10.1006/nimg.1997.0294. [DOI] [PubMed] [Google Scholar]